Best Grafana Websites of 2026 (20 Real-World Examples)
Grafana-associated websites, documented observability workloads, and a practical monitoring brief
These 20 public website examples connect to official Grafana cases, engineering sessions and a bounded integration tutorial. They show public design—not private dashboards. Grafana Cloud, open-source components, k6 and individual telemetry workloads are kept distinct rather than being collapsed into a generic whole-stack claim.
A monitoring interface should help someone make a decision. Before choosing a panel style, identify the service question, source of data, expected freshness and person responsible for acting on the result. The visual clarity of a company’s public website can be useful inspiration, but it cannot reveal how its operators investigate an incident.
Adobe, Atlassian, Cisco, Dell and Salesforce open the collection with explicitly scoped official sources. Those cover a developer observability stack, historical engineering practice, Cisco Live dashboards, a Cloud migration and service-health monitoring. Later examples preserve narrower boundaries: MIT Open Learning is not all MIT, Iowa’s College of Public Health is not the whole university, Carvana concerns k6, and Microsoft is an Azure integration example rather than proof of the microsoft.com frontend.
Before the examples
What makes good Grafana website development in 2026?
Name the question before the dashboard
Write the operator’s task in plain language: determine whether a service is responding, understand a changed behavior or investigate a particular event. Then decide which view helps answer it. A dramatic chart is not useful simply because it is visually impressive. Give the main state and the next investigation step more emphasis than decorative density.
Distinguish visualization from data storage
Grafana connects to data sources and queries them for display and exploration. The source can have different ownership, freshness and query semantics from the dashboard itself. Record where each important fact comes from and what a stale or missing value means. A Grafana label alone does not identify the storage engine or every telemetry component in a deployment.
An alert needs a meaningful condition, a responsible recipient and a next action. Grafana’s alerting documentation separates rules and notification configuration; the project must still decide how those fit the team. Test the explanation with someone who did not build the dashboard. If they cannot identify the affected service and first step, the visual treatment is not the main problem.
Read the public compositions for audience routing, hierarchy and task clarity. Read the linked official materials for their separately named monitoring, profiling, testing or integration workloads. Historical talks stay dated, and these references are not performance rankings or complete current application inventories.
We start with five recognizable brands or organizations: Adobe, Atlassian, Cisco, Dell, Salesforce. Each attribution applies to the named website property, not every product or website belonging to its organization. This is a curated reading sequence, not a measured ranking.
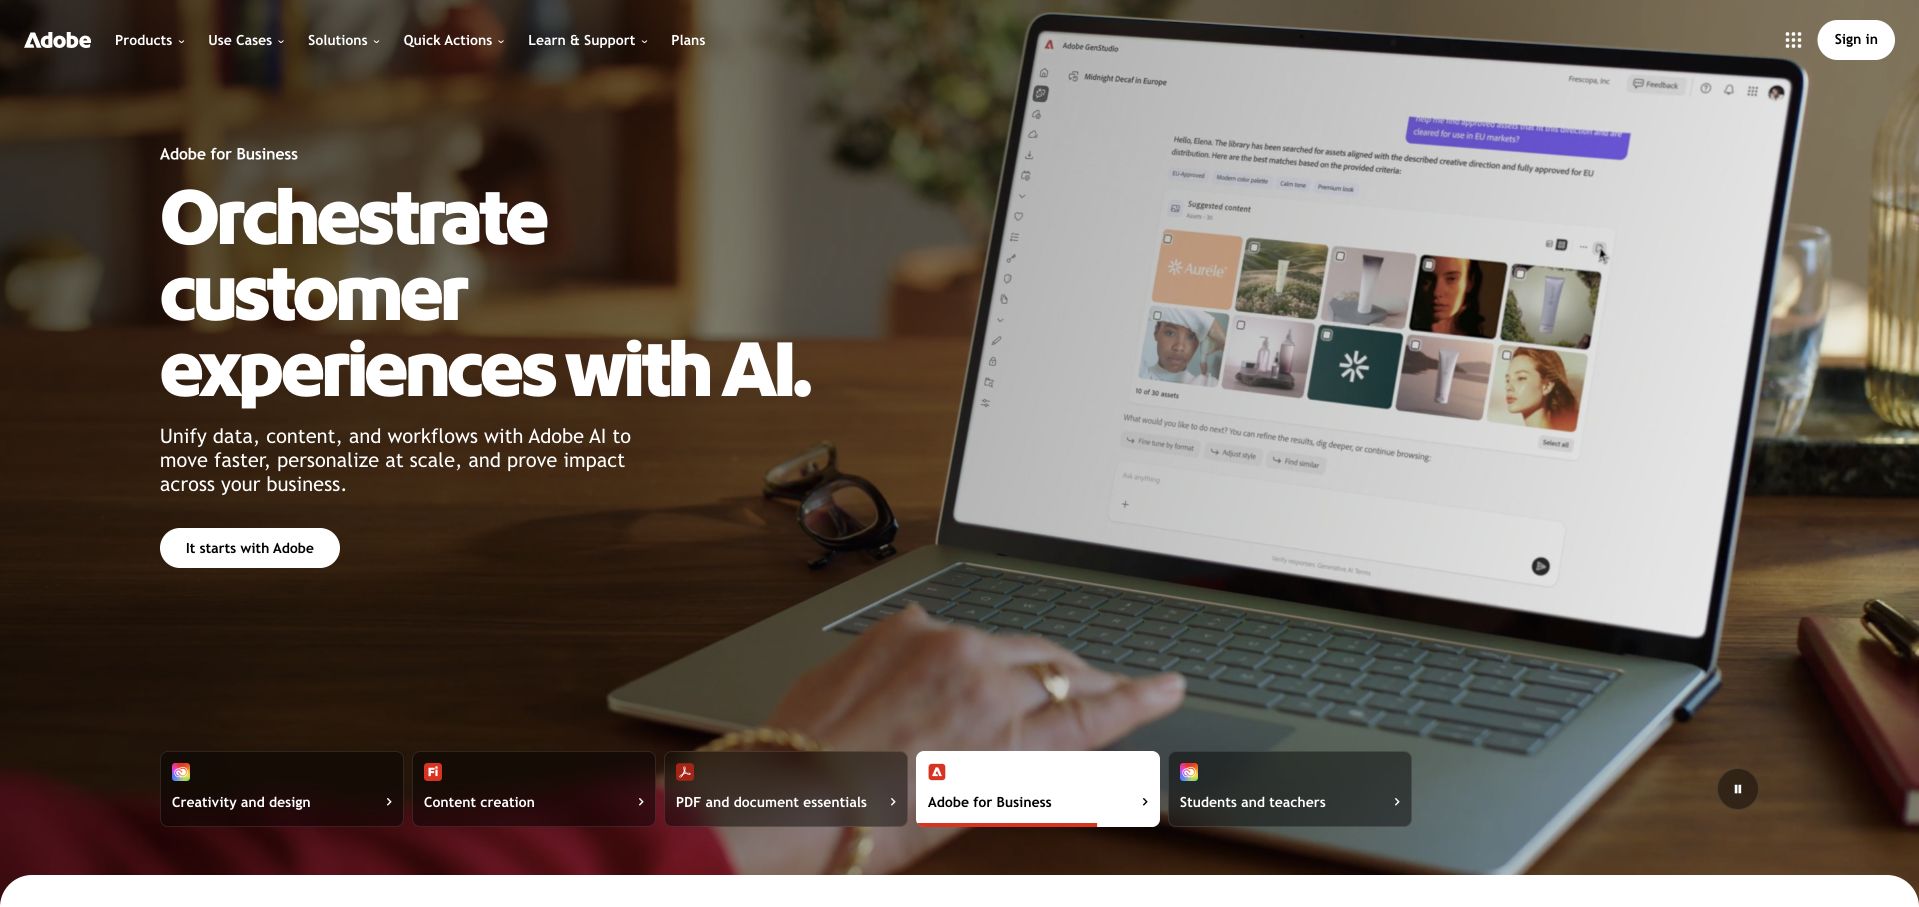
Adobe’s captured homepage gives one business-oriented campaign the entire main visual field, using a working-context image and a compact text block rather than many competing product cards. A row of audience choices near the bottom makes the larger portfolio visible, while the main navigation supplies products, solutions and learning routes. The useful design lesson is the layered hierarchy: the company can tell one coherent story at a time without pretending the same story is the right entrance for every visitor.
What you can learn
Apply that same discipline to observability: one public page is not the whole system. Grafana’s Adobe account specifically describes a developer observability stack involving Grafana, Mimir, Tempo and OpenTelemetry. It is not proof of the exact technology delivering this campaign page or every Adobe application.
Pros
Audience choices expose the wider product family without making the opening composition fragmented.
The contextual image gives an enterprise software message a tangible working environment.
Cons & considerations
A large campaign can postpone specific product discovery for returning visitors.
Photographic headlines need continued contrast checks as the visual and copy change.
Platform source: Adobe — official Grafana association. Adobe developer observability stack with Grafana, Mimir and Tempo. Official documentary association only. The named workload or listing is not proof that this public page runs on Grafana, nor a complete or independently tested current stack. Platform evidence is separate from the direct website screenshot and is not a complete current infrastructure audit.
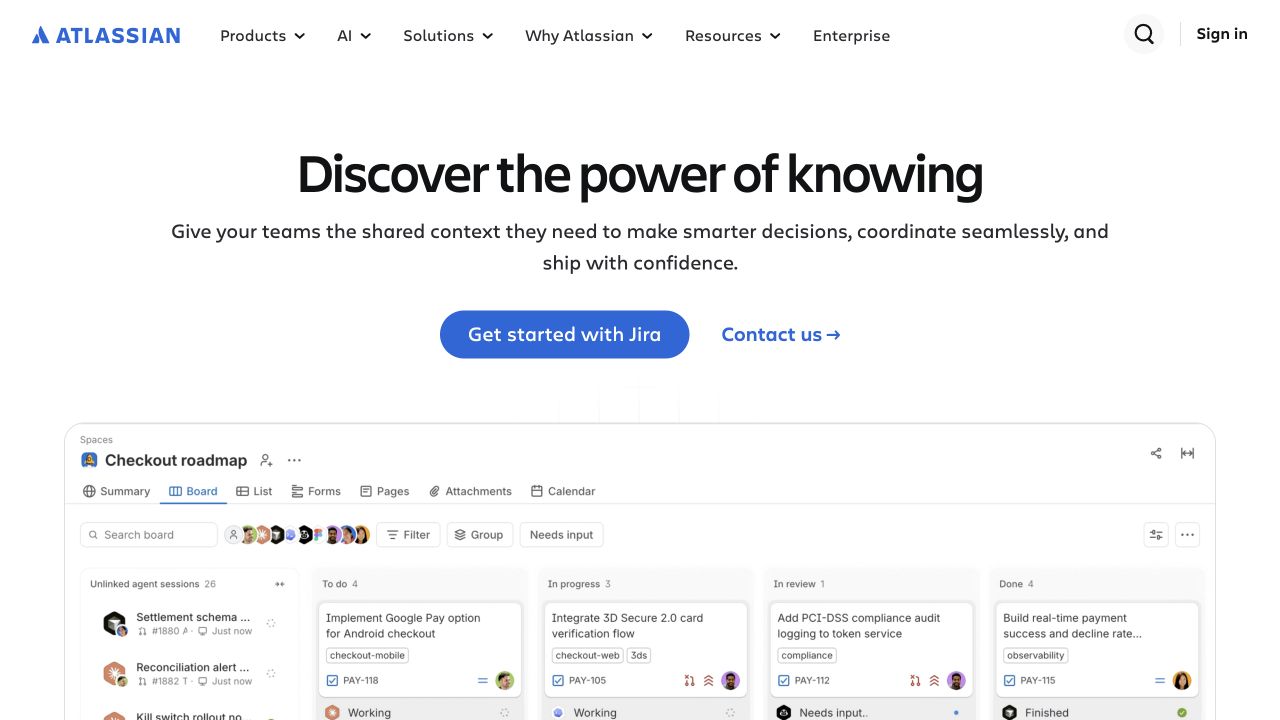
Atlassian places a short centered introduction above a large work-management interface. The white background and blue primary action leave the product view as the main supporting visual rather than surrounding it with decorative illustrations. Navigation separates products, AI, solutions, resources and enterprise audiences. The screenshot is useful because it shows a real organizing grammar—columns, tasks and status—without requiring the visitor to begin inside the application. It turns a broad collaboration proposition into something more concrete at the point of first evaluation.
What you can learn
Keep the product demonstration distinct from internal monitoring. Atlassian’s official 2023 Grafana event session describes the history of its observability practices. It is historical engineering context, not a fresh audit of this public page or a claim that all Atlassian products use one identical monitoring architecture.
Pros
The large interface view makes the product category understandable without an immediate login.
A clear visual hierarchy keeps the main action and explanatory copy separate from product detail.
Cons & considerations
Small interface labels can become decorative rather than informative when the image shrinks.
A broad collaboration statement still needs specific workflow examples for different teams.
Platform source: Atlassian — official Grafana association. Atlassian engineering observability talk; not a complete current stack claim. Official documentary association only. The named workload or listing is not proof that this public page runs on Grafana, nor a complete or independently tested current stack. Platform evidence is separate from the direct website screenshot and is not a complete current infrastructure audit.
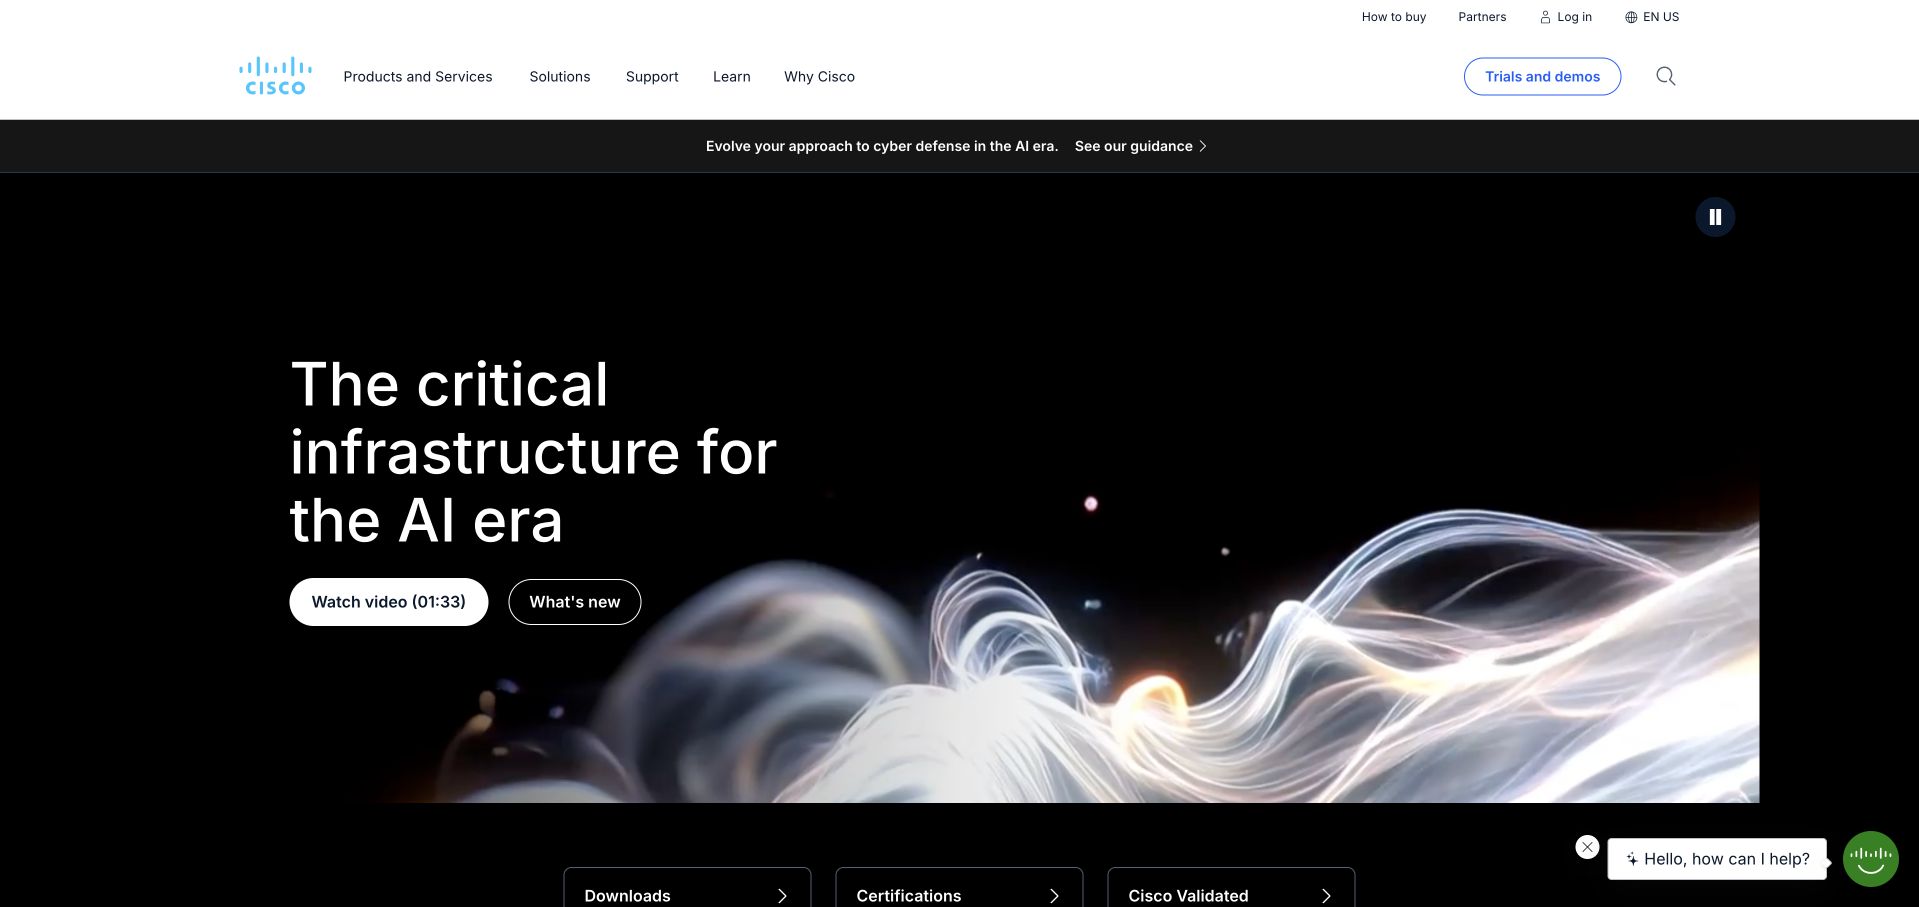
Cisco uses a light, compact header above a dark campaign field with a large infrastructure-oriented statement. An abstract flowing visual provides movement without turning the page into a hardware specification sheet. Video and news actions give the introduction two distinct ways forward, while quick routes begin beneath the main hero. The page is useful for studying how a large technical brand can remain visually restrained even when its product and service catalog is extensive and its opening message covers several complex topics.
What you can learn
Scope event monitoring separately from the corporate website. Grafana’s Cisco account concerns dashboards built for Cisco Live event operations. It does not establish every Cisco network, device, customer installation or frontend dependency behind the photographed marketing page. A recognizable brand is context, not an architecture specification.
Pros
The restrained header avoids making an extensive technical catalog dominate the first impression.
A dark campaign and flowing visual give the page a clear focal area.
Cons & considerations
Abstract infrastructure language needs concrete solution detail before an evaluator can assess relevance.
Video-led explanations require readable text alternatives and should not block practical product routes.
Platform source: Cisco — official Grafana association. Cisco Live event operations and Grafana dashboards. Official documentary association only. The named workload or listing is not proof that this public page runs on Grafana, nor a complete or independently tested current stack. Platform evidence is separate from the direct website screenshot and is not a complete current infrastructure audit.
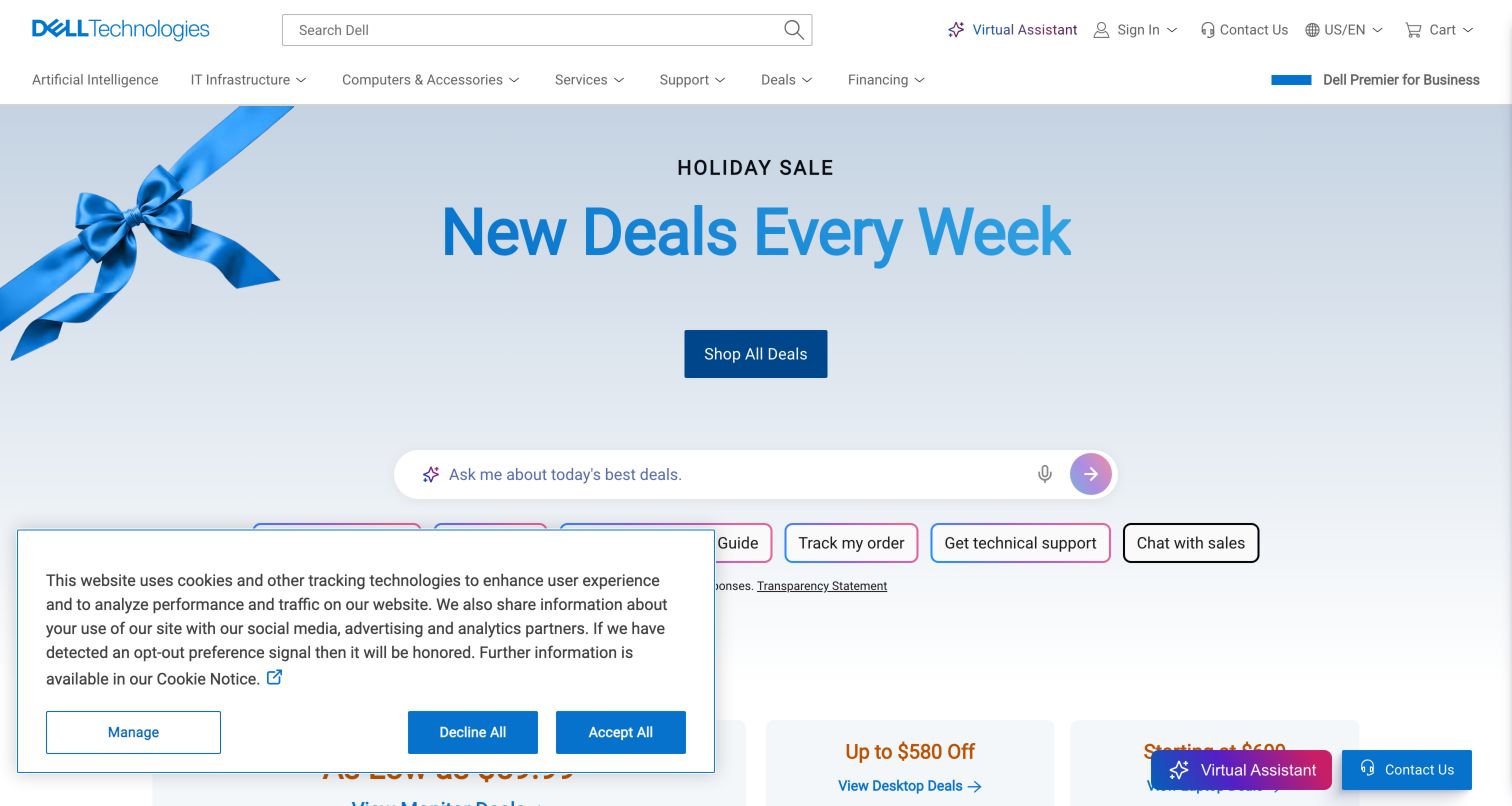
Dell gives its retail campaign a pale blue field, a simple seasonal headline and a clear shopping action. Product assistance, order tracking and technical support appear as compact routes beneath the main promotion. Those shortcuts are the most instructive part of the layout: they acknowledge that an established hardware brand serves customers after purchase as well as during shopping. The campaign provides visual energy, while the surrounding task structure keeps the site from behaving like a one-time advertisement.
What you can learn
Treat the operating environment as a separate layer from retail design. Grafana documents Dell’s migration and observability consolidation with Grafana Cloud. That account does not establish the exact monitoring installed on the consumer page, every Dell product or the architecture of customer equipment sold through the website.
Pros
Support and order-related controls remain available near the main campaign.
A restrained seasonal image allows the key action to stay visually distinct.
Cons & considerations
Multiple assistant and consent surfaces can crowd the otherwise simple retail hierarchy.
Broad monitoring success stories should not be expanded into claims about every consumer journey.
Platform source: Dell — official Grafana association. Dell observability migration to Grafana Cloud. Official documentary association only. The named workload or listing is not proof that this public page runs on Grafana, nor a complete or independently tested current stack. Platform evidence is separate from the direct website screenshot and is not a complete current infrastructure audit.
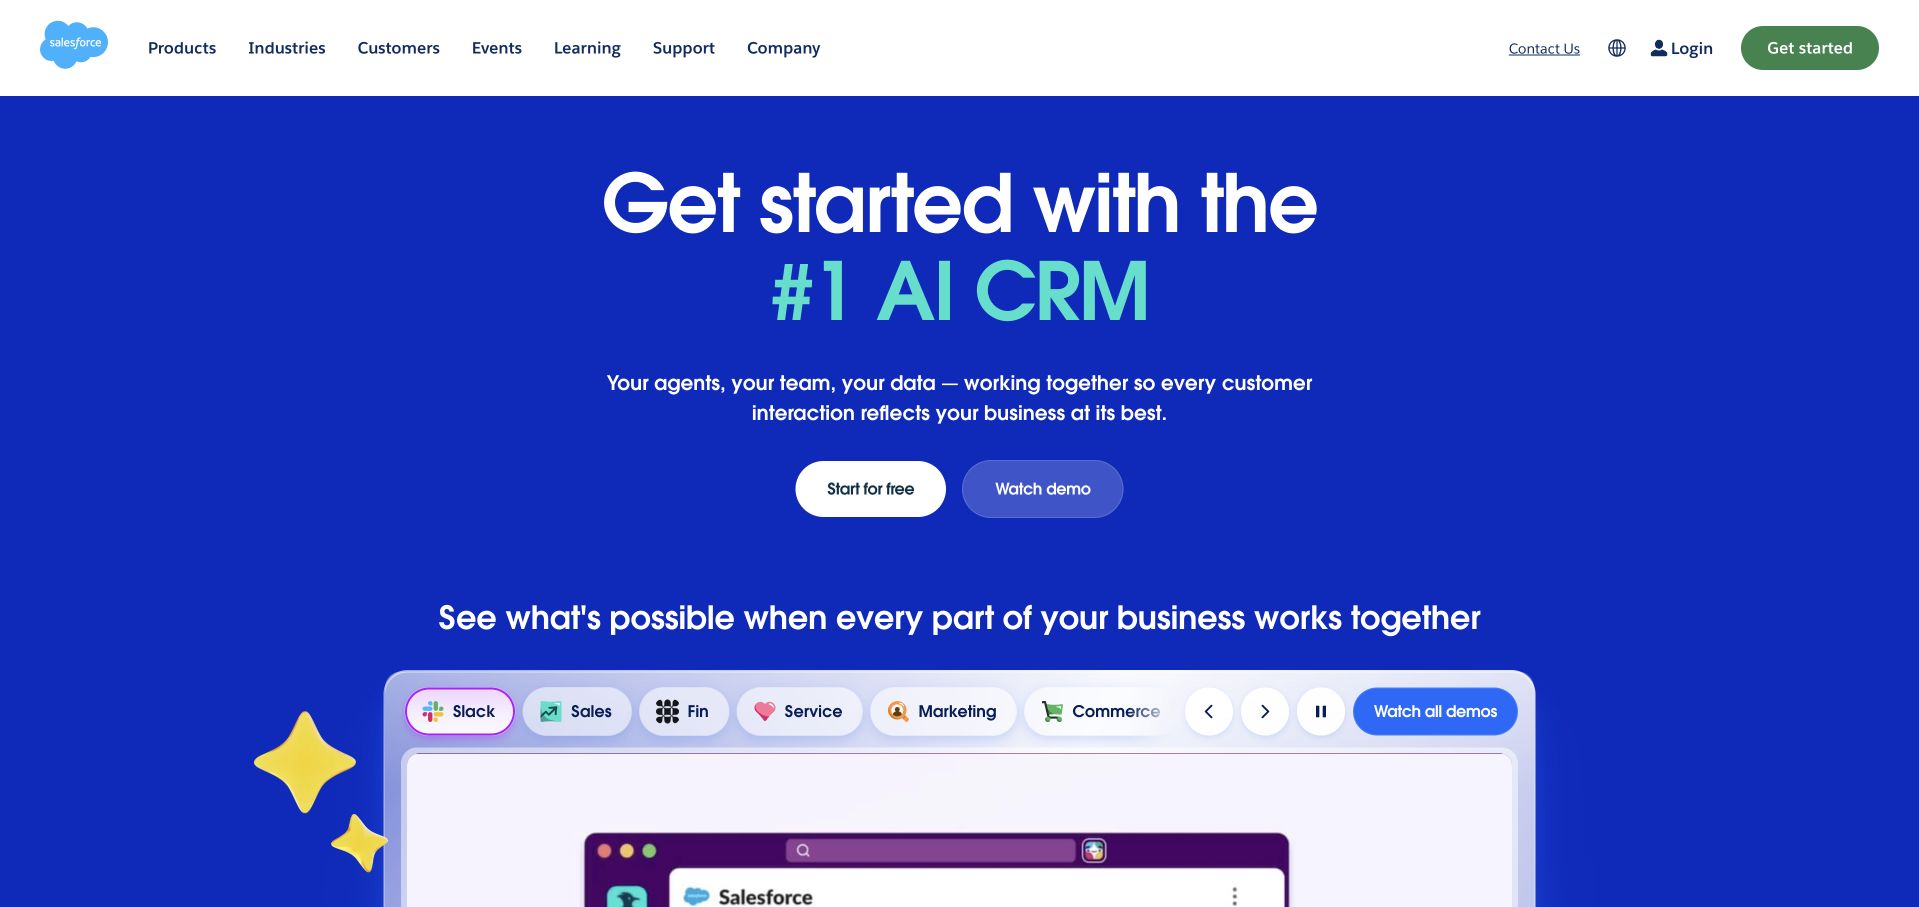
Salesforce uses a vivid blue hero with a centered product proposition and two compact evaluation actions. A large interface preview begins below the text, with product-family labels arranged above it. The white navigation gives products, industries, customers and learning material predictable places outside the campaign. The composition is useful for an extensive platform: the first screen establishes one visual story, while the product labels acknowledge that buyers may be evaluating several different capabilities rather than a single monolithic application.
What you can learn
A visible CRM interface and an internal service-health system are not the same workload. Grafana’s Salesforce article concerns monitoring with Grafana and Prometheus. It does not establish the homepage’s frontend, every customer organization’s setup or the complete infrastructure behind all Salesforce products.
Pros
The interface preview makes a broad platform proposition more tangible than a decorative illustration.
Product-family labels offer an intermediate layer between the headline and detailed evaluation.
Cons & considerations
A large ecosystem message can hide the differences among individual products and buying paths.
Performance and leadership claims need clearly scoped evidence beyond a confident visual presentation.
Platform source: Salesforce — official Grafana association. Salesforce service-health monitoring with Grafana and Prometheus. Official documentary association only. The named workload or listing is not proof that this public page runs on Grafana, nor a complete or independently tested current stack. Platform evidence is separate from the direct website screenshot and is not a complete current infrastructure audit.
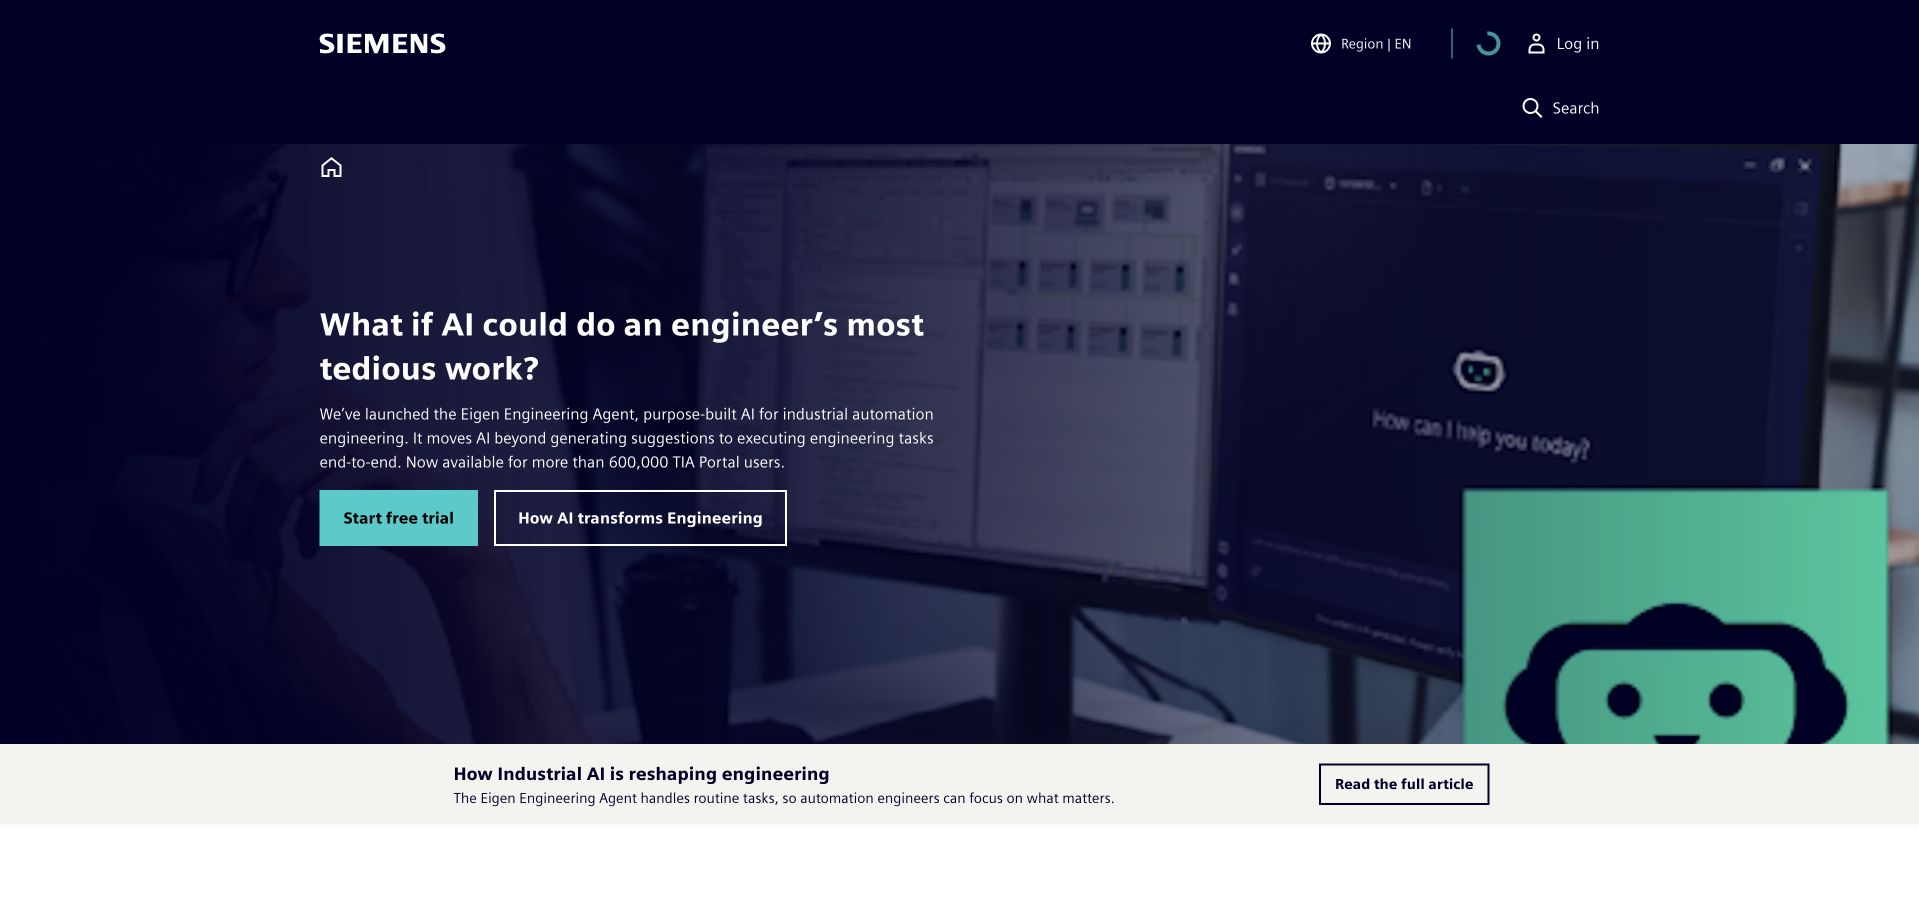
Siemens uses a navy field, turquoise accents and a focused industrial campaign to avoid presenting its entire portfolio at once. The introductory visual supplies a concrete engineering subject, while the compact header preserves a distinct navigation layer above it. The layout is worth studying for its restraint: a company with many services can still make one first impression understandable. The tradeoff is that the next step must quickly help people find the specific service, audience or region that matters to them.
What you can learn
That public simplicity should not be mistaken for a simple technical estate. Grafana’s Siemens success story documents an engineering observability association. It does not identify the complete stack of the marketing page, every Siemens division or each customer-facing application linked from the broader corporate navigation.
Pros
A limited accent palette provides strong hierarchy within a complex industrial brand.
The focused campaign avoids overwhelming the visitor with every available service at once.
Cons & considerations
Broad corporate language needs clear specialist routes immediately beyond the introduction.
Shared visual identity can conceal important boundaries among applications and organizational units.
Platform source: Siemens — official Grafana association. Siemens engineering observability as described in its Grafana success story. Official documentary association only. The named workload or listing is not proof that this public page runs on Grafana, nor a complete or independently tested current stack. Platform evidence is separate from the direct website screenshot and is not a complete current infrastructure audit.
Uber’s public About page opens with a wide family photograph, a small section label and a short organizational statement below. The bright image and black header create an uncomplicated visual frame rather than a transactional dashboard. The composition is a useful reminder that a platform’s public identity does not need to reproduce its operating interface. Corporate storytelling can have its own page and purpose, leaving service-specific journeys to explain booking, communication, payments and account tasks in their proper context.
What you can learn
Grafana’s 2025 Uber session concerns Cloud Profiles, latency and incident-response work. That is a specific engineering workload, not a conclusion about the pictured About page or every Uber service. The screenshot establishes appearance; the official session establishes only the separately described profiling association.
Pros
The photograph makes an organizational story approachable without a dense feature list.
A simple image-to-text transition gives the corporate page a clear reading order.
Cons & considerations
A large introductory image delays detailed information for a task-focused corporate visitor.
A public brand page cannot communicate the operational differences among all downstream services.
Platform source: Uber — official Grafana association. Uber profiling and incident-response use of Grafana Cloud Profiles. Official documentary association only. The named workload or listing is not proof that this public page runs on Grafana, nor a complete or independently tested current stack. Platform evidence is separate from the direct website screenshot and is not a complete current infrastructure audit.
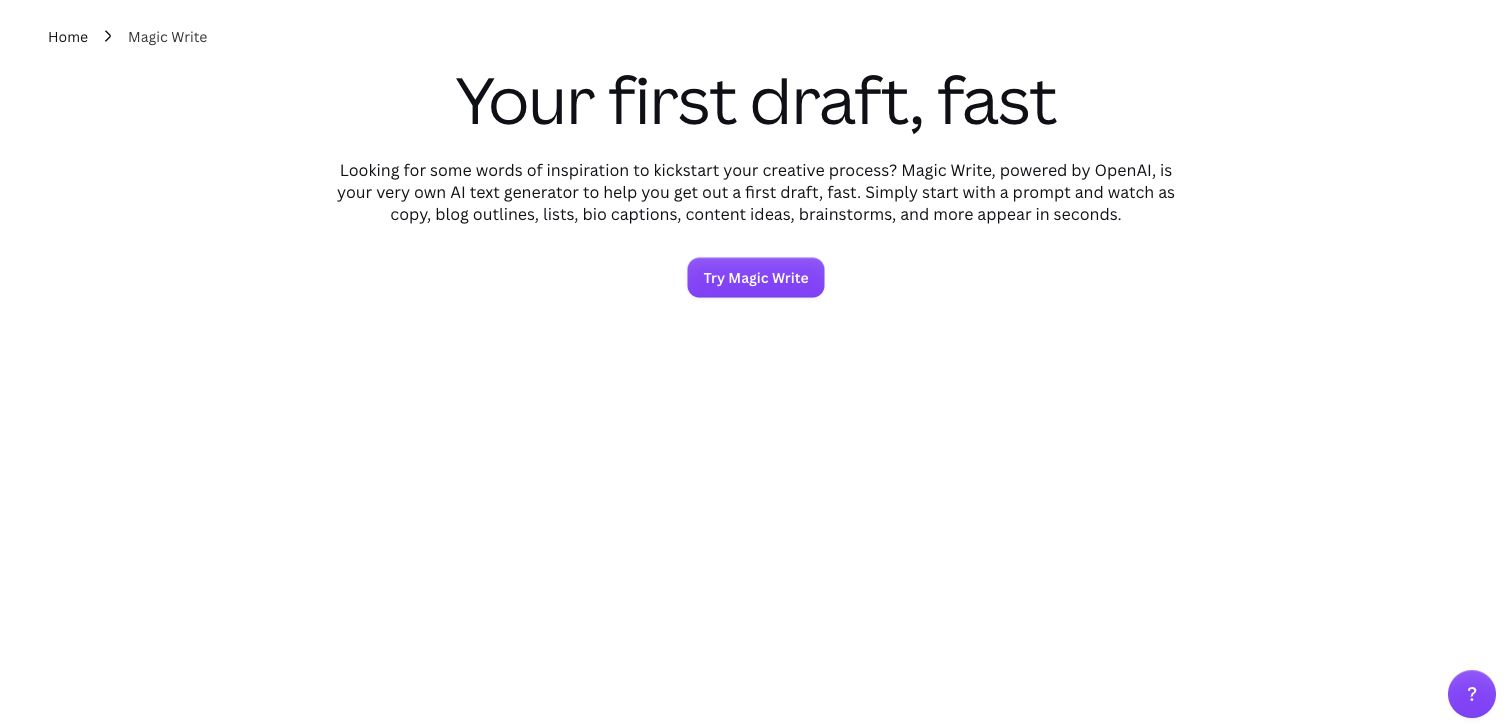
Canva’s Magic Write page uses a large plain headline, a short explanatory paragraph and a single purple action on a white background. A small breadcrumb identifies the product context, while the restrained composition leaves the text as the main explanation. This is a useful feature-page pattern when a product already has a broad ecosystem: the visitor is not asked to evaluate every capability at once. The screenshot is a public marketing surface, deliberately separate from any personalized Canva workspace or private document.
What you can learn
A feature description and a company’s engineering practice provide different evidence. Grafana’s 2024 Canva event material concerns scaling observability. It does not prove that the pictured writing feature, every generated output or this public page uses a particular Grafana component or frontend stack.
Pros
One feature, one short explanation and one action make the page easy to interpret.
The breadcrumb supplies context without requiring a large secondary navigation.
Cons & considerations
A very sparse feature page needs concrete examples and limitations further into the content.
A broad productivity promise should not substitute for clear expectations about generated output.
Platform source: Canva Magic Write — official Grafana association. Canva observability scaling discussed in an official Grafana event session; the public Magic Write page is the visual reference, not a verified instance of that internal system. Official documentary association only. The named workload or listing is not proof that this public page runs on Grafana, nor a complete or independently tested current stack. Platform evidence is separate from the direct website screenshot and is not a complete current infrastructure audit.
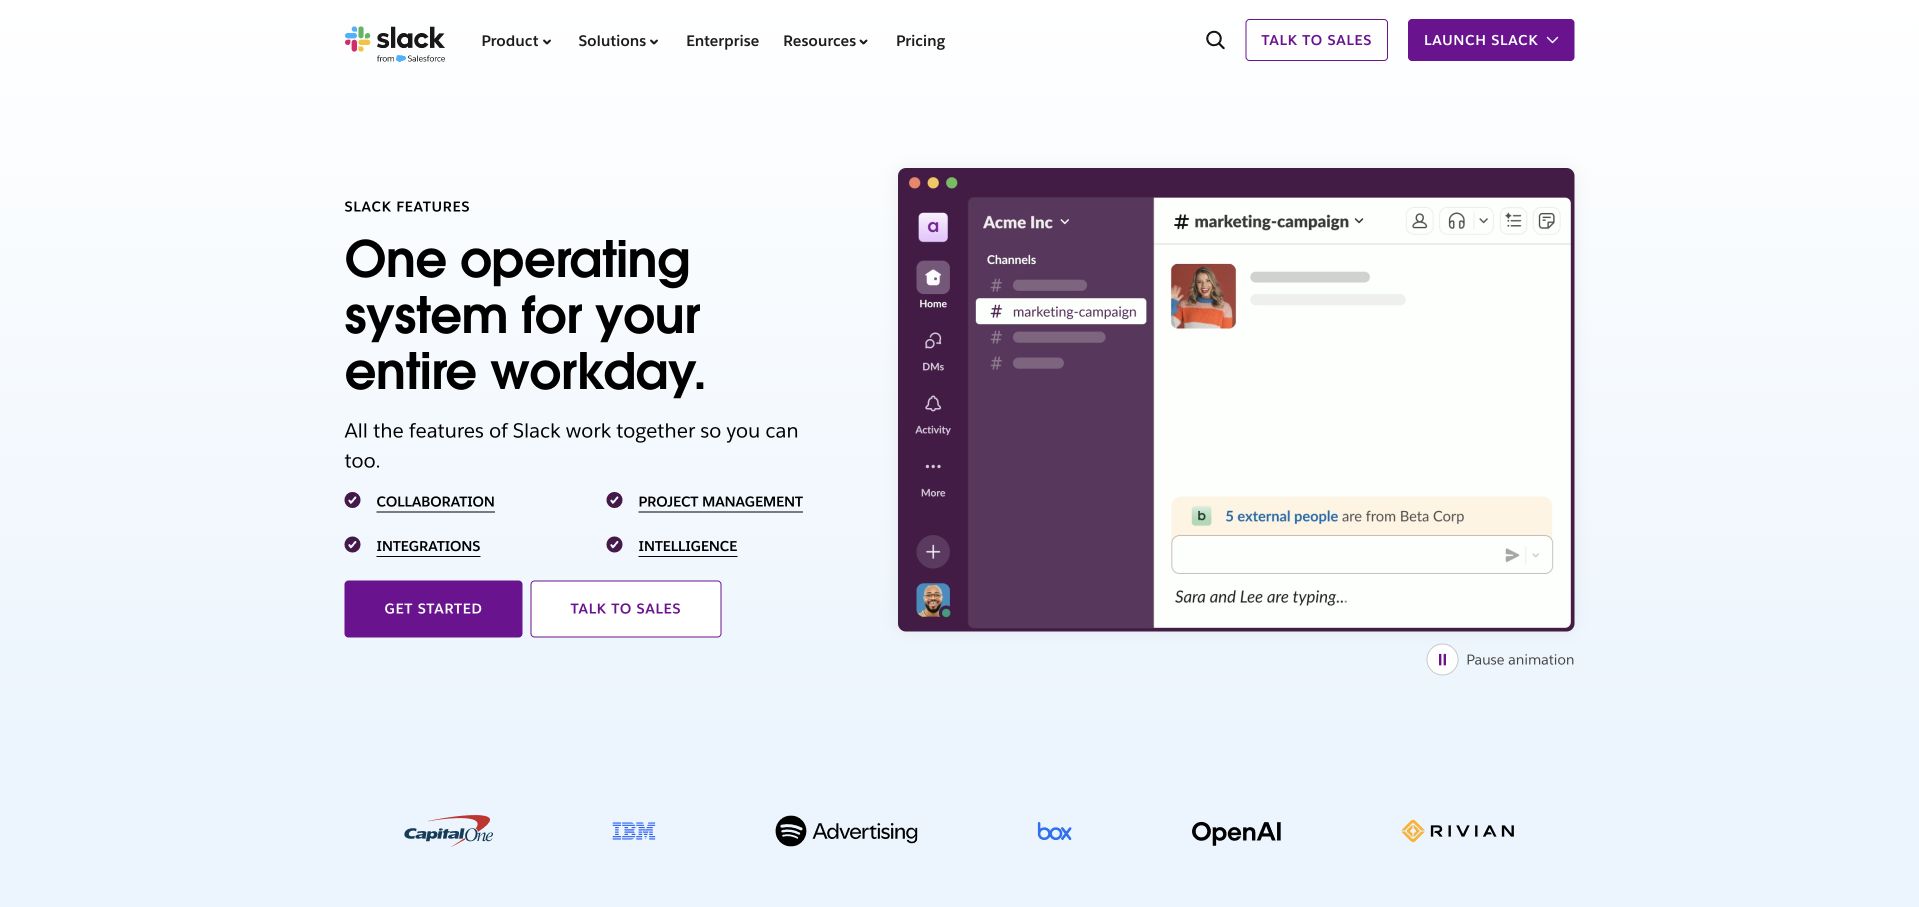
Slack’s public Features page combines a large product statement with an illustrated workspace, then names several capabilities below the introduction. A pale blue ground and customer-logo row add structure without overwhelming the main composition. The product image explains the category, while the labels let a visitor move from a general understanding toward a more specific question. This is a useful pattern for a familiar application that still needs to explain new capabilities without turning its homepage into a dense release-note list.
What you can learn
Historical monitoring practice should remain attached to its source. Grafana’s 2023 Slack session describes the evolution of monitoring from earlier Grafana versions. It does not establish the current configuration behind this public features page, every Slack workspace or the complete Salesforce-owned platform estate.
Pros
Capability labels provide a readable middle layer between the headline and detailed feature pages.
The workspace illustration makes the product recognizable without exposing a real private conversation.
Cons & considerations
Animated product illustrations need motion controls and readable descriptions outside the image.
A familiar brand can still leave first-time visitors uncertain about specific plan or feature boundaries.
Platform source: Slack Features — official Grafana association. Slack monitoring evolution presented at an official Grafana event; public product page is the design reference. Official documentary association only. The named workload or listing is not proof that this public page runs on Grafana, nor a complete or independently tested current stack. Platform evidence is separate from the direct website screenshot and is not a complete current infrastructure audit.
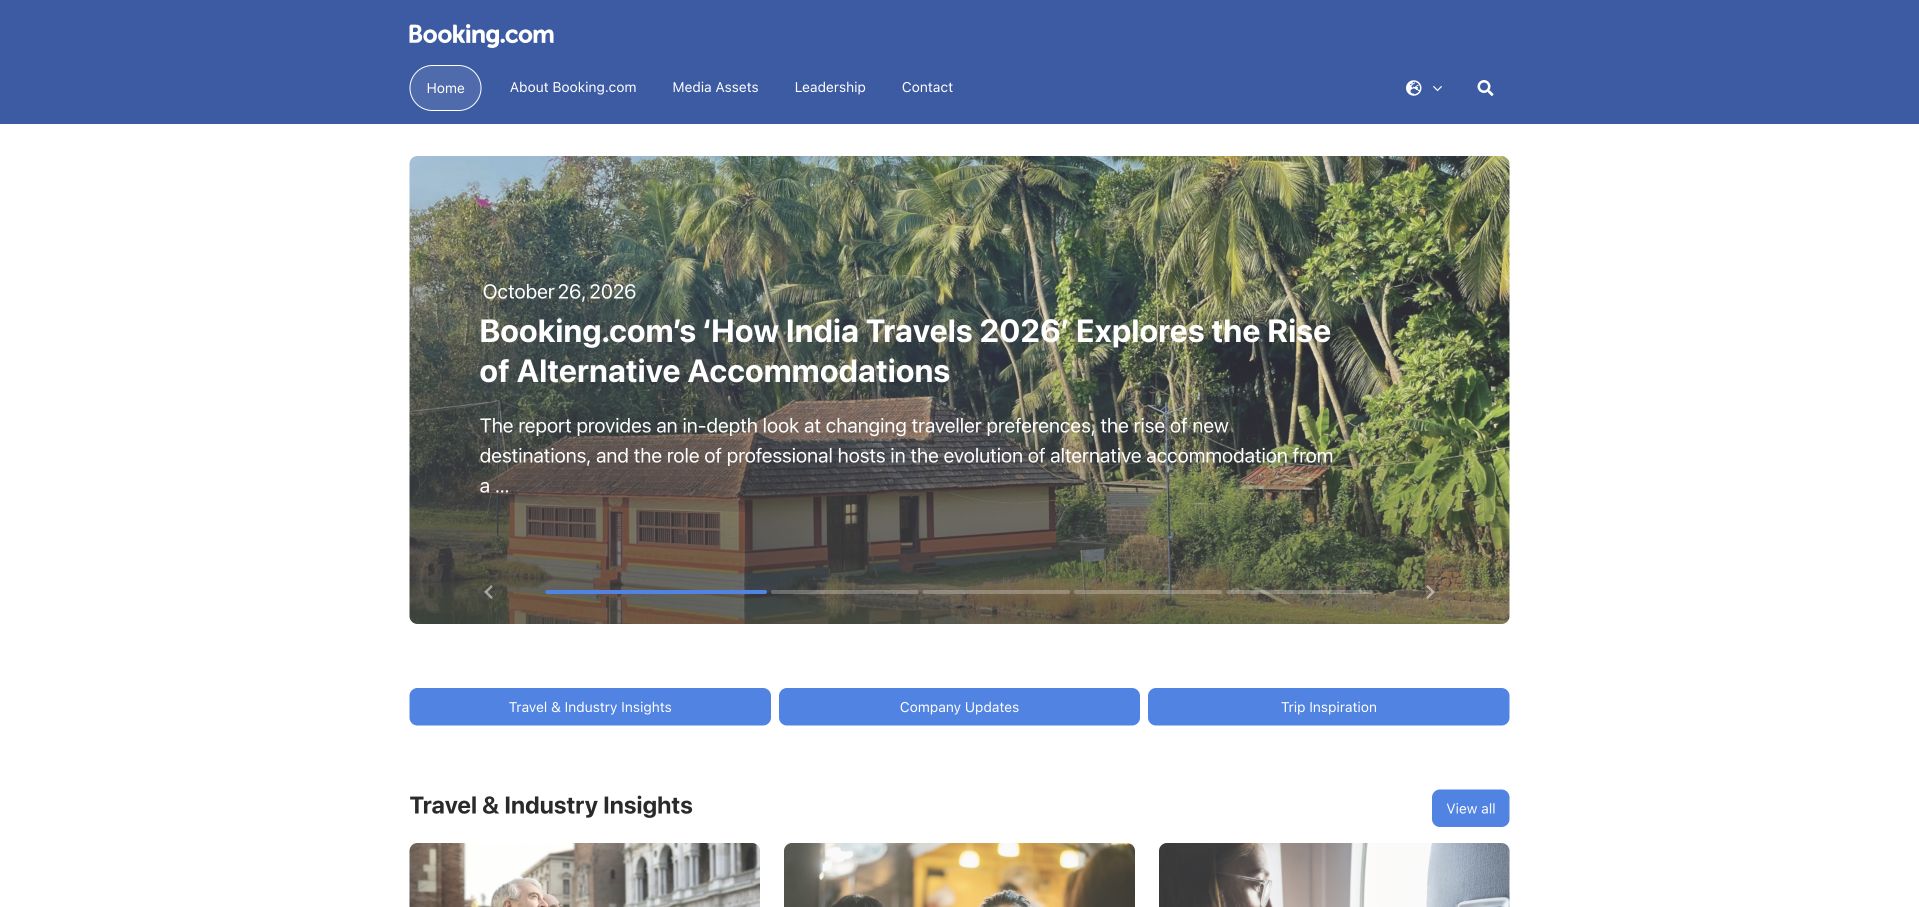
Booking.com’s public newsroom uses a restrained blue header and a large editorial feature with text placed over a destination photograph. Three category controls below the main feature introduce the rest of the newsroom without recreating the consumer booking interface. The design is useful because it respects a different audience: journalists and researchers need stories, media resources and company context, not a hotel search as the dominant first task. The consistent brand color supplies continuity across that change in purpose.
What you can learn
Grafana’s 2024 Booking.com event session concerns an observability practice described as agnostic. The newsroom screenshot is only a public design reference. The session does not establish every booking application, the newsroom’s publishing technology or a complete current inventory of the company’s monitoring and data systems.
Pros
The newsroom has a clear editorial purpose rather than duplicating the consumer booking journey.
Category controls provide a compact structure beneath the main feature.
Cons & considerations
Text over destination photography needs dependable contrast as stories and images change.
A corporate newsroom should make dates and media-resource access easy to locate beyond the feature.
Platform source: Booking.com — official Grafana association. Booking.com observability practice; newsroom is the public design reference. Official documentary association only. The named workload or listing is not proof that this public page runs on Grafana, nor a complete or independently tested current stack. Platform evidence is separate from the direct website screenshot and is not a complete current infrastructure audit.
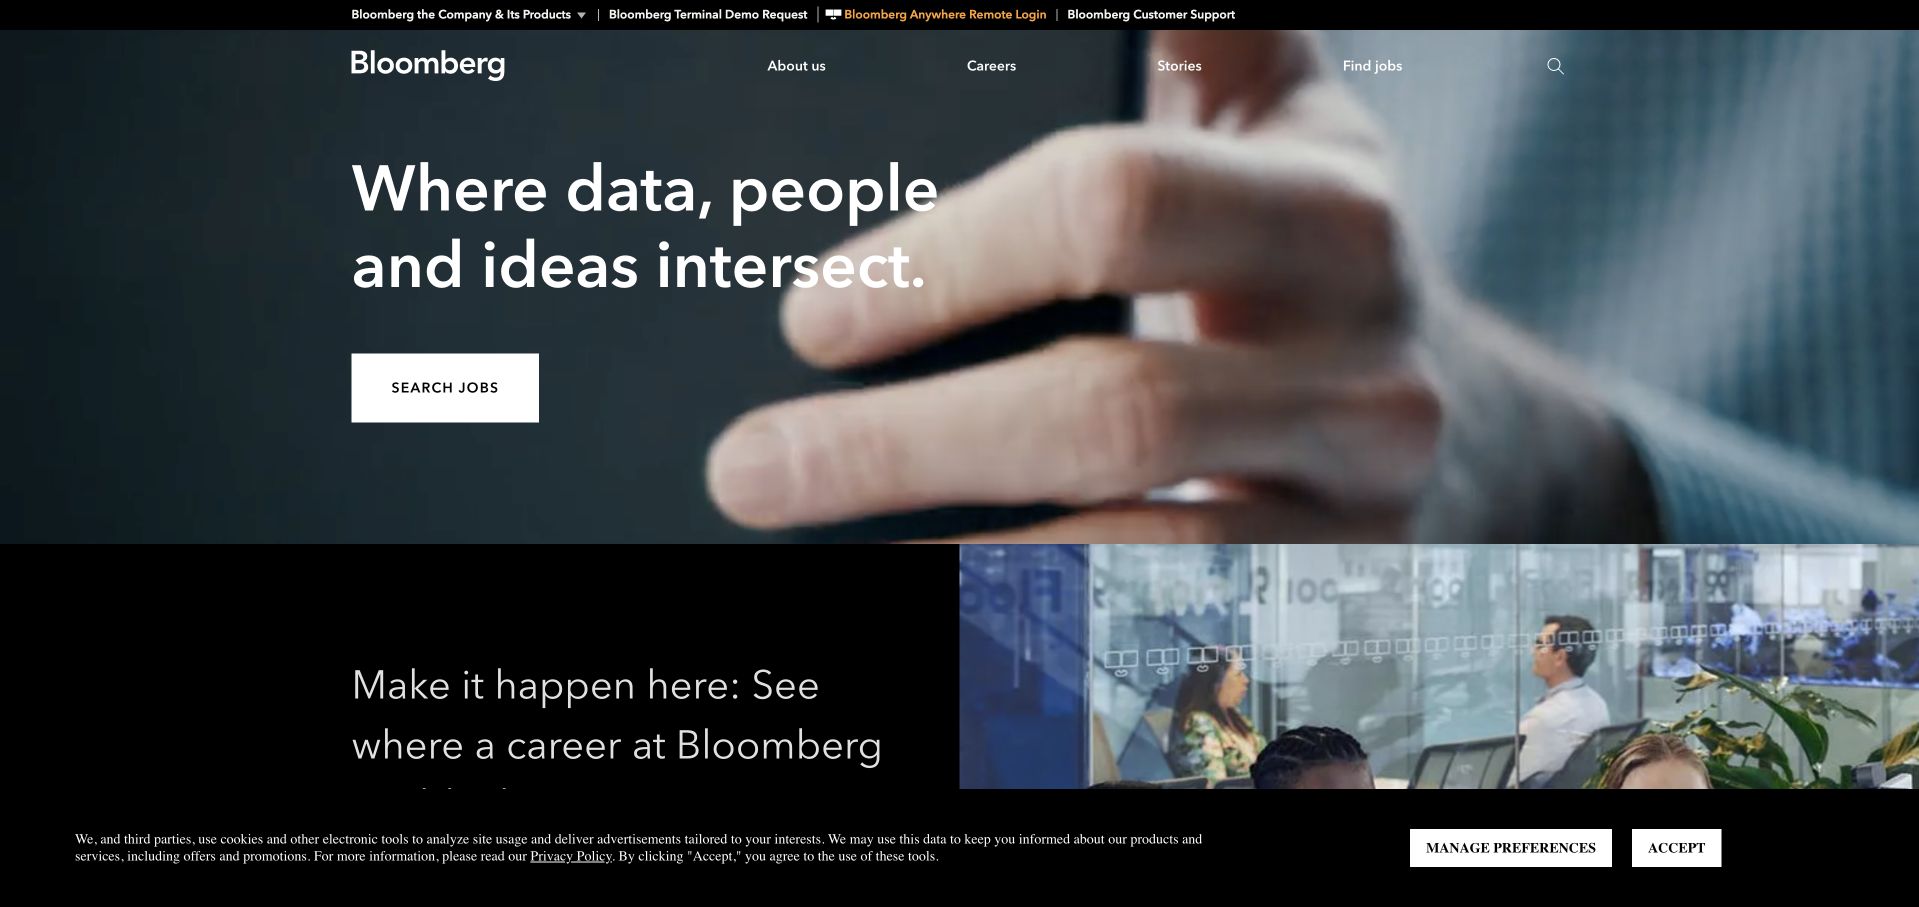
Bloomberg’s corporate page uses a dark photographic hero and a short statement about people, data and ideas. A job-search action makes one intended audience explicit, while a second section begins a careers-oriented continuation. The slim navigation keeps company information, careers and stories separate from the specialized product links in the utility area. The page is useful for studying how a well-known professional product brand can maintain a different corporate and recruiting experience without trying to imitate the product’s dense working interface.
What you can learn
Telemetry architecture is another distinct layer. Grafana’s Bloomberg article discusses the evolution of that engineering practice. It does not establish the complete frontend of the corporate page, access to professional terminal products or the suitability and accuracy of information delivered by any Bloomberg service.
Pros
The corporate page does not force a specialist product interface onto a broader organizational audience.
A prominent careers action makes the page’s recruitment purpose immediately recognizable.
Cons & considerations
An atmospheric corporate statement needs specific organizational detail to become more than a slogan.
Cookie controls and utility links can compress the useful introductory area on smaller screens.
Platform source: Bloomberg — official Grafana association. Bloomberg telemetry architecture and observability evolution. Official documentary association only. The named workload or listing is not proof that this public page runs on Grafana, nor a complete or independently tested current stack. Platform evidence is separate from the direct website screenshot and is not a complete current infrastructure audit.
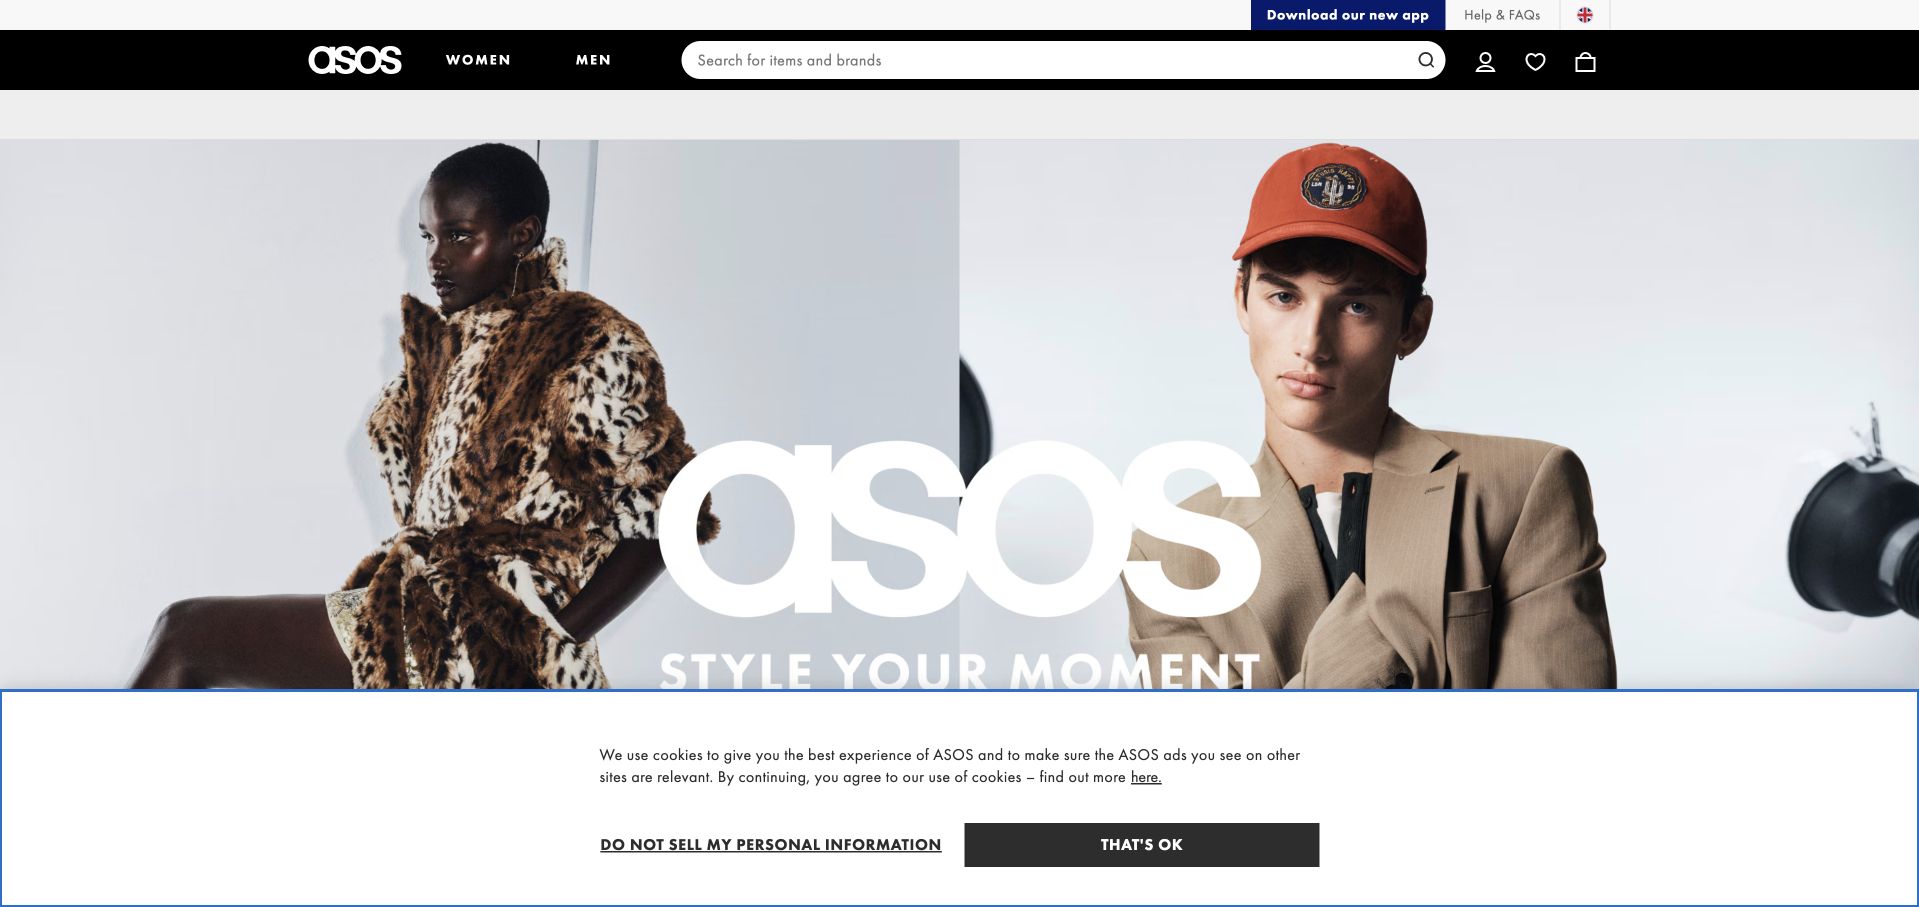
ASOS uses a simple black-and-white header above large fashion photography and a bold central wordmark. Search is prominent, and the main audience choices sit beside it rather than being hidden behind the campaign. The visual presentation is intentionally confident, but the practical catalog entrance remains easy to find. This is useful for a retailer whose current creative direction changes frequently: the campaign can evolve while search, account access and shopping controls retain familiar positions and recognizable styling.
What you can learn
A retail page and an engineering observability case are not interchangeable evidence. Grafana’s ASOS success story concerns Grafana Cloud and incident-response operations. It does not establish every commerce component, shopper account boundary or the precise telemetry collected from the photographed public page.
Pros
Prominent search protects a practical shopping route beneath a strong fashion campaign.
A minimal monochrome header gives changing photography a consistent brand frame.
Cons & considerations
Large campaign lettering can compete with the image and reveal little about available products.
Consent banners should not cover the primary catalog entrance or product-selection context.
Platform source: ASOS — official Grafana association. ASOS engineering observability as documented by Grafana. Official documentary association only. The named workload or listing is not proof that this public page runs on Grafana, nor a complete or independently tested current stack. Platform evidence is separate from the direct website screenshot and is not a complete current infrastructure audit.
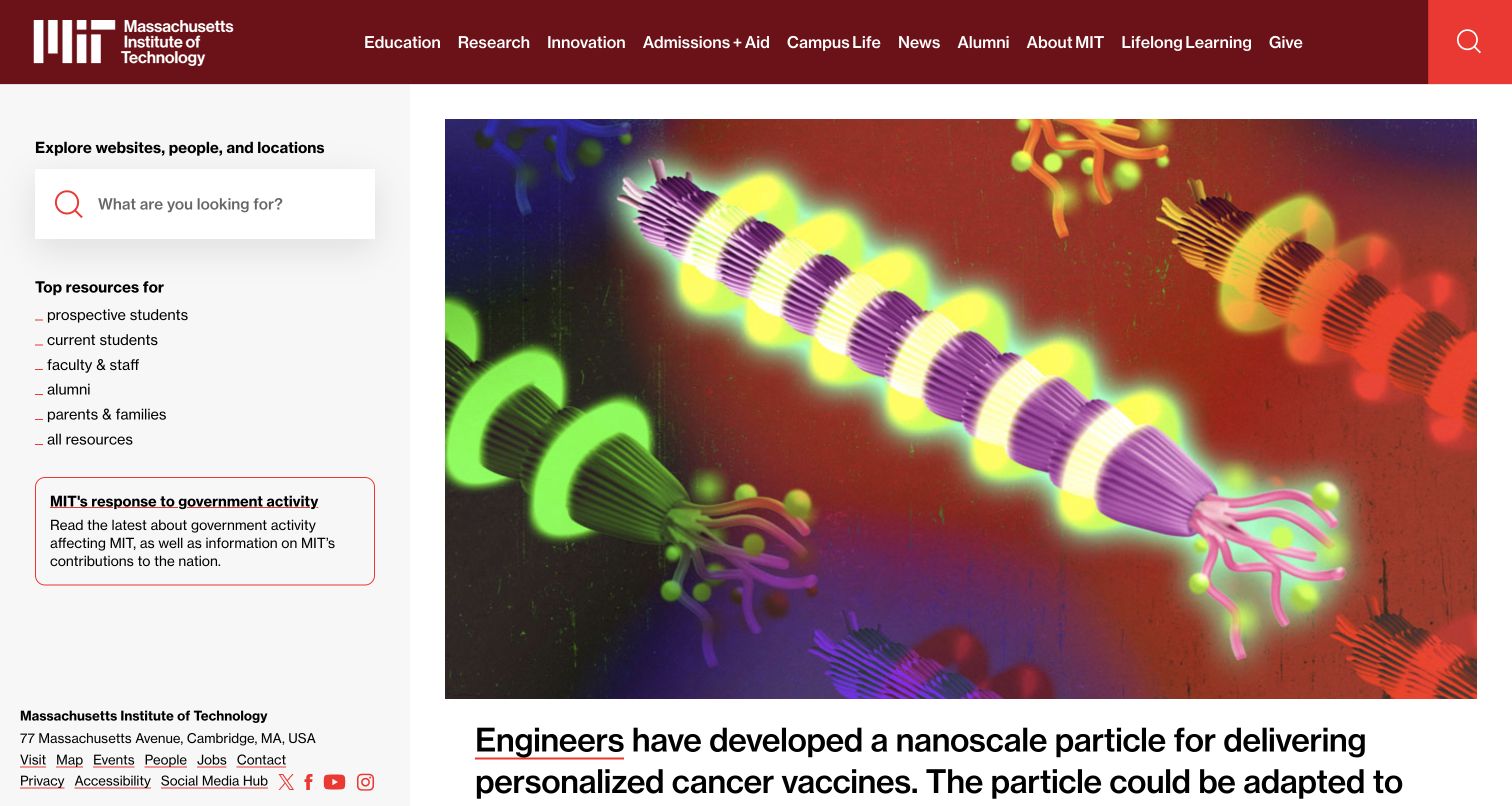
MIT uses a distinctive side column for search, audience resources and institutional information, leaving the largest space for a research image and headline. A red top bar supplies the major institutional routes. The layout is unusual in a useful way: search and practical links remain visible without consuming the main editorial story. It suits an institution with many reasons to visit, from learning about current work to finding a department or a resource for an existing community member.
What you can learn
Keep the institutional boundary precise. Grafana’s case concerns MIT Open Learning, not every MIT department or the technology behind the public homepage. A recognizable university name should not turn one unit’s observability project into an invented campus-wide monitoring or publishing architecture.
Pros
The side column keeps search and audience resources visible beside the lead research story.
A strong red navigation bar gives a complex institution a stable visual boundary.
Cons & considerations
A distinctive multi-column layout needs careful reordering and labeling on mobile devices.
Large research imagery still needs plain explanations and accessible alternatives for its subject.
Platform source: Massachusetts Institute of Technology — official Grafana association. MIT Open Learning unified observability with Grafana Cloud; not all MIT systems. Official documentary association only. The named workload or listing is not proof that this public page runs on Grafana, nor a complete or independently tested current stack. Platform evidence is separate from the direct website screenshot and is not a complete current infrastructure audit.
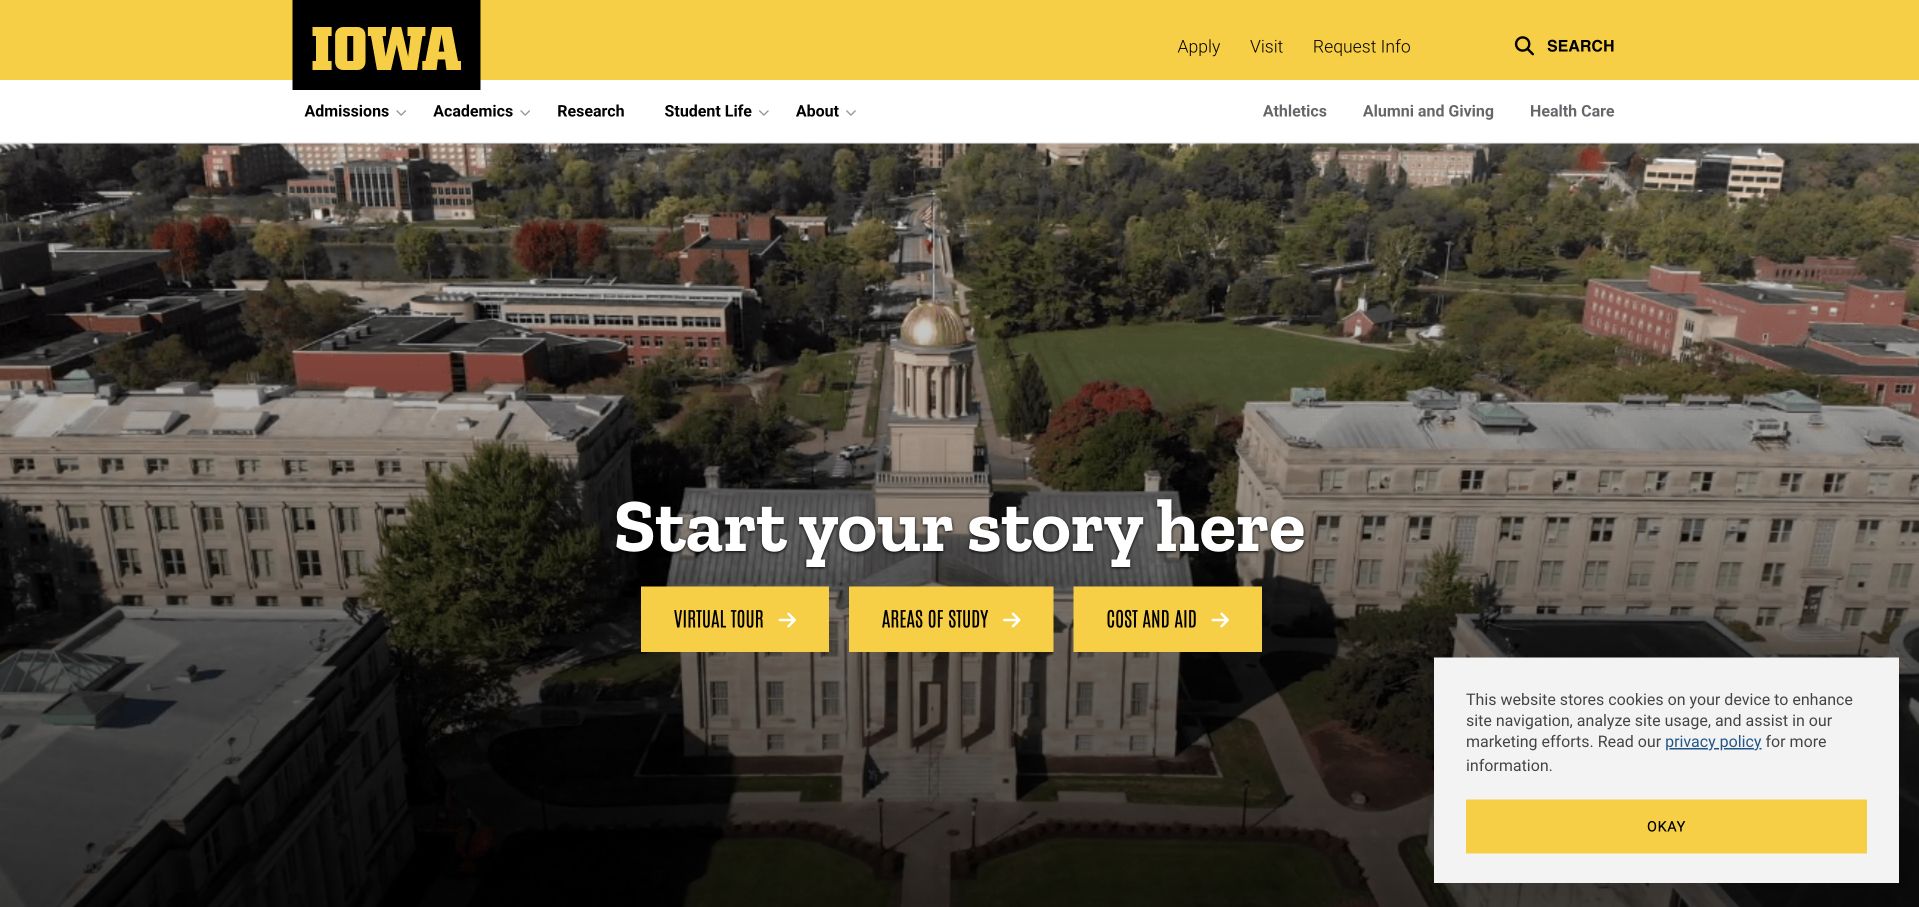
The University of Iowa uses a yellow institutional header over a wide campus photograph. A short centered introduction is followed by three clear actions for a virtual tour, areas of study and cost or aid information. The permanent navigation names admissions, academics, research and student life, with additional community routes in a lighter secondary row. The useful detail is the practical trio: the page does not rely on an aspirational campus image alone to help a prospective student decide what to investigate next.
What you can learn
The documented technical scope is narrower than the university brand. Grafana’s Iowa story concerns the College of Public Health’s observability work. It does not establish all campus systems, the public admissions page or every department’s monitoring and access model.
Pros
Three concrete actions connect the campus image to common prospective-student questions.
The yellow institutional frame remains recognizable above different content and audience routes.
Cons & considerations
Several navigation levels can become crowded before the first useful action on small screens.
A large campus image should not delay practical costs, program and accessibility information.
Platform source: University of Iowa — official Grafana association. University of Iowa College of Public Health unified observability with Grafana Cloud; not the entire university. Official documentary association only. The named workload or listing is not proof that this public page runs on Grafana, nor a complete or independently tested current stack. Platform evidence is separate from the direct website screenshot and is not a complete current infrastructure audit.
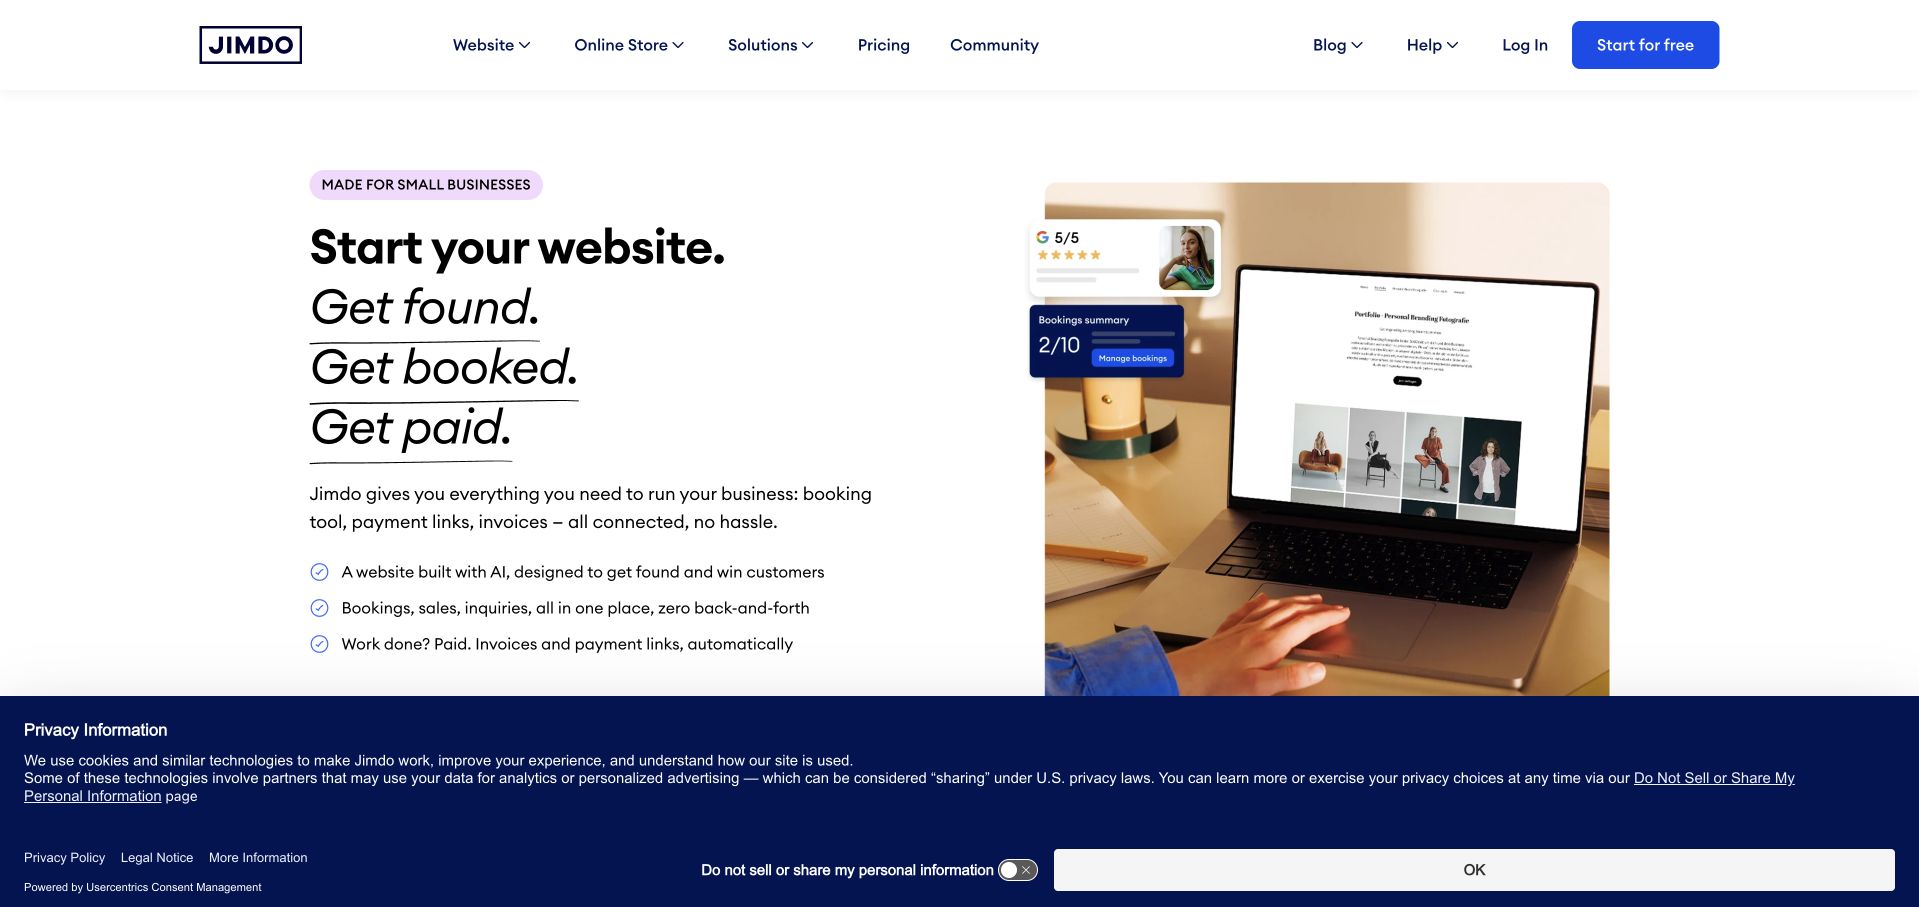
Jimdo pairs a short stacked statement with a large laptop mockup and a compact list of business tasks. Blue actions stand out on a largely white canvas, while the header gives websites, online stores, solutions, pricing and help their own routes. The product image connects the proposition to an actual publishing environment rather than a generic creative illustration. It is useful for a platform that wants to explain more than page creation without overwhelming the visitor with an entire back-office feature inventory immediately.
What you can learn
The platform’s own observability is separate from sites created by its users. Grafana’s Jimdo story concerns consolidated monitoring with Grafana Cloud. It does not mean that every Jimdo-built website runs Grafana, shares the same monitoring configuration or uses the same frontend technologies as this marketing page.
Pros
The laptop mockup gives a broad small-business proposition a recognizable product context.
A short task list adds useful specificity without turning the hero into a comparison table.
Cons & considerations
A broad all-in-one message needs clear feature boundaries before a business commits.
Large privacy controls can occupy substantial space around an otherwise concise opening composition.
Platform source: Jimdo — official Grafana association. Jimdo engineering monitoring and observability. Official documentary association only. The named workload or listing is not proof that this public page runs on Grafana, nor a complete or independently tested current stack. Platform evidence is separate from the direct website screenshot and is not a complete current infrastructure audit.
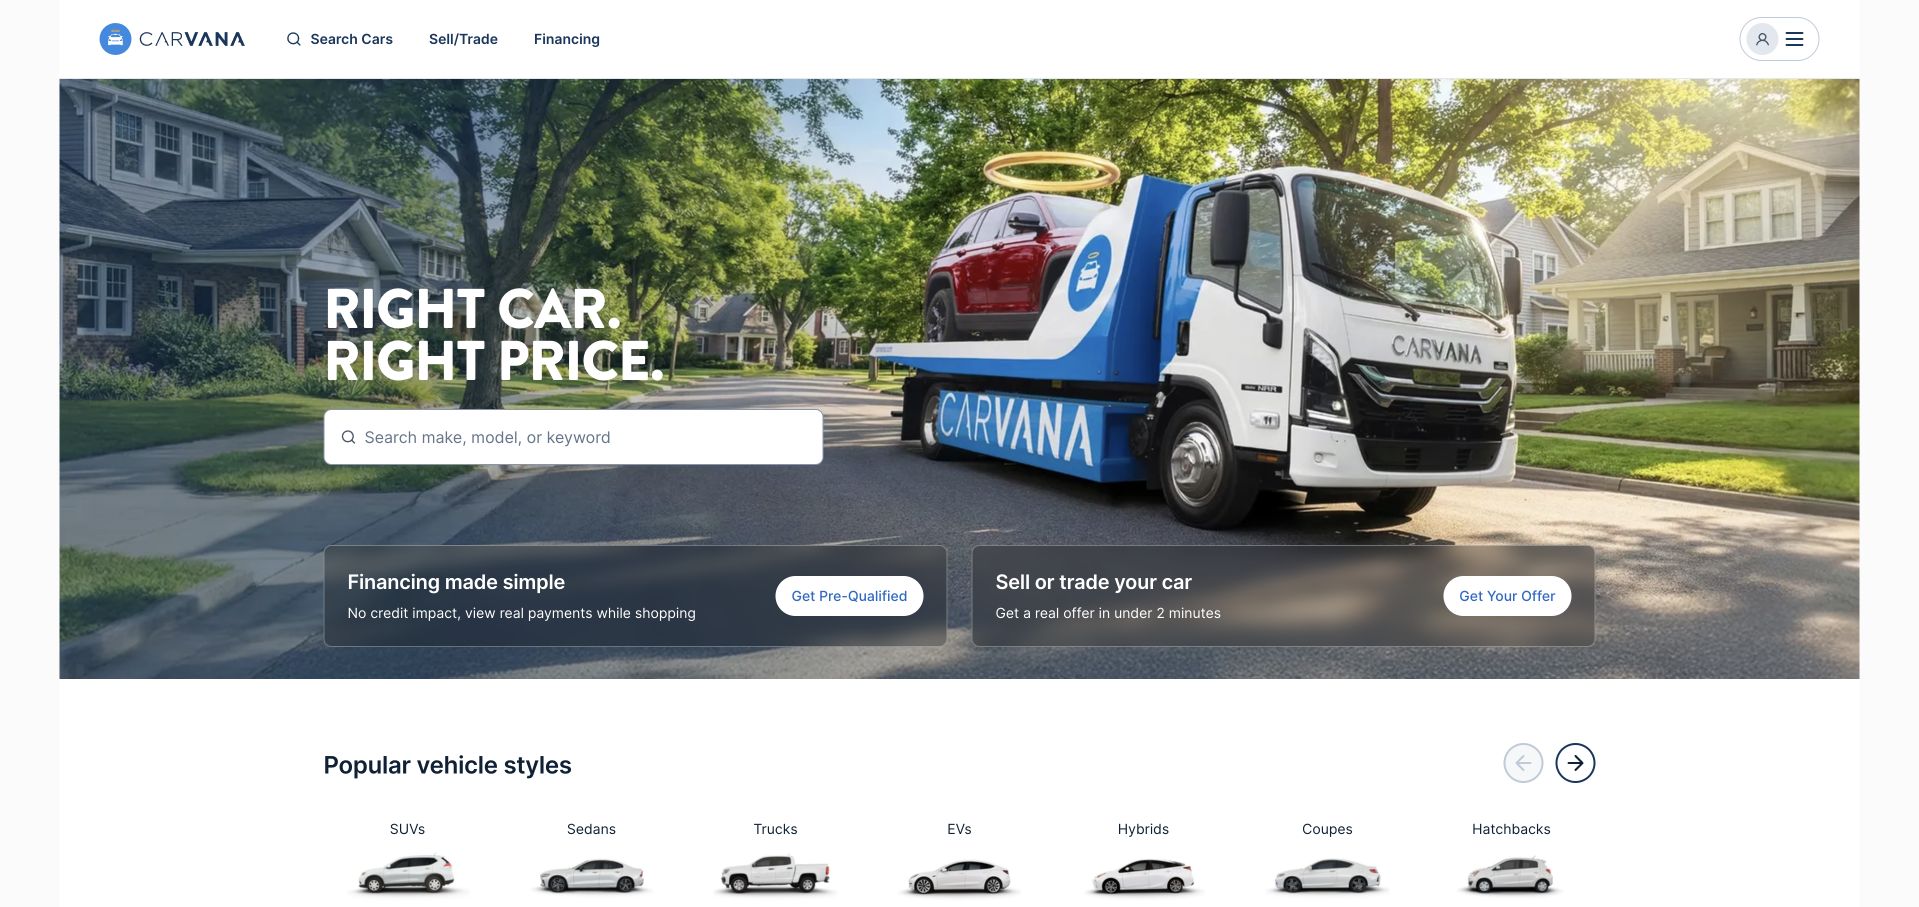
Carvana combines a neighborhood photograph and branded delivery truck with a prominent vehicle-search field. Financing and selling controls sit in two distinct panels beneath the main search, while category shortcuts begin below the hero. The layout recognizes several intentions without giving them equal weight: browsing inventory is primary, but returning visitors can quickly find related tasks. The scene connects the digital service to a physical delivery outcome, making the offer more concrete than a generic grid of vehicles alone.
What you can learn
Performance testing is a specific engineering responsibility. Grafana’s Carvana case concerns k6 test creation and usage, not necessarily every Grafana observability product. It does not independently establish the current performance, financing suitability or full frontend and backend architecture of the photographed retail page.
Pros
Search receives the highest visual priority while selling and financing remain recognizable alternatives.
The branded delivery scene explains the physical outcome of an online retail process.
Cons & considerations
Prominent financing routes need clear conditions and should not be read as universal eligibility.
A large search field requires useful empty, unavailable and error states beyond its initial presentation.
Platform source: Carvana — official Grafana association. Carvana performance testing with Grafana k6, not all Grafana products. Official documentary association only. The named workload or listing is not proof that this public page runs on Grafana, nor a complete or independently tested current stack. Platform evidence is separate from the direct website screenshot and is not a complete current infrastructure audit.
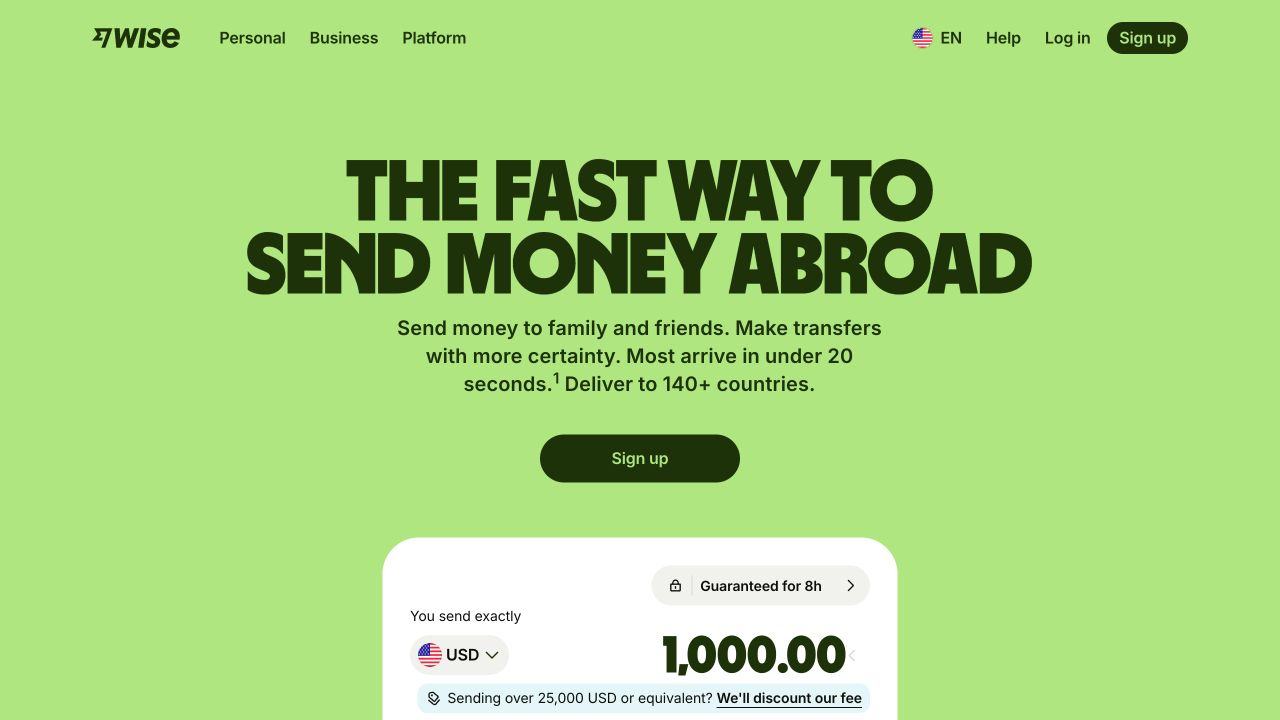
Wise uses a bright green field, oversized dark typography and a compact signup action to make its introductory proposition immediate. A transfer-calculation surface begins below the headline, connecting the broad claim to a specific financial task. Personal, business and platform audiences are named in the header rather than blended into the same message. The composition is worth studying because it gives the page personality without relying on a large photograph, while the practical calculation provides more substance than the slogan alone.
What you can learn
Keep the technical and financial claims separate. Grafana’s 2023 Wise session concerns its observability team and the LGTM stack. It does not establish current transfer conditions, financial suitability or the exact telemetry and architecture behind this captured public page.
Pros
The green-and-dark palette makes the brand recognizable without complex illustration.
A calculation surface connects the introductory proposition to a concrete user task.
Cons & considerations
Large speed-related language needs explicit scope and current product conditions.
A compact calculator cannot replace clear explanations of fees, rates and service availability.
Platform source: Wise — official Grafana association. Wise observability team’s 2023 LGTM stack account; not a whole-stack audit. Official documentary association only. The named workload or listing is not proof that this public page runs on Grafana, nor a complete or independently tested current stack. Platform evidence is separate from the direct website screenshot and is not a complete current infrastructure audit.
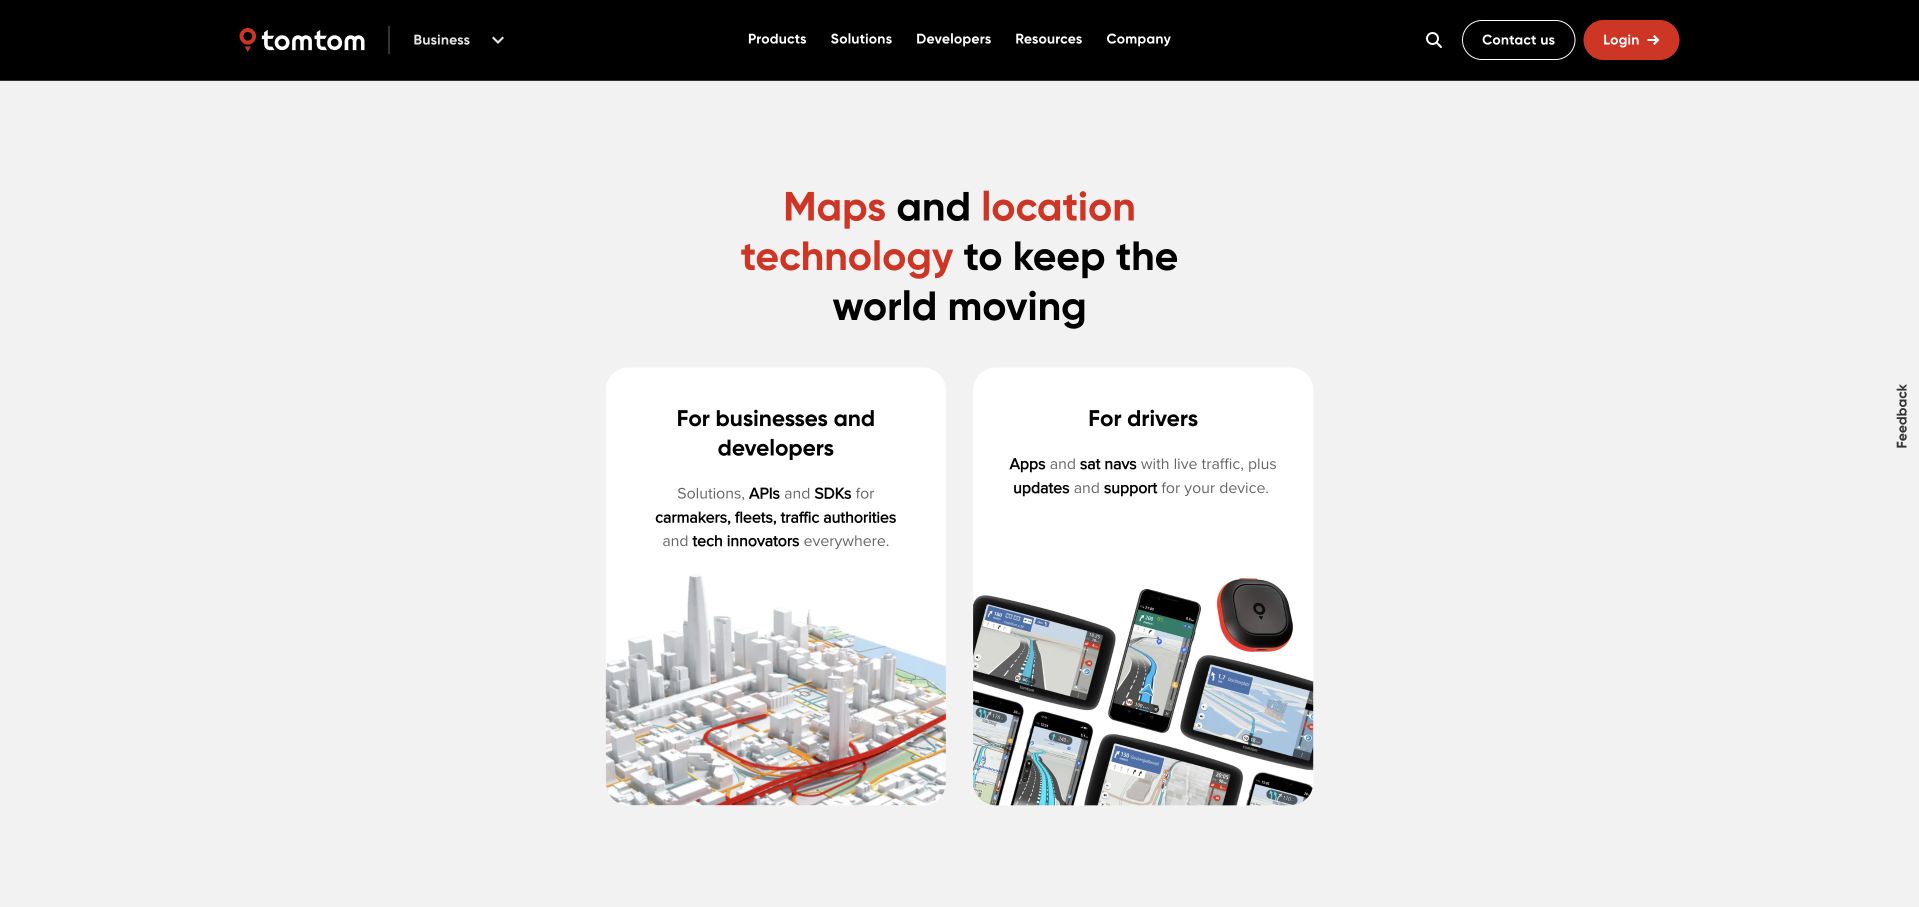
TomTom centers a concise mapping proposition above two large white cards: one for businesses and developers, another for drivers. Product imagery within each card explains the difference without a lengthy paragraph, while a black header retains corporate and resource routes. The page’s strongest choice is the audience split. A developer evaluating map APIs and a driver seeking an app or device update should not have to decode the same catalog before finding a useful next step.
What you can learn
Audience clarity also matters in the operational story. Grafana’s 2025 TomTom session describes an observability framework using Grafana Cloud across telemetry and on-call work. That does not establish every mapping service, consumer device or frontend component delivering the public page in this screenshot.
Pros
Two audience cards turn a broad mapping portfolio into an understandable first decision.
Product images reinforce the distinction between developer services and consumer navigation tools.
Cons & considerations
Short audience summaries still need clear routes for existing-device support and account recovery.
A simple split may need additional guidance for visitors whose use spans both categories.
Platform source: TomTom — official Grafana association. TomTom’s 2025 Grafana Cloud framework for logs, metrics, traces and on-call. Official documentary association only. The named workload or listing is not proof that this public page runs on Grafana, nor a complete or independently tested current stack. Platform evidence is separate from the direct website screenshot and is not a complete current infrastructure audit.
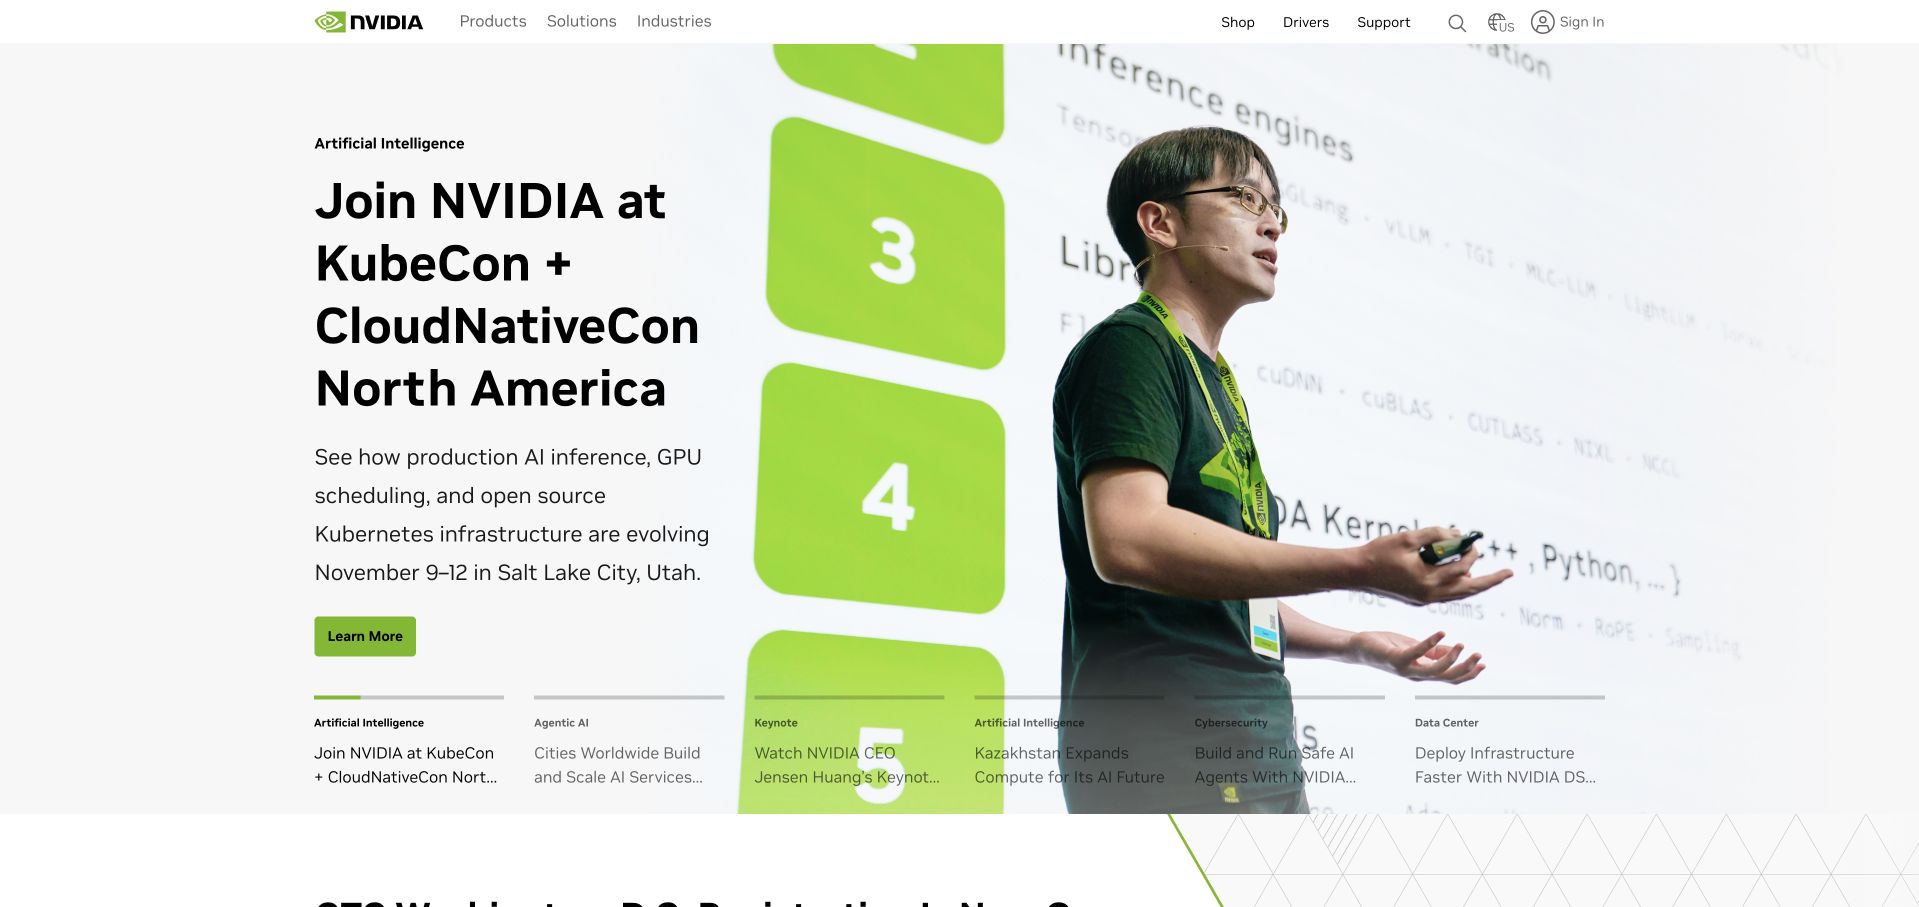
NVIDIA’s captured page places a large event photograph beside a clear conference-oriented message and green action. A row of smaller campaign summaries begins beneath the main statement, giving the wider portfolio a visible presence without replacing the focal story. The white navigation keeps the introductory composition restrained despite the breadth of the business. The design is useful for a brand with many simultaneous technical announcements: one can lead, but the surrounding structure still needs to reveal the other relevant directions.
What you can learn
The documentary scope here is a specific engineering system. Grafana’s 2023 NVIDIA session concerns threat detection and log analysis using Loki and Grafana. It is not a claim about every NVIDIA product, the public campaign page’s runtime or the security effectiveness of all related systems.
Pros
A current event gives a broad technical brand one concrete introductory subject.
Smaller campaign summaries reveal other directions without competing equally with the lead item.
Cons & considerations
A conference-led opening can delay the product or support task of a returning visitor.
Technical event claims need detailed material beyond a visually confident campaign headline.
Platform source: NVIDIA — official Grafana association. NVIDIA threat-detection-system use of the Loki stack. Official documentary association only. The named workload or listing is not proof that this public page runs on Grafana, nor a complete or independently tested current stack. Platform evidence is separate from the direct website screenshot and is not a complete current infrastructure audit.
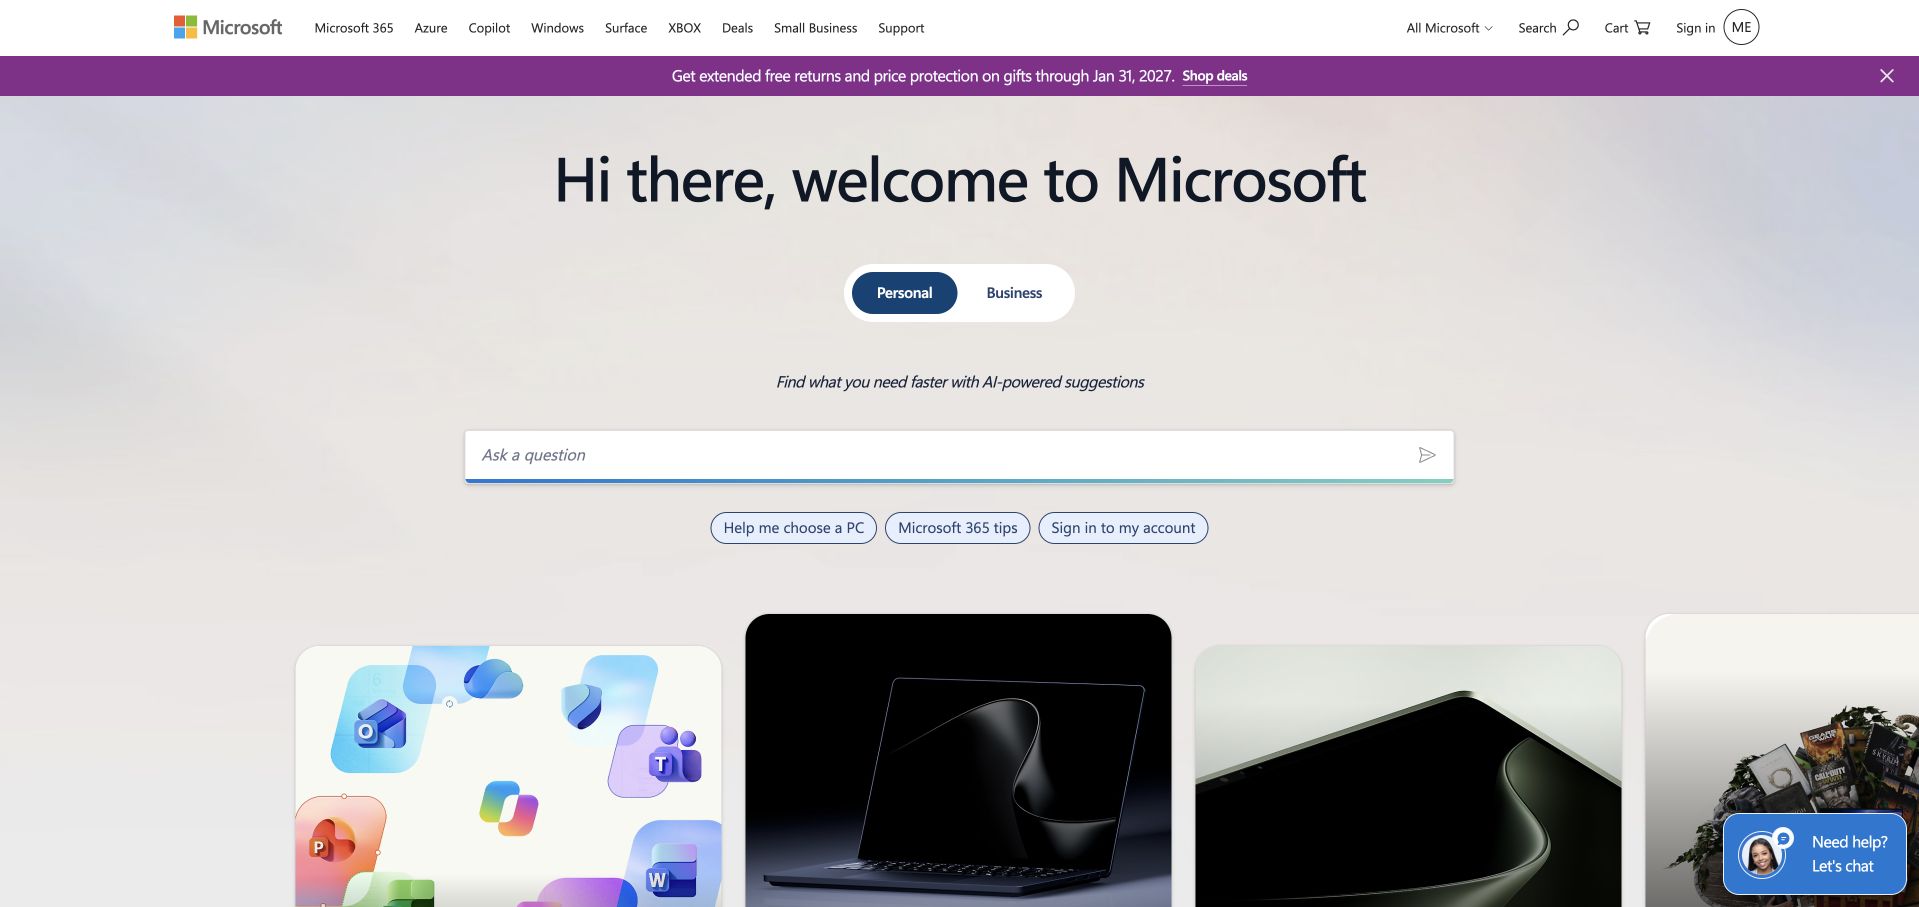
Microsoft’s public page uses a large greeting, a personal-versus-business switch and a broad question field above product imagery. A row of suggested questions supplies concrete starting points for an otherwise open-ended prompt. The familiar product navigation remains in the header, so the conversational entrance does not become the only available route. The design is useful for studying an AI-assisted discovery pattern, particularly the relationship between a flexible question field and predictable links for people who already know what they want.
What you can learn
The Grafana source is a bounded Azure Data Explorer and Grafana Cloud real-time analytics example, not a customer story proving the microsoft.com frontend. Treat it as an integration reference; it does not establish that this public prompt or every Microsoft service runs on Grafana.
Pros
Suggested questions make an open-ended prompt less ambiguous for a first-time visitor.
Conventional product navigation remains available beside the conversational discovery pattern.
Cons & considerations
A broad question field needs explicit limits, useful failure states and clear destination behavior.
A vendor integration tutorial cannot support a company-wide production-stack claim.
Platform source: Microsoft — official Grafana association. Microsoft Azure Data Explorer and Grafana Cloud real-time analytics example, not a microsoft.com frontend attribution. Official documentary association only. The named workload or listing is not proof that this public page runs on Grafana, nor a complete or independently tested current stack. Platform evidence is separate from the direct website screenshot and is not a complete current infrastructure audit.
Kegan has 15+ years of experience working with small businesses, Fortune 500 companies, and everything in between. No development job is too big or too small: he brings the same hands-on attention to a focused improvement, a complete website, or a custom application.
For Grafana projects, he can help with website integrations, form and campaign connections, analytics implementation, testing, and clear ownership after launch. He works directly with clients on scope, design, implementation, testing, and handover, with an emphasis on clear communication and a system that remains practical to maintain after launch.
Show 3 other Grafana developersHide other Grafana developers
Choose the component and operating model deliberately
A dashboard over existing data
Start with the sources the organization already trusts and define one useful view. Explain units, time range and freshness in ordinary language. Do not redesign the entire telemetry estate merely because the team needs a clearer way to read an existing signal.
Grafana Cloud and self-operated open-source deployments place different responsibilities on the team. Name the components and owners rather than treating the word Grafana as a complete architecture. Review upgrades, access, data sources and restoration requirements before approving the operating model.
Carvana’s documented example concerns k6, which should not be silently rewritten as every Grafana product. Define the permitted test environment, workload and success criteria, and obtain appropriate authorization before generating load. A useful test models a specific task; it is not a guarantee of real-world performance.
Record its question, data source, unit, time range and expected update behavior. Include what zero, stale and unavailable mean. This helps maintainers review the dashboard after the original author has left and makes it easier to remove attractive panels that no longer support a useful operating decision.
Review who can query the underlying source
Dashboard appearance and data access are not the same boundary. Grafana’s data-source documentation describes source management and permissions; the actual project still needs an access review appropriate to its edition and connected systems. Do not assume that hiding a panel prevents someone from reaching sensitive data elsewhere.
In a controlled environment, show a representative issue, the alert or view that exposes it and the investigation step the operator takes next. Then restore the normal condition. Include missing data and a changed source so the team can distinguish service trouble from a broken observation path.
A useful handover demonstration
Ask the actual team to carry out its routine job: publish a realistic update, correct a mistake, preview a narrow screen, and identify who owns an integration failure. For a library or frontend framework, also ask who maintains the content source and deployment. A polished screenshot does not answer those operational questions.
Beyond the screenshot
A Grafana project checklist
Name the operator’s actual question.
Identify the authoritative data source.
Explain units, time range and freshness.
Define zero, stale and missing states.
Choose the exact Grafana components required.
Assign Cloud or self-operated responsibilities.
Review data-source access, not only panel visibility.
Give each alert an owner and next action.
Test a controlled issue and recovery.
Keep load tests authorized and bounded.
Document source changes and dashboard maintenance.
Preserve dates and workload limits in technical claims.
Test with real content, a keyboard, a small screen, slow or failed requests, and the people who will maintain the system. These are planning checks, not an accessibility, security, performance, or search-ranking certification.
Sources & editorial method
How this Grafana collection was reviewed
Twenty distinct public website properties were independently reviewed for this Grafana collection. Direct public-browser captures were visually inspected; reused exact-page captures retain their original image paths, dates and provenance. Fresh captures were made November 9 UTC during November 8, 2026 Pacific research. A null capturedAt means the original day, but not a precise time, is known; no timestamp was invented. Official primary customer cases, engineering sessions, documentation and explicitly identified directory listings establish only the named workload or association. Historical material stays historical. Public screenshot appearance is not proof of the pictured page’s complete stack or current backend. These are original design observations, not measured rankings or endorsements of financial, clinical, security, accessibility, performance or AI outcomes. No private application workflows, signups, forms, purchases or account changes were used. Website owners retain their images and trademarks. The sole publisher performs a separate bounded public-stack audit before publication without replacing earlier observations.
Every image is an unmodified capture from the actual website, with its source and capture date. Some captures are reused from our shared catalog; their dates remain the original capture dates. None comes from a vendor gallery or a generated reconstruction. Moving imagery and live content can change.
Technology attribution uses public page assets or metadata, official platform documentation, or a cited first-party project case study. Documentary and framework-relationship evidence is identified where used; it is not a complete current backend inventory. A CMS image CDN alone does not establish a full CMS deployment. A library’s presence does not prove which individual controls use it, and a platform label does not establish AI authorship.
The composition notes, lessons, pros and tradeoffs are original editorial observations. We have not measured conversion, traffic, security, performance or accessibility conformance. Website owners retain their brands and imagery; these examples are not our client portfolio. Written, Edited and Curated are independent records, not dates advanced by a build. See our editorial standards or suggest a correction.
Questions worth asking
Grafana website development FAQs
Are these homepages built with Grafana?
That is not the claim. The public screenshots are visual references. Official sources document separately named observability, testing or integration work, which may occur entirely outside the marketing site.
Does using Grafana identify the metrics or log database?
No. Grafana can query different data sources, and a deployment may combine several components. Name the actual source and its role instead of inferring storage, collection and visualization from one label.
Are Grafana Cloud and open-source Grafana the same operating model?
No. They place different operating responsibilities on the team. This guide keeps product and deployment references attached to their sources instead of treating every case as one interchangeable stack.
Why is Carvana described as a k6 example?
Its official case concerns performance testing with k6. That evidence should not be expanded into a claim that Carvana uses every Grafana observability product or that the guide independently measured its current retail-site performance.
Does the Microsoft example prove microsoft.com uses Grafana?
No. The linked source is a real-time analytics integration example involving Azure Data Explorer and Grafana Cloud. It is included with that boundary explicit, not as a customer-story or frontend attribution for the public Microsoft page.
Borrow the clarity of the public layouts, then write an operating brief around your own questions, data sources and response responsibilities. A useful dashboard is a decision aid—not a visual trophy or a substitute for knowing the service.