Best Tableau Websites of 2026 (20 Real-World Examples)
Twenty public website references alongside documented Tableau analytics cases.
Explore recognizable brands and specialist organizations without confusing an internal visualization workload with the technology rendering a public homepage.
Nissan, Red Hat, Lenovo, Verizon and Honeywell lead the collection. Their public interfaces demonstrate corporate publishing, technical campaigns, regional commerce and industrial storytelling. The separately checked Tableau material describes particular reporting or analytical projects, not a universal frontend shared by these organizations.
The evidence spans different products and dates. A historical Server deployment, a Cloud story and a newer Tableau Next case are not interchangeable implementation guides. Read the original scope, including regional and departmental limits. The useful lesson is how to explain information and plan a trustworthy analytical experience—not how to borrow an entire architecture from a famous customer.
Before the examples
What makes good Tableau website development in 2026?
Design for a question rather than a gallery of charts
Write down what a reader should understand or decide after using the view. Choose the measure, comparison and supporting detail around that question. A dashboard can contain many attractive visualizations and still fail if the reader cannot tell which result matters or what the figures actually represent.
Separate authentication from data entitlement
A successful sign-in does not explain which records a person may see. Treat the application’s identity, Tableau access and data restrictions as related but distinct design questions. Review the supported authentication approach for the actual deployment and test the intended boundaries with deliberately different users.
Keep public design observations independent of vendor claims
A customer story can establish a particular analytics association without identifying the marketing page’s framework. Retain dates and subsidiary names, and distinguish vendor-reported outcomes from independent measurements. Use the screenshots to discuss hierarchy, imagery and navigation, not to imply a hidden backend inventory.
The collection · 20 examples
20 Tableau website examples worth studying
Exactly 20 independently reviewed public designs, with documentary associations qualified by organization, workload and historical context.
We start with five recognizable brands or organizations: Nissan, Red Hat, Lenovo, Verizon, Honeywell. Each attribution applies to the named website property, not every product or website belonging to its organization. This is a curated reading sequence, not a measured ranking.
Nissan’s global corporate page places a large urban vehicle scene beneath a minimal white header. The inspected feature centers the LEAF, giving the organization a tangible product reference before the smaller corporate material below. A reporting notice occupies its own strip rather than being folded into the campaign headline. The distinction matters: this is a group information destination, not simply a regional dealer’s sales page. The cited Tableau conference story dates to 2019 and concerns dealership and enterprise analysis. It does not prove that this current homepage or a vehicle’s systems use Tableau.
What you can learn
Let a recognizable product introduce the organization while preserving clear investor, news and company routes. Give time-sensitive reporting notices a stable, accessible position outside the hero artwork. The campaign can then change without making repeat corporate visitors hunt for the practical information they came to find.
Pros
A concrete product grounds a broad company identity immediately.
Reporting information has a separate treatment from the promotional image.
Cons & considerations
Vehicle campaigns need clear regional and model context.
Large images require useful alternatives when media loads slowly.
Platform source: Primary documented Tableau association. Documented association: 2019 dealership and enterprise analysis; historical association, not the current corporate public-page runtime. Platform evidence is separate from the direct website screenshot and is not a complete current infrastructure audit.
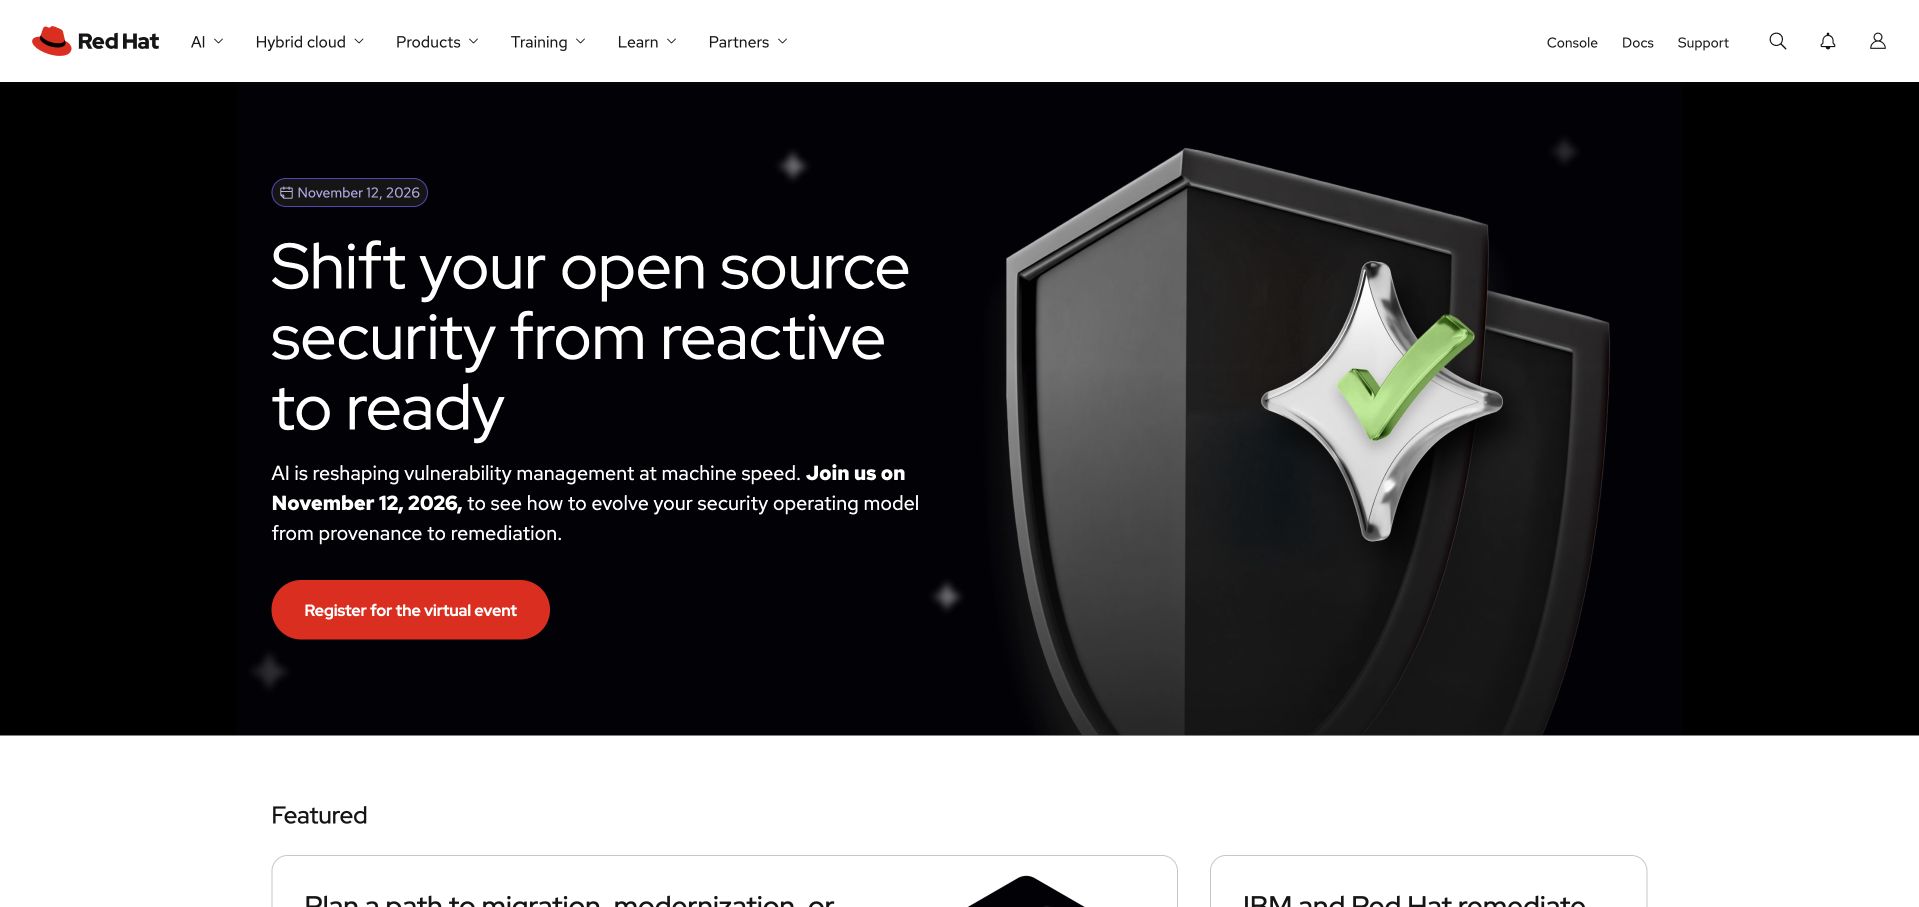
Red Hat pairs a dark security-themed campaign with a large shield-like illustration and a strong red action. The white enterprise header provides a familiar frame above the dramatic visual. Rather than showing a page of commands, the opening gives the campaign one recognizable subject and a clear continuation. The broader platform navigation remains available for visitors who want a product or documentation instead. Tableau’s customer story concerns enterprise data culture and Tableau Cloud. That association is separate from Red Hat’s operating-system products and from the implementation of the public marketing page.
What you can learn
Choose a visual metaphor that helps readers recognize the topic, then lead to specific technical information. Keep event or campaign registration distinct from product exploration. A developer-facing brand can be visually expressive without making the first screen a technical puzzle or letting an illustration substitute for a useful explanation.
Pros
The security motif gives a broad campaign an identifiable subject.
A contrasting red action is easy to locate against the dark field.
Cons & considerations
Campaign destinations need clear context about the commitment involved.
Technical claims require supporting documentation beyond the visual metaphor.
Platform source: Primary documented Tableau association. Documented association: Enterprise data-culture/Tableau Cloud adoption; not the operating-system product or public frontend. Platform evidence is separate from the direct website screenshot and is not a complete current infrastructure audit.
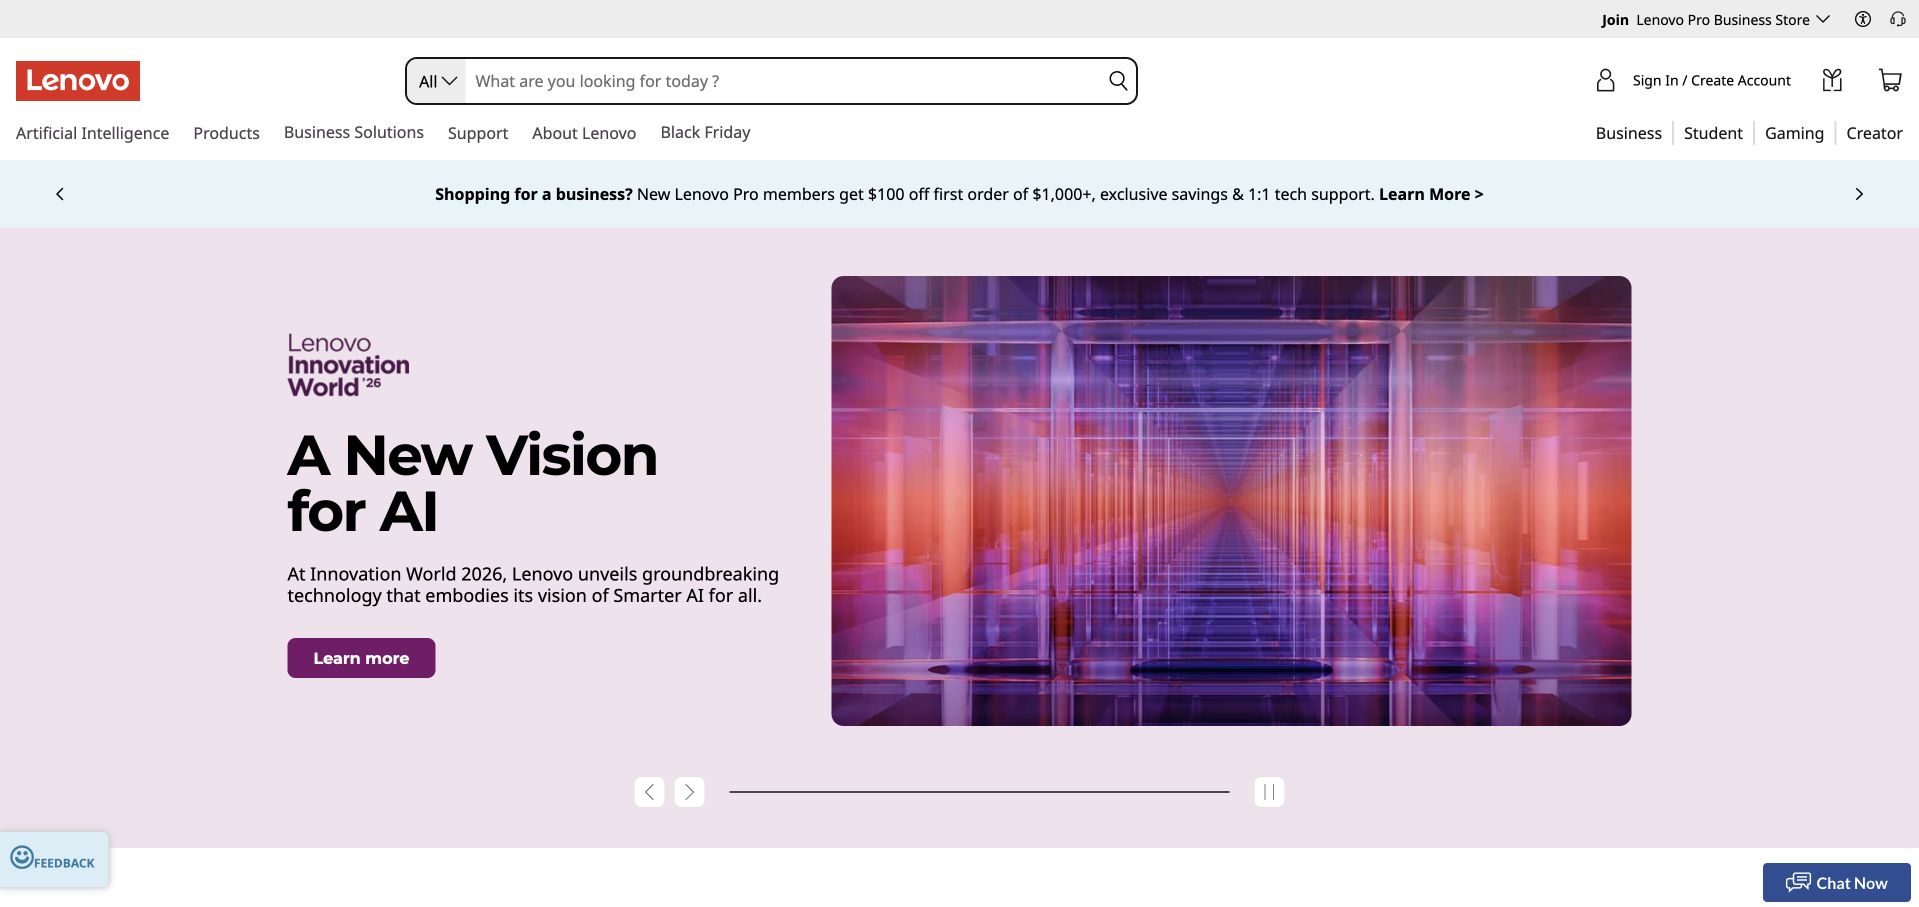
Lenovo’s US storefront uses a vivid purple campaign about AI innovation beneath a detailed shopping header. Search, audience routes and promotional utilities frame the large feature rather than disappearing behind it. The composition demonstrates the tension a broad electronics store must manage: visitors may arrive to browse a new idea or find a specific computer immediately. The campaign is visually dominant, but the surrounding interface acknowledges those different intentions. The Tableau source specifically concerns Lenovo India’s sales and ecommerce analytics. It does not establish a uniform implementation across every Lenovo region or the current US storefront.
What you can learn
Give a major campaign a clearly bounded space while keeping search and shopping categories dependable. Separate consumer, business and other audience routes only when they lead to useful differences. A strong regional store design should also make geography and commercial terms clear rather than assuming every visitor can use the same offer.
Pros
Prominent search supports visitors who already know what they need.
A bounded purple campaign creates impact without replacing the store structure.
Cons & considerations
Promotional strips can crowd the header on small screens.
Regional offers require clear availability and eligibility information.
Visible tech stack
Earlier / documented evidence
Tableau
Platform source: Primary documented Tableau association. Documented association: Lenovo India analytics and ecommerce reporting; not proof across every regional storefront. Platform evidence is separate from the direct website screenshot and is not a complete current infrastructure audit.
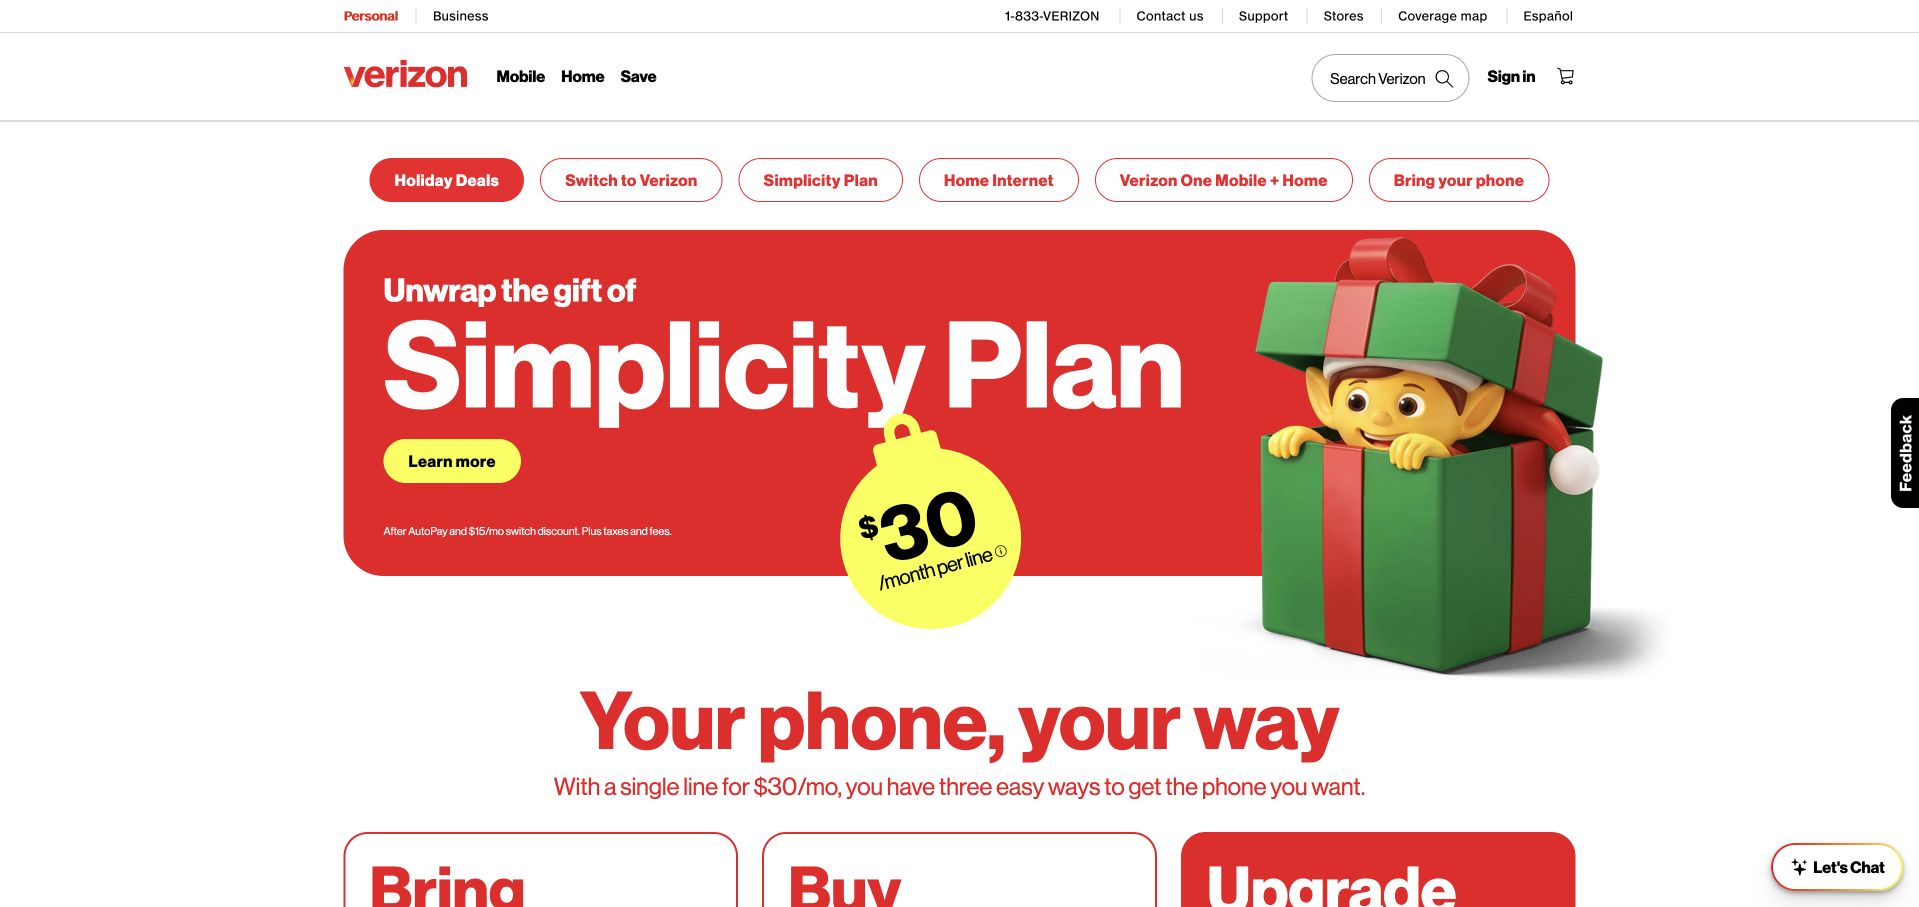
Verizon’s inspected homepage uses a red holiday feature with phone imagery and a concise plan-oriented message. A layered header offers product categories and practical shopping routes above the promotion. The composition makes the current campaign easy to identify without presenting the service as an abstract corporate promise. Smaller offer details still carry an important burden, because an appealing device image cannot explain all plan conditions. Tableau’s associated story concerns internal analytics and customer-service decision support. It is not evidence that the retail promotion, shopping journey or public page rendering is built with Tableau.
What you can learn
Use brand color and recognizable devices to establish the offer, then give conditions and comparisons a readable route of their own. Maintain the distinction between shopping, support and account tasks. A seasonal promotion should be easy to replace without changing the navigation that returning customers rely on throughout the year.
Pros
A strong red field gives the campaign immediate visual identity.
Product categories remain available above the seasonal feature.
Cons & considerations
Offer conditions need readable treatment rather than tiny promotional text.
Multiple header layers require disciplined mobile priorities.
Platform source: Primary documented Tableau association. Documented association: Internal analytics and customer-service decision support; separate from public-page implementation. Platform evidence is separate from the direct website screenshot and is not a complete current infrastructure audit.
Honeywell’s About Us page sets a large autonomy-oriented statement beside a mosaic of industrial imagery. The white reading area gives the message room, while the adjacent scenes connect the organization to physical equipment and working environments. Red accents provide continuity with the corporate identity without turning the full page into a campaign background. This overview is a useful alternative to relying entirely on a homepage video. Tableau’s August 2018 account describes a governed enterprise deployment; it does not establish the technology of the pictured overview or every Honeywell business property.
What you can learn
For a broad industrial organization, pair the high-level proposition with scenes that explain its operating context. Use the overview to orient readers before sending them into business units or detailed solutions. Keep the images related enough to feel intentional, and supply concrete explanations rather than asking an abstract transformation slogan to describe the whole company.
Pros
The white text area preserves a predictable reading surface.
Several industrial scenes suggest breadth without a long opening catalog.
Cons & considerations
A mosaic can become decorative if its subjects are not explained.
Broad autonomy language needs specific supporting capabilities and scope.
Platform source: Primary documented Tableau association. Documented association: August 2018 snapshot of a governed enterprise Tableau deployment; historical association, not current proof across every brand site. Platform evidence is separate from the direct website screenshot and is not a complete current infrastructure audit.
Charles Schwab’s public homepage places a blue promotional message within a largely white layout, with a separate login utility and a row of audience-oriented options. The blank public account controls are not a private dashboard; they are one of several routes through the opening. The offer draws attention, but the surrounding structure acknowledges visitors who need research, account information or another service. Tableau’s 2018 conference story concerns branch, call-center and financial-consultant analytics. That historical workload is separate from the current public page and provides no evidence about an offer’s suitability or the implementation of trading functions.
What you can learn
Keep a financial promotion distinct from account access and general research. Explain product terms and eligibility through clear destinations rather than relying on a headline rate. A familiar utility area can help returning visitors, provided it remains accessible and does not make an unrelated marketing action appear necessary to reach their account.
Pros
Whitespace keeps the promotional message distinct from surrounding utilities.
Several audience routes acknowledge different reasons for visiting.
Cons & considerations
Time-sensitive rates need clearly dated conditions and disclosures.
Public login utilities require careful separation from sales messages.
Visible tech stack
Earlier / documented evidence
Tableau
Platform source: Primary documented Tableau association. Documented association: 2018 conference account of branch/call-center/financial-consultant analytics; historical association, not current public trading-page frontend detection. Platform evidence is separate from the direct website screenshot and is not a complete current infrastructure audit.
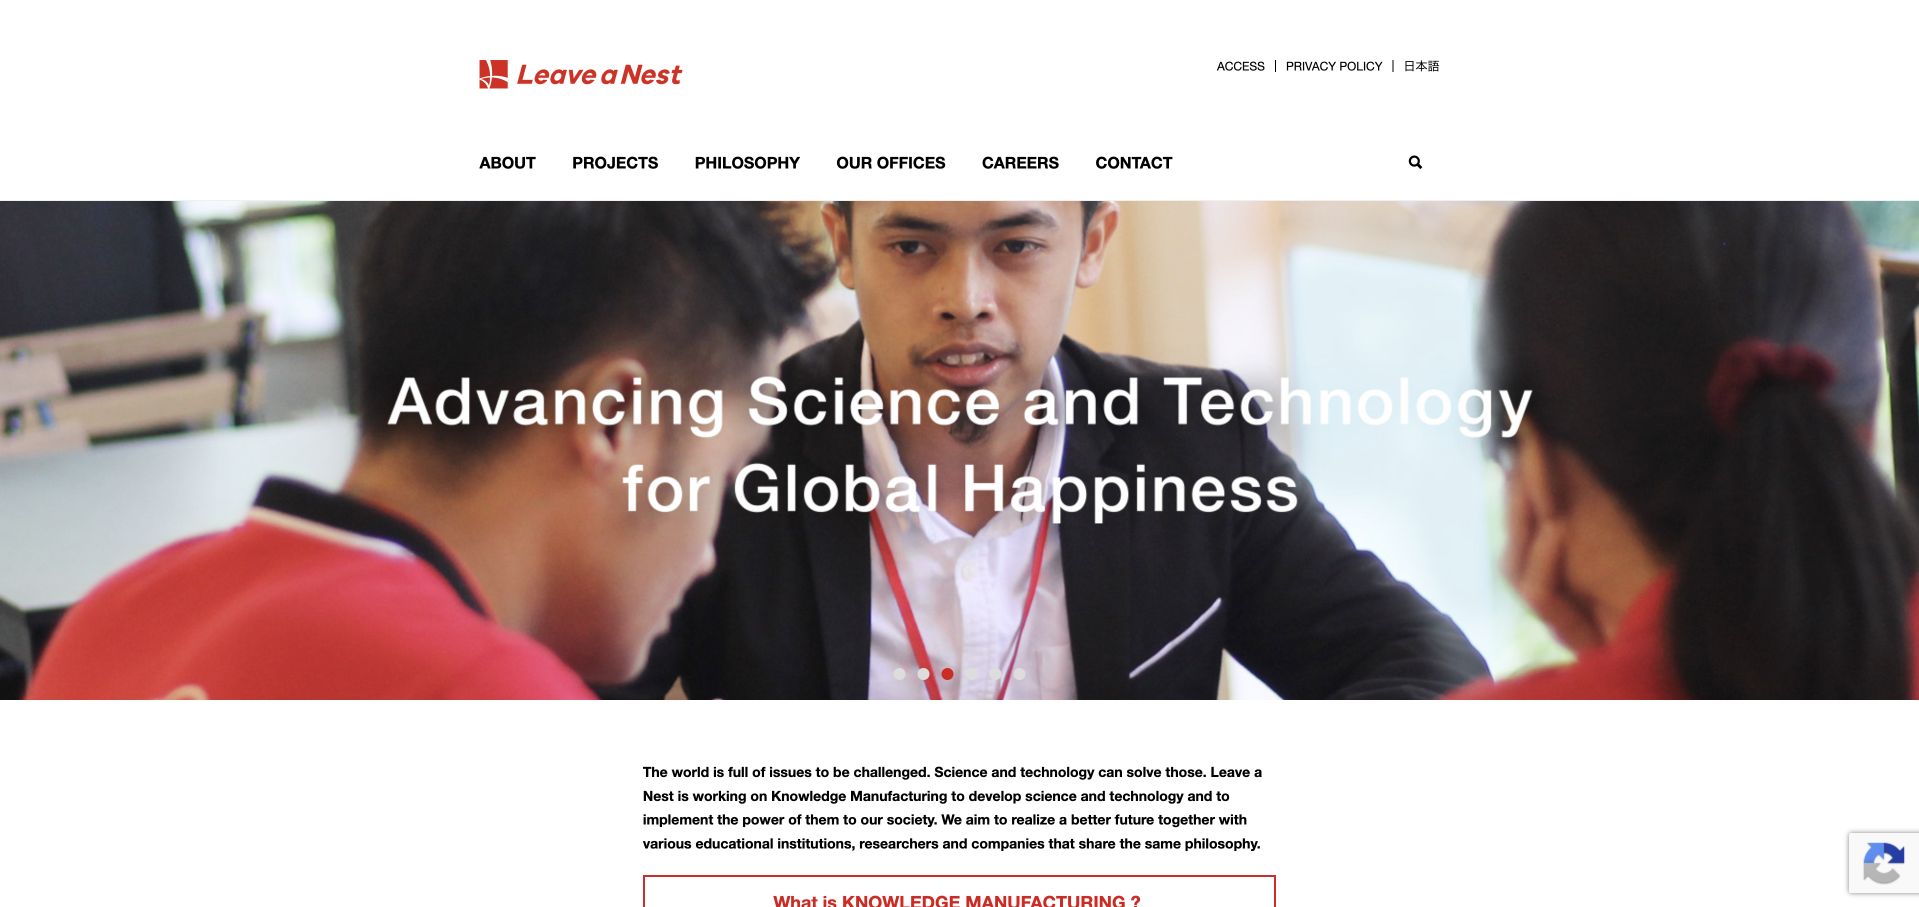
Leave a Nest’s global site opens with event photography and a short mission-led introduction. The scene gives its science and entrepreneurship work a human setting before readers encounter the organization’s projects, philosophy and offices. A restrained white navigation frame keeps those institutional routes visible around the image. The page is more useful as a reference for explaining a collaborative organization than for selling a single software feature. The Tableau case concerns sales and event-related analysis through Tableau Next and Slack. It does not identify the public page’s frontend or independently validate the organization’s research services.
What you can learn
Show the setting in which the organization works, then explain the role it plays there. Make projects, locations and the underlying mission accessible as distinct destinations. Event photography adds context only when the surrounding copy tells a new reader why the people are gathered and how that relates to the organization’s ongoing work.
Pros
An active event scene provides context for an otherwise broad mission.
Institutional navigation offers several ways to understand the organization.
Cons & considerations
Event imagery needs descriptive context and a useful text alternative.
A broad mission should lead quickly to specific projects and services.
Platform source: Primary documented Tableau association. Documented association: Business insight through Tableau Next and Slack; not public-page rendering or a research-service endorsement. Platform evidence is separate from the direct website screenshot and is not a complete current infrastructure audit.
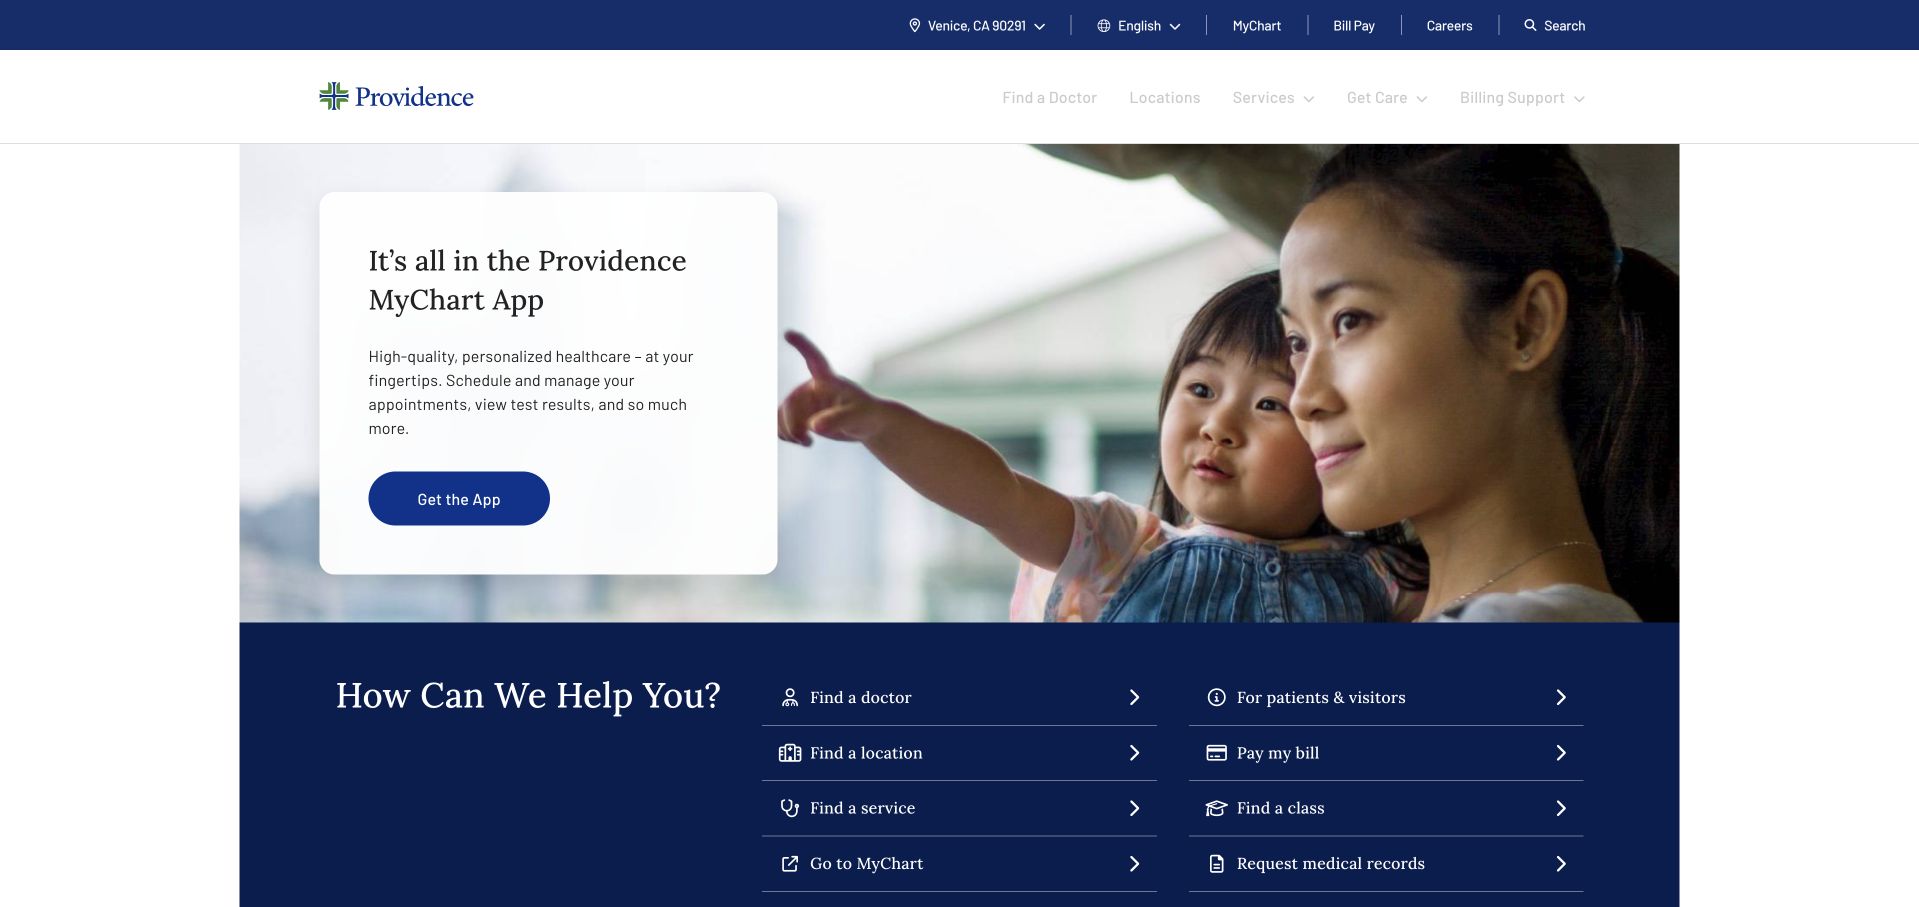
Providence’s public homepage uses a blue-and-white visual system around a family image and a MyChart-oriented feature. Nearby routes help visitors find a provider or a relevant care destination instead of treating the homepage solely as a brand advertisement. The imagery creates a welcoming setting, but the task labels do the navigational work. This distinction is valuable for a service where returning patients and new visitors may have very different needs. The Tableau source describes a care and cost-analysis workload, not the CMS behind the public page or evidence for a particular clinical outcome.
What you can learn
Use a familiar patient tool as one entry point without making it the only way to navigate. Distinguish account access, provider discovery and care information in plain language. Keep urgent guidance separate from ordinary marketing, and ensure the page remains useful to someone who cannot interpret the photograph or use an interactive assistance widget.
Pros
Patient-tool messaging connects the introduction to a practical action.
Provider and care routes support visitors with different immediate needs.
Cons & considerations
Urgent situations require distinct guidance rather than general promotional routing.
Regional care availability must remain clear throughout the journey.
Platform source: Primary documented Tableau association. Documented association: Care and cost-analysis workload documented by Tableau; not evidence of the public healthcare-site CMS. Platform evidence is separate from the direct website screenshot and is not a complete current infrastructure audit.
PEMCO’s opening uses a large family-and-car photograph beneath a dark navigation bar. A bold prevention-oriented headline occupies the image, with quotation and explanatory actions given distinct roles. The scene makes the subject tangible without starting with a complicated product comparison. It is a public insurance marketing page, so the visual reassurance still needs to lead to policy information and clear conditions. Tableau’s customer account concerns claims analysis and server management. It does not establish current public-page technology or verify the suitability, coverage or performance of the insurance products presented.
What you can learn
Connect an abstract service promise to a recognizable situation, then separate the exploratory action from a quotation journey. Keep policy details, eligibility and service information accessible beyond the hero. The photograph should support the proposition without implying that a particular family scene guarantees protection or that all visitors share the same coverage needs.
Pros
Everyday photography gives the prevention theme a clear context.
Distinct quote and learn actions support different levels of intent.
Platform source: Primary documented Tableau association. Documented association: Insurance claims analysis and server management; not an endorsement of policy terms or current full stack. Platform evidence is separate from the direct website screenshot and is not a complete current infrastructure audit.
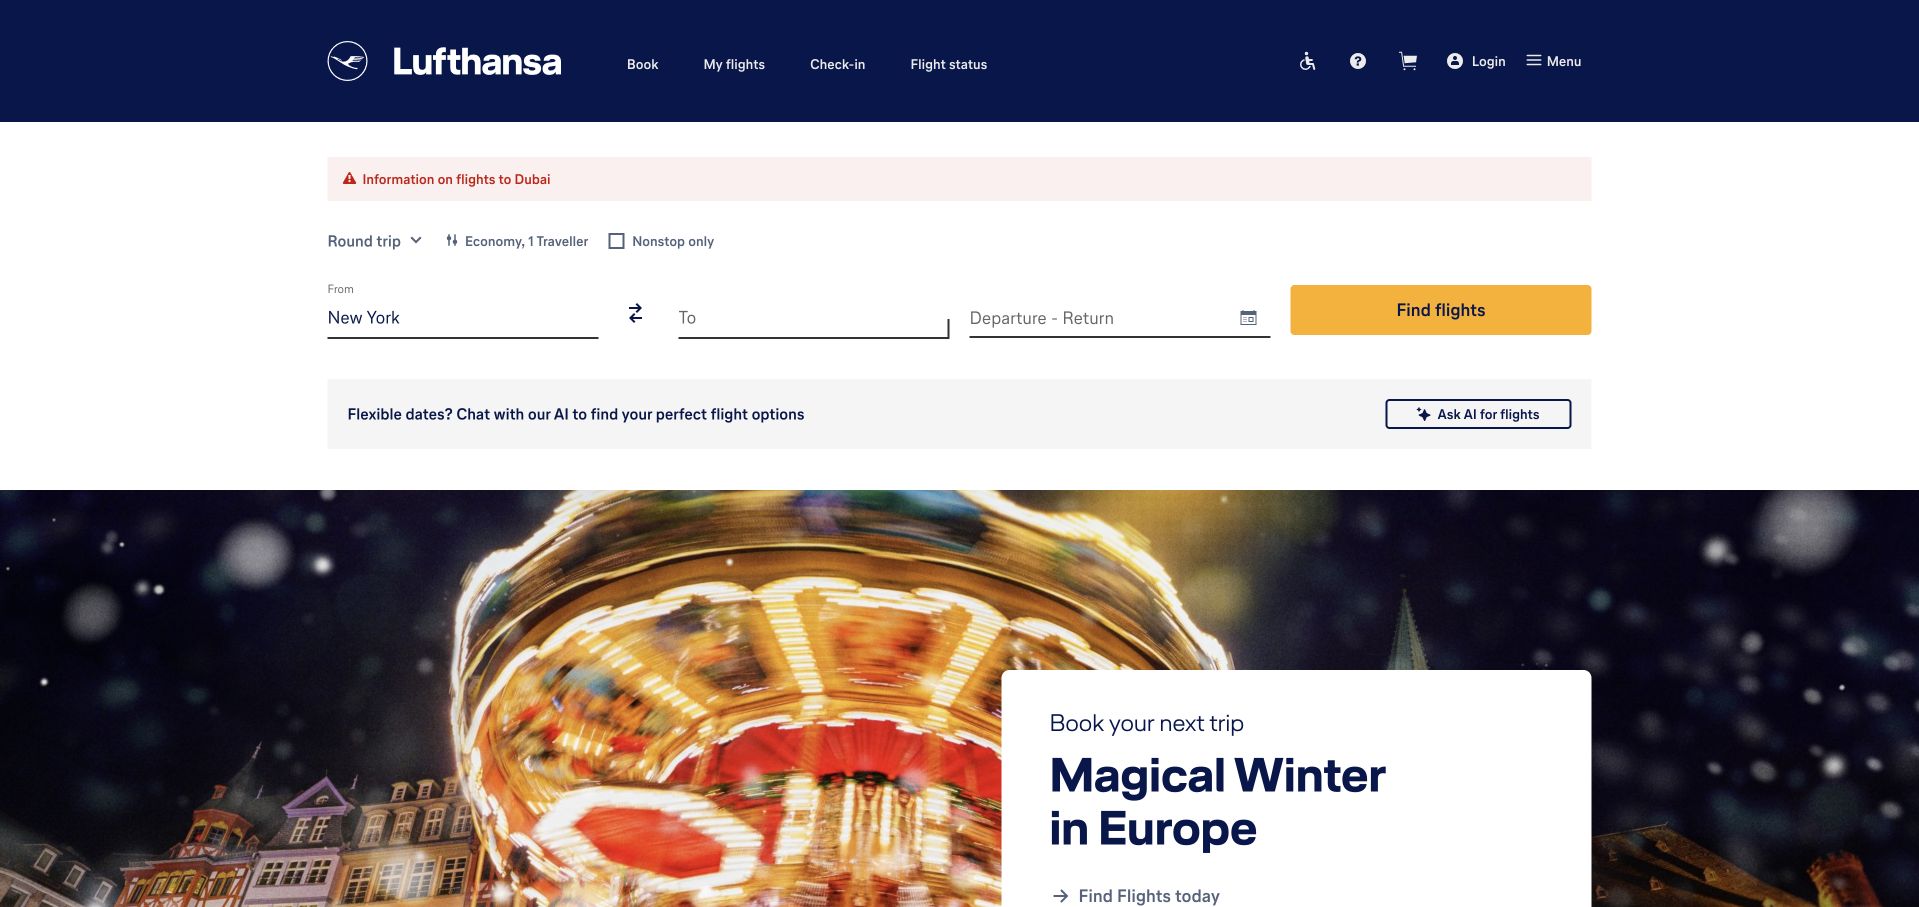
Lufthansa places an unfilled flight-search interface prominently within its public US page. The dark-blue identity and travel imagery frame the form, but the search task takes priority over a general company story. Promotional content remains nearby for visitors who are still exploring. This is a useful example of designing around a known high-intent action, provided the form’s labels and state changes stay understandable. The Tableau source documents departmental analysis within the group. It does not establish the technology behind flight availability, booking, operational systems or the visible public search interface.
What you can learn
When most visitors arrive to perform a known task, give that task a clear starting point. Explain location, date and passenger inputs without relying only on placeholder text. Keep promotions subordinate to the form and make the transition into results understandable, including what happens when a route is unavailable or the visitor needs additional assistance.
Pros
The main travel task is visible without reading a long brand introduction.
A consistent dark-blue frame distinguishes navigation from the search area.
Cons & considerations
Multi-input forms need strong labels, validation and keyboard behavior.
Campaigns must not obscure search or essential travel information.
Visible tech stack
Earlier / documented evidence
Tableau
Platform source: Primary documented Tableau association. Documented association: Documented departmental analysis; no inference about Lufthansa booking-engine technology. Platform evidence is separate from the direct website screenshot and is not a complete current infrastructure audit.
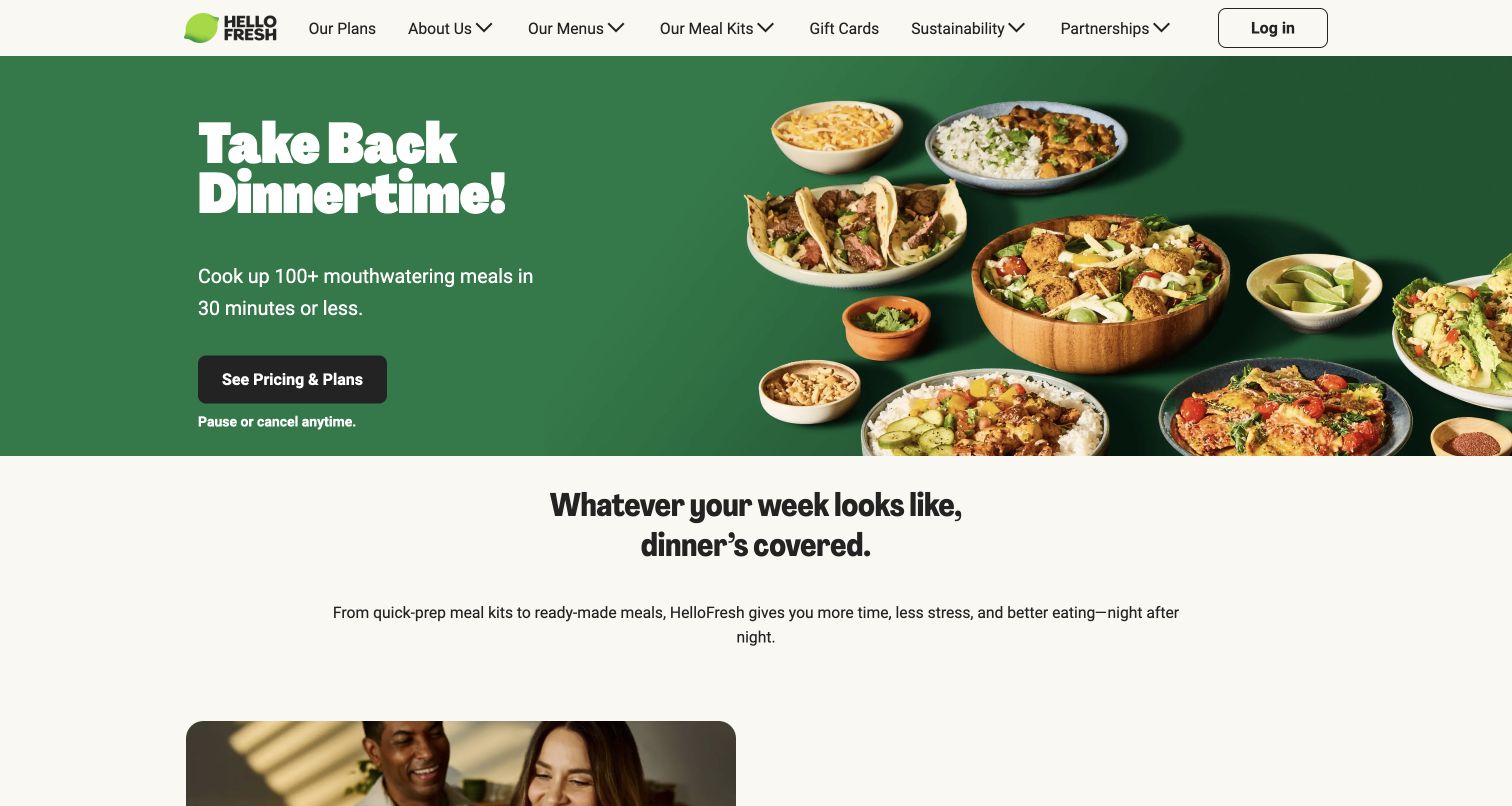
HelloFresh’s public page pairs a green brand treatment with food photography and a concise dinner-oriented message. The inspected opening makes the meals visible rather than explaining the service through an abstract lifestyle statement. A clear plans action gives the visitor a next step, with reassurance about subscription flexibility placed nearby. That combination is useful to study as a hierarchy, not as proof of any savings or dietary outcome. Tableau’s customer story concerns marketing-campaign analysis. The analytics association does not identify the technology rendering the storefront or running every subscription operation.
What you can learn
Show what the customer receives and place the next decision close to that explanation. Keep subscription conditions readable before commitment, and give dietary, delivery and plan details their own clear destinations. Food imagery can make the proposition appealing, but it should not carry information that must also be available as accessible text.
Pros
The product photography makes the service immediately recognizable.
A direct plans action turns the introduction into a clear journey.
Cons & considerations
Subscription reassurance needs supporting terms and cancellation details.
Delivery and dietary information must remain easy to verify.
Visible tech stack
Earlier / documented evidence
Tableau
Platform source: Primary documented Tableau association. Documented association: Marketing-campaign analysis; storefront rendering and subscription operations remain separate questions. Platform evidence is separate from the direct website screenshot and is not a complete current infrastructure audit.
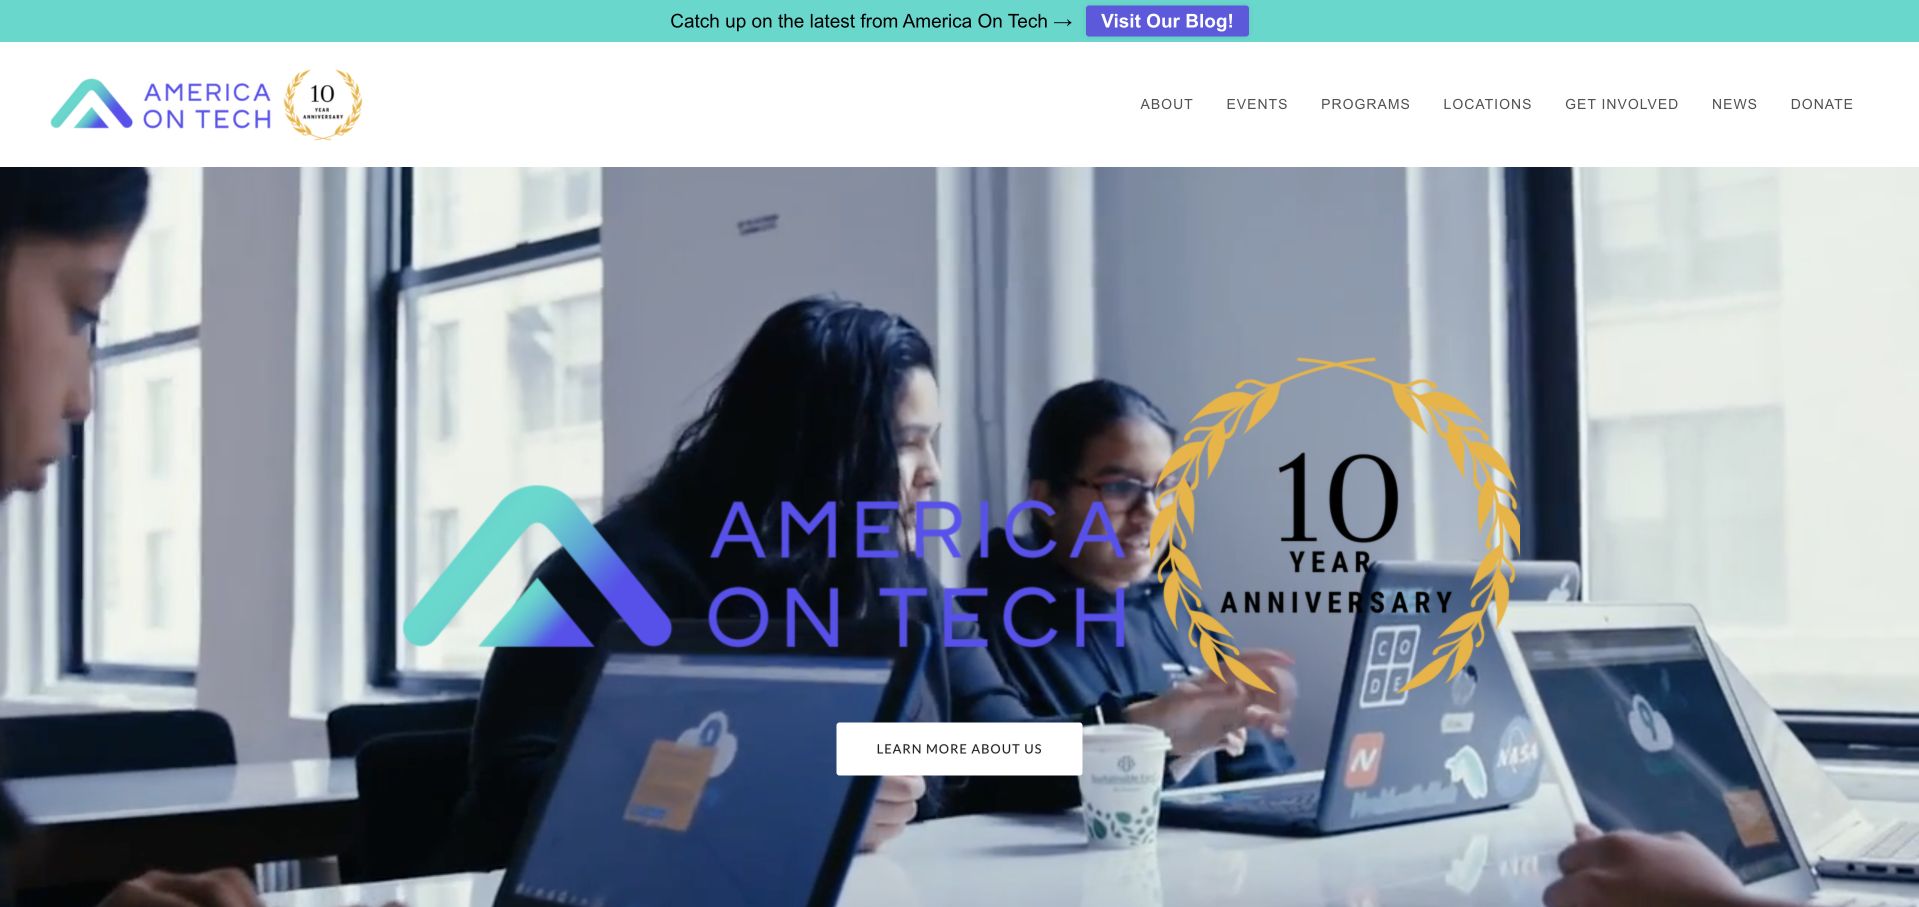
America On Tech’s homepage combines teal and purple branding with a large anniversary-oriented feature. A prominent photograph gives the milestone a human subject, while the header preserves program, organization and donation routes. The opening feels celebratory, but the mission and practical pathways remain part of the surrounding structure. This is useful for nonprofits that need to acknowledge a significant moment without making every visitor read a campaign story first. Tableau’s case concerns grant reporting through Tableau Next. It does not establish the public website’s CMS or independently verify the organization’s educational results.
What you can learn
Use a milestone to draw attention, then connect it to the ongoing work and the ways different visitors can participate. Keep program information and donation controls identifiable outside the campaign artwork. Dates and supporting material help readers understand whether an anniversary feature is current and what continues after the celebration ends.
Pros
Distinctive colors connect the campaign to a recognizable nonprofit identity.
Program and giving routes remain visible around the feature.
Cons & considerations
Milestone campaigns need an update plan after the event passes.
Impact claims require supporting information beyond celebratory photography.
Platform source: Primary documented Tableau association. Documented association: Grant reporting using Tableau Next; not proof of the nonprofit public-site CMS. Platform evidence is separate from the direct website screenshot and is not a complete current infrastructure audit.
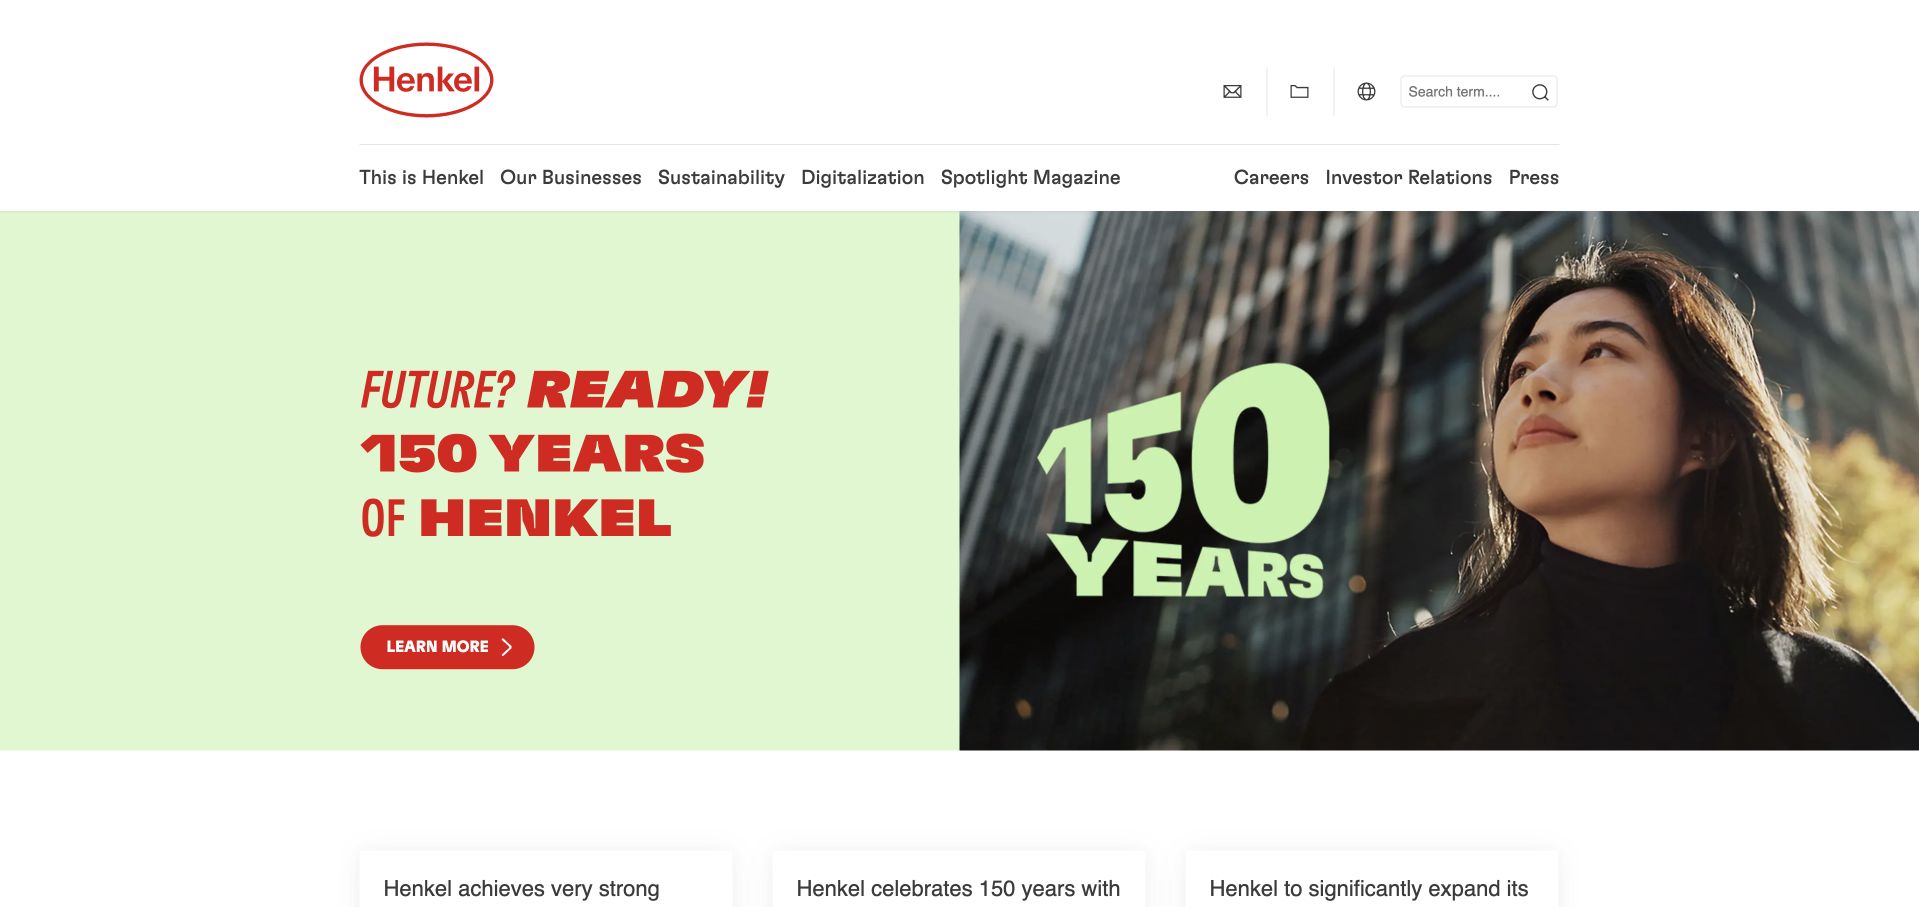
Henkel’s corporate page pairs a large anniversary motif with a green message area and a restrained navigation frame. The oversized year-related graphic gives the feature an immediate organizing idea, while the text provides the company context. Instead of opening with a long chronology, the page establishes the occasion and leaves detailed material to subsequent destinations. Corporate business and sustainability routes still have their own place above the campaign. Tableau’s dated source concerns Laundry & Home Care supply-chain reporting. That business workload should not be interpreted as the implementation of every Henkel product website or this anniversary presentation.
What you can learn
Give a history campaign one visual idea, then supply detail progressively. State its date and purpose so future visitors understand the context. Preserve current products, reporting and company navigation outside the temporary feature.
Pros
The large anniversary motif makes the campaign’s subject easy to recognize.
A separate reading area prevents the graphic from carrying all the information.
Cons & considerations
Anniversary material needs a clear archival destination after the campaign.
Heritage messaging should lead to specific current business information.
Platform source: Primary documented Tableau association. Documented association: Historical Laundry & Home Care supply-chain reporting, with 2016 adoption and a May 2020 update; not current group-wide infrastructure or every product website. Platform evidence is separate from the direct website screenshot and is not a complete current infrastructure audit.
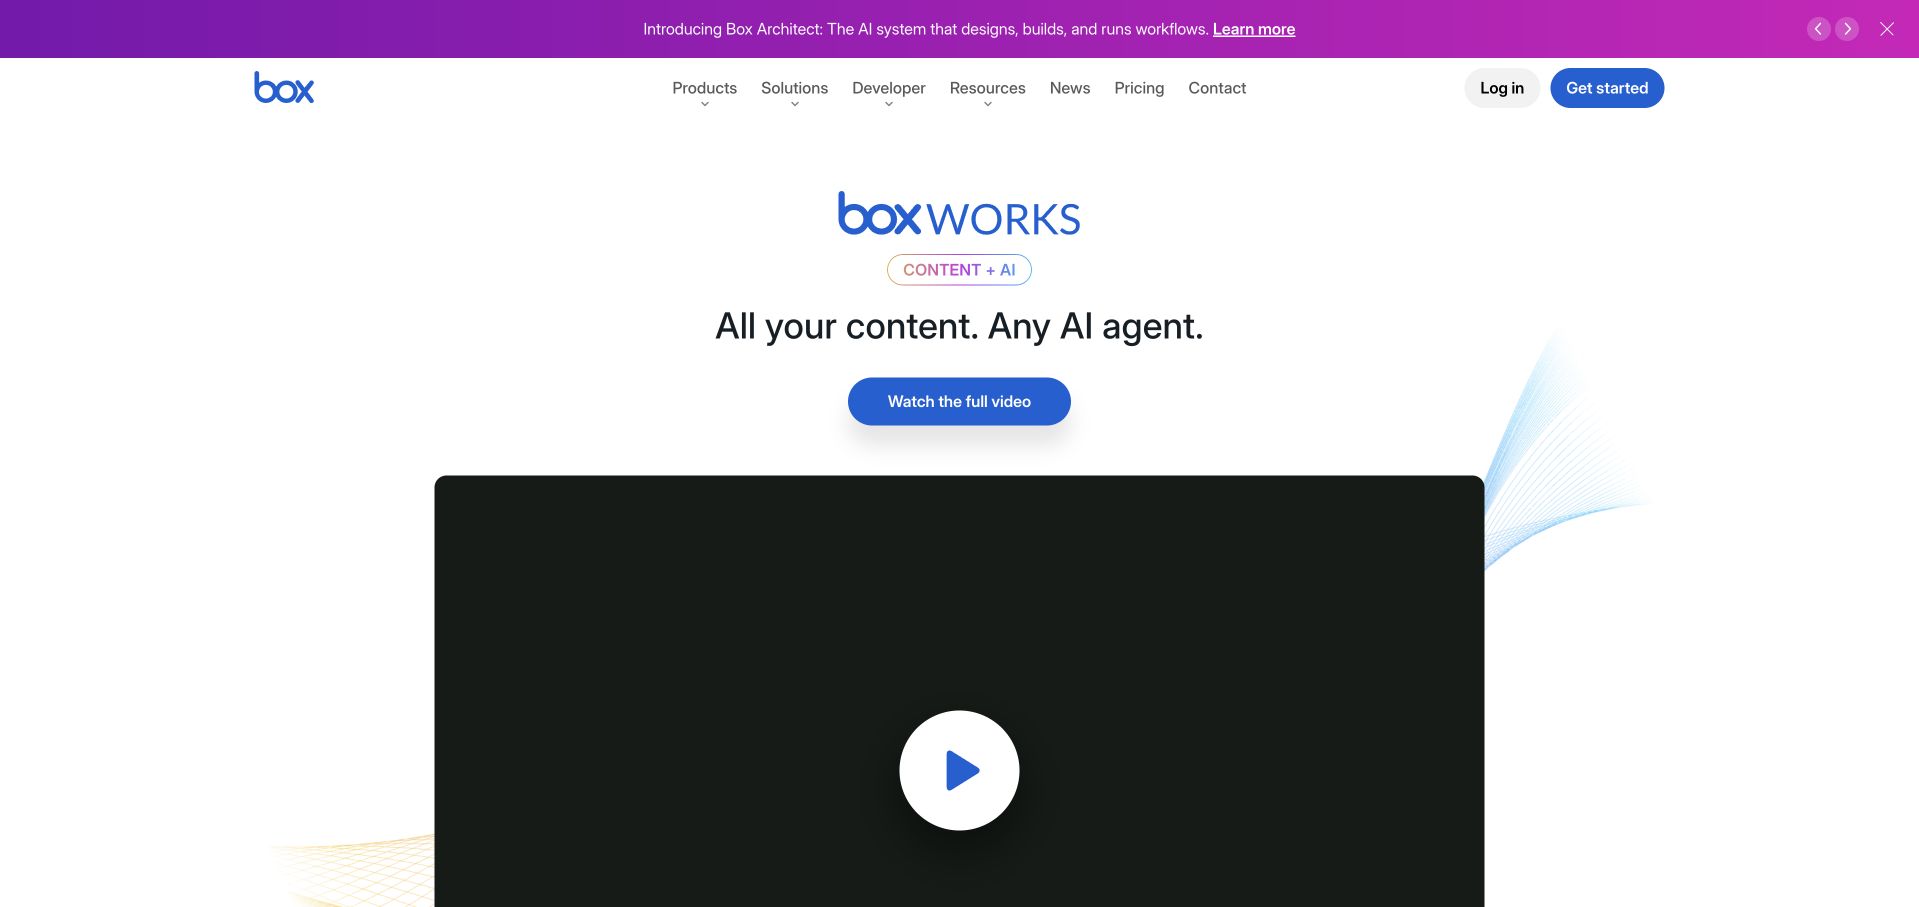
Box’s inspected homepage leads with a boxWORKS feature in a largely white-and-blue layout. The event presentation sits within a conventional enterprise header, with product, solution and developer routes available above it. That frame keeps the public site useful for someone who is not attending the event. The featured visual introduces a current company theme, while supporting interface and category material can explain the actual platform beyond the campaign. Tableau’s customer story concerns security-data analysis with Tableau Cloud and Pulse. It is not evidence that the storage platform or marketing page is rendered by Tableau.
What you can learn
Let a major event provide a timely introduction, but preserve permanent paths into the product and its documentation. Distinguish event registration from an ordinary demonstration or trial. Explain the capabilities behind the campaign so a reader can make sense of the platform even after the featured conference is no longer current.
Pros
A familiar enterprise header remains useful around the event feature.
Developer and product routes acknowledge distinct levels of technical interest.
Cons & considerations
Event-led homepages need a timely replacement and archive plan.
Campaign language should not substitute for concrete product explanations.
Platform source: Primary documented Tableau association. Documented association: Security-data analysis documented in a vendor customer story; not a statement about content-storage runtime. Platform evidence is separate from the direct website screenshot and is not a complete current infrastructure audit.
Virgin Media O2’s newsroom uses a large infrastructure-related photograph beneath a compact black header. The inspected feature includes a working vehicle and a strong white statement, connecting the organization to a practical setting rather than opening with a phone tariff. This is a corporate publication, not the consumer account or retail site, so the surrounding navigation serves a different purpose. The image provides a recognizable setting for news and company information. Tableau’s case concerns fraud monitoring using Tableau and Pulse. It does not identify the public newsroom’s stack or the technology behind the telecommunications network.
What you can learn
Keep a newsroom’s editorial role distinct from customer sales and support. Use a concrete operational scene to introduce the story, then provide dated articles and clear media routes. A public-company publication can share the parent identity without inheriting every shopping or account control from the consumer website.
Pros
An operational photograph gives the corporate subject a tangible setting.
The compact black header creates a strong frame for editorial content.
Cons & considerations
White text over photography needs dependable contrast across changing features.
Newsroom visitors still need clear dates and media-contact destinations.
Platform source: Primary documented Tableau association. Documented association: Fraud monitoring through documented Tableau/Pulse/Agent capabilities; not proof of the public newsroom stack or a separately verified Cloud deployment. Platform evidence is separate from the direct website screenshot and is not a complete current infrastructure audit.
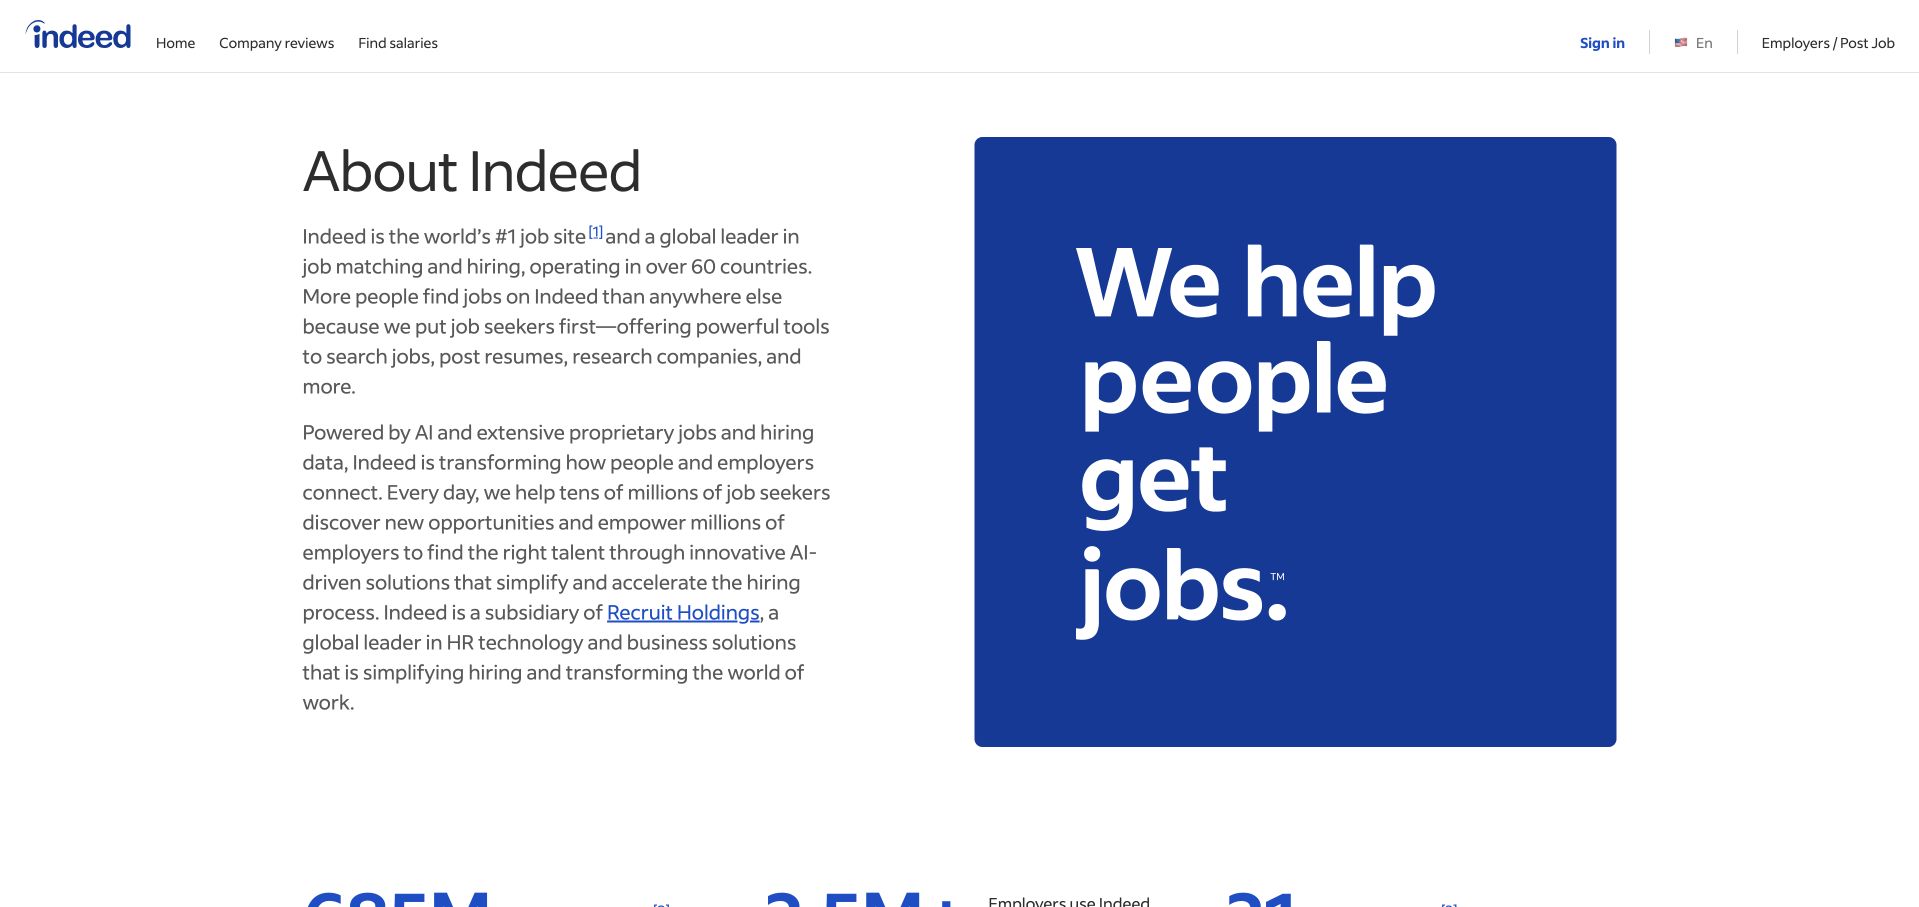
Indeed’s About page uses a large blue block and bold white mission statement alongside a quieter explanatory area. The layout avoids making a generic office photograph the main explanation. Instead, type scale and color establish the subject, with supporting text giving the organization more context. This corporate introduction is distinct from the job-search product, even though the brand is familiar to many visitors. Tableau’s customer material describes business decision-making and related enterprise systems. It does not establish the current public job-search frontend or every implementation used across the organization’s services.
What you can learn
A recognizable service can use a concise mission statement when the surrounding content explains what the organization actually does. Give typography a clear hierarchy and a comfortable line length, then provide routes to company information beyond the slogan. Keep corporate and product journeys distinguishable so visitors can move to the task they intended.
Pros
Type and color communicate the subject without relying on decorative imagery.
The split composition gives explanatory copy a distinct reading space.
Cons & considerations
A mission statement still needs concrete organizational detail.
Very large lettering requires careful wrapping on narrow screens.
Platform source: Primary documented Tableau association. Documented association: Business decision-making documented by Tableau; public careers/job frontend is not independently attributed. Platform evidence is separate from the direct website screenshot and is not a complete current infrastructure audit.
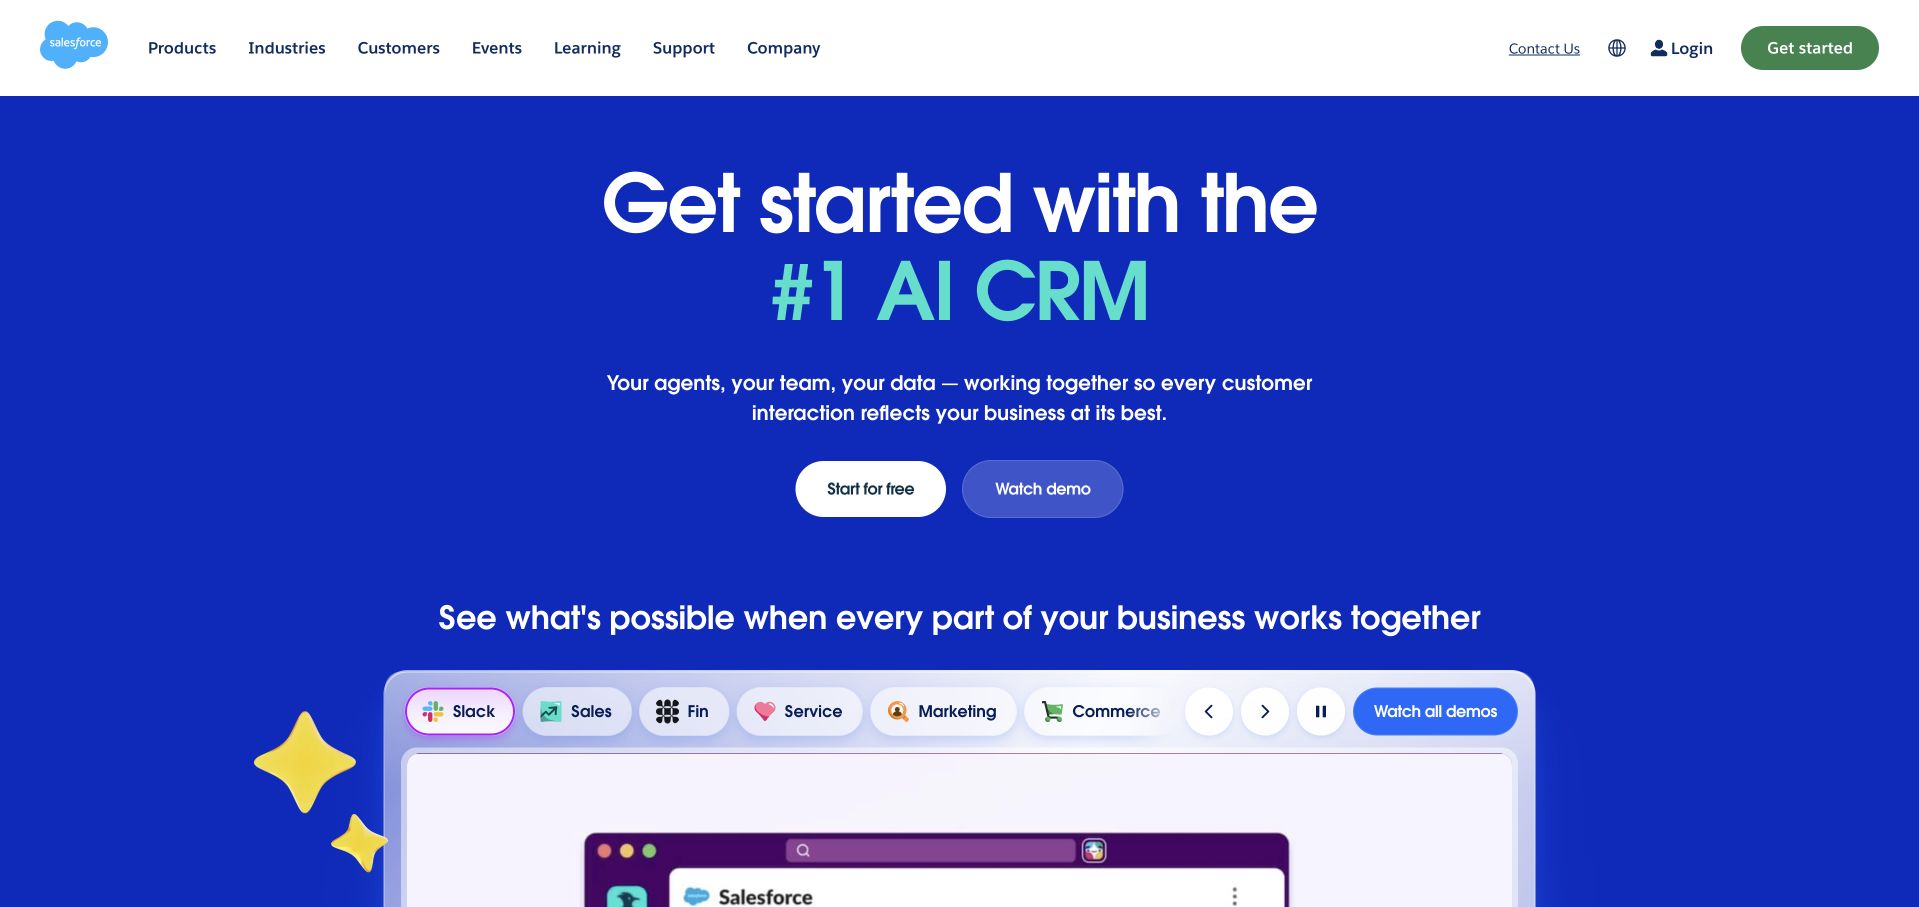
Salesforce uses a saturated blue opening beneath a white enterprise header. A centered proposition and compact actions lead into product imagery, while category controls provide a map of the wider offering. The separation between the blue marketing stage and lighter interface panels helps readers recognize where the software demonstration begins. It is a useful way to impose hierarchy on a large suite, though the supporting claims still need evidence. The paired Tableau story concerns Salesforce’s own sales teams using Tableau Next as an internal customer. It does not mean that the marketing HTML is generated by Tableau.
What you can learn
Explain the main category first, then show how the products relate to it. Make product navigation useful rather than decorative, with clear differences between exploration, a trial and a sales conversation. An enterprise homepage should help a reader form a mental map before asking them to understand the full portfolio or commit to a demonstration.
Pros
Strong color separation makes the product demonstration easy to locate.
Category controls give a broad offering a more understandable structure.
Cons & considerations
Large enterprise menus require disciplined organization on mobile.
Broad AI or productivity claims need relevant supporting detail.
Platform source: Primary documented Tableau association. Documented association: Sales-team Tableau Next analytics; not proof that Salesforce marketing HTML is generated by Tableau. Platform evidence is separate from the direct website screenshot and is not a complete current infrastructure audit.
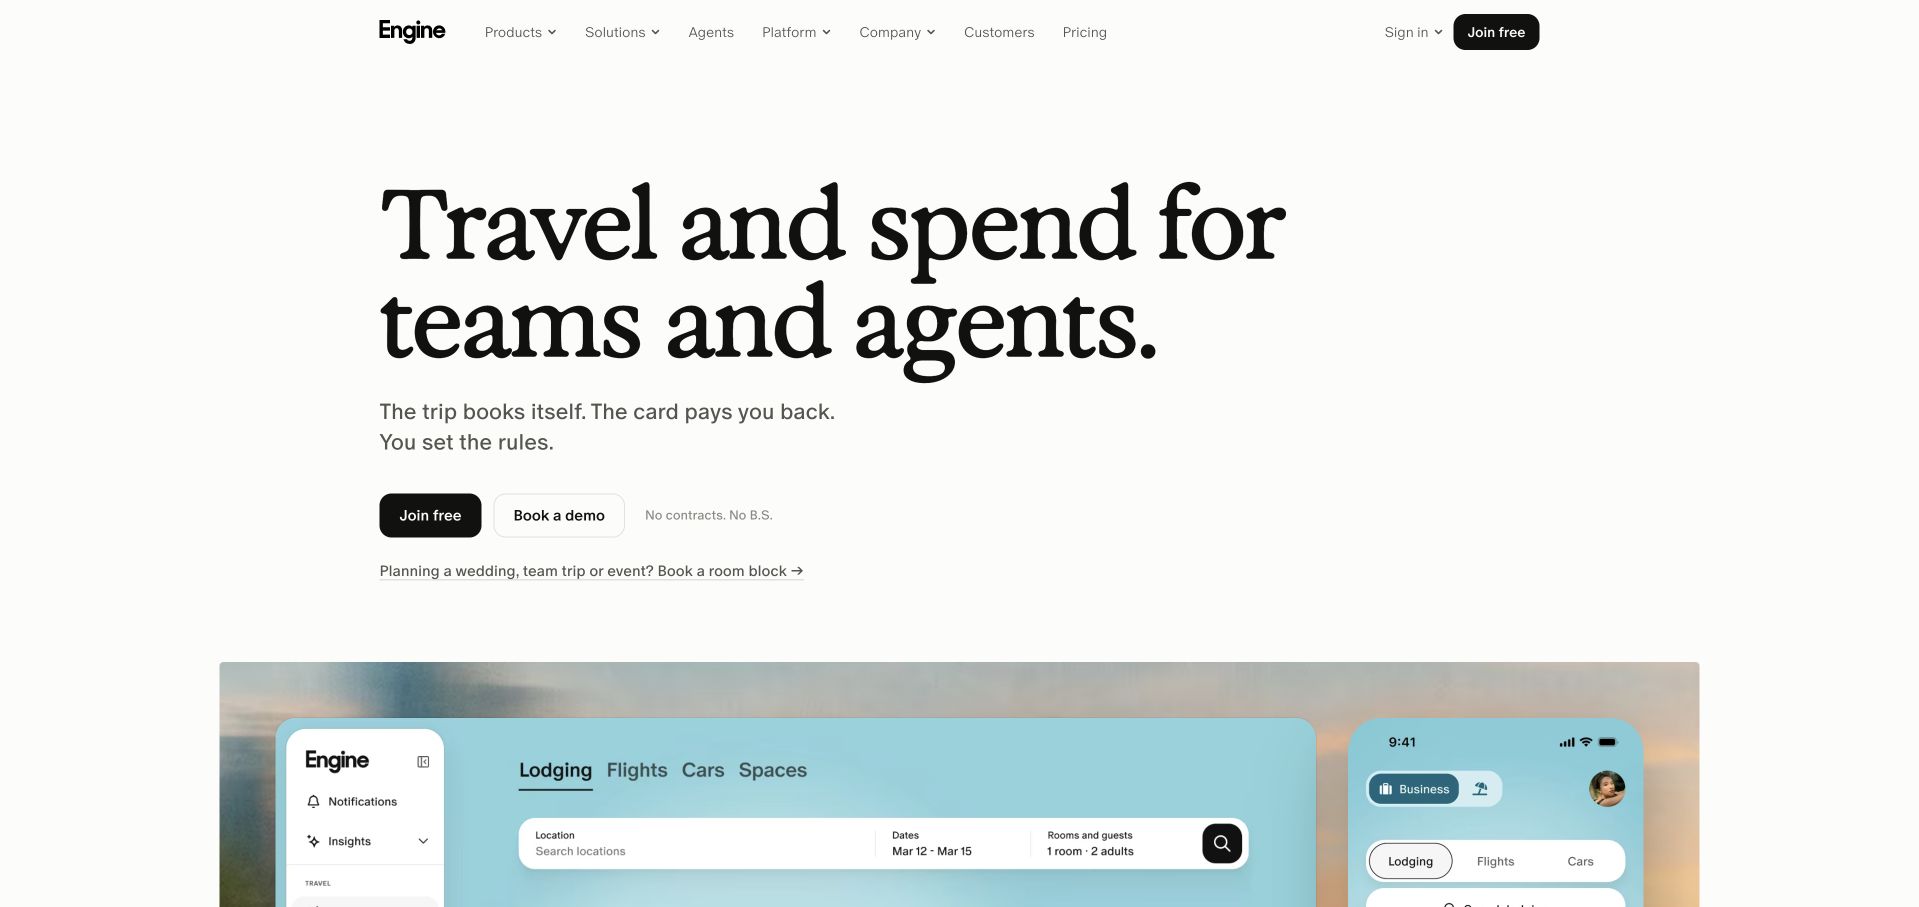
Engine pairs a large black serif headline with a pale product-interface panel in a spacious white layout. The inspected message names travel and spending, giving the reader a clear category before the page explores more detail. Free-start and demonstration routes acknowledge different levels of commitment, while the interface image makes the software tangible. The restrained palette leaves room for the type and product panel to do the explanatory work. Tableau’s case describes customer-experience and agent-performance reporting through Tableau Next and Agentforce. It is not evidence about the booking interface’s implementation or a guarantee of travel savings.
What you can learn
Name the practical category and show a believable interface near the proposition. Differentiate a self-service action from a sales-led demonstration, with clear expectations for each. Keep any promise about costs or operational improvement tied to evidence and scope rather than expecting a clean product illustration to establish a business result.
Pros
The interface panel gives the proposition a concrete software reference.
Distinct starting routes accommodate exploratory and higher-intent visitors.
Cons & considerations
Large serif headlines need controlled wrapping on small screens.
Commercial benefit claims require detail beyond the introductory design.
Visible tech stack
Earlier / documented evidence
Tableau
Platform source: Primary documented Tableau association. Documented association: Customer-experience analytics with Tableau Next; public booking marketing page is a separate surface. Platform evidence is separate from the direct website screenshot and is not a complete current infrastructure audit.
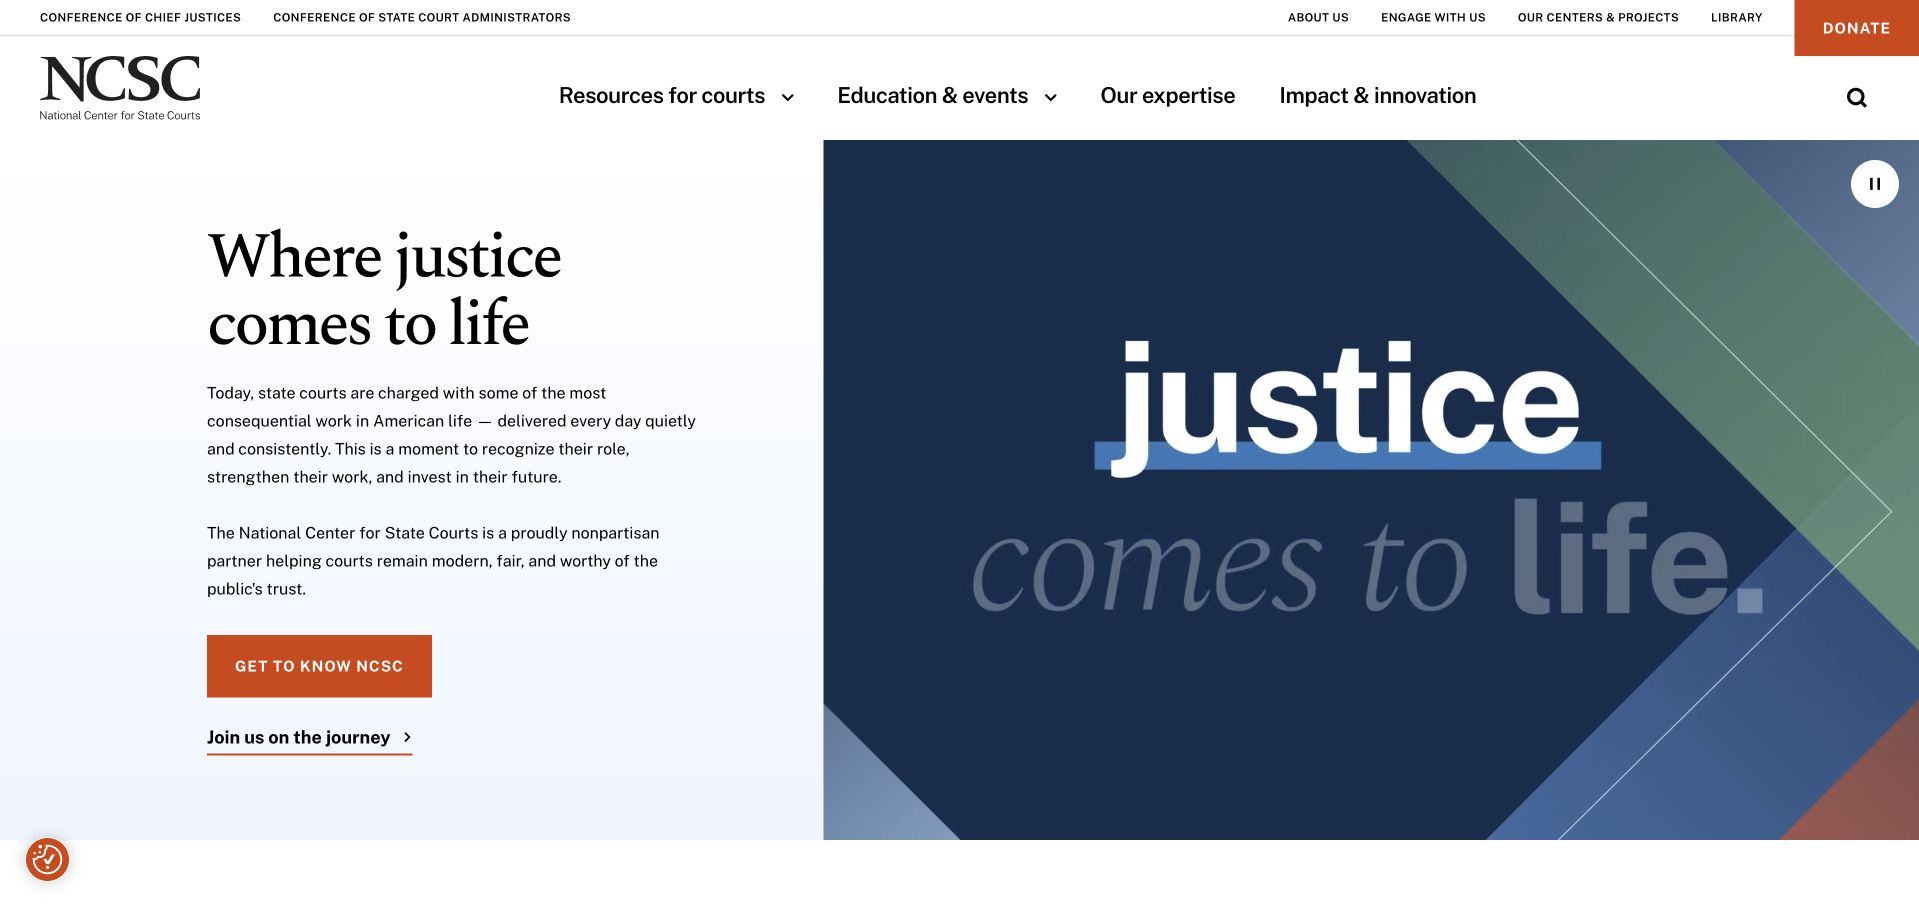
The National Center for State Courts uses navy and sky-blue tones around an illustrated justice-oriented opening. A large serif statement establishes the institutional subject, while an orange action provides a clear continuation. The navigation keeps court-related resources and organizational information available outside the main feature. This balance is useful for a public-interest body whose visitors may want a specific resource rather than a general mission statement. Tableau’s source documents data accessibility and analysis through Tableau Server. It does not establish the entire public-site CMS or independently verify the completeness of every court dataset.
What you can learn
Use a clear mission to orient new readers, then protect the resource routes used by practitioners and repeat visitors. A distinctive illustration can establish the subject without copying a generic courthouse photograph. Keep data methodology, dates and limitations available wherever readers move from an introductory story into substantive research or comparative figures.
Pros
A restrained blue palette gives the institutional message a coherent frame.
Resource navigation remains distinct from the lead editorial statement.
Cons & considerations
Large mission text should not displace high-frequency professional tasks.
Data-led material needs explicit methods and update information beyond the hero.
Platform source: Primary documented Tableau association. Documented association: Data accessibility and analysis via Tableau Server; not the entire public-site CMS. Platform evidence is separate from the direct website screenshot and is not a complete current infrastructure audit.
Ivy Tech Community College’s public page uses green and yellow branding around a welding scene and career-focused navigation. The practical setting makes the educational offer more tangible than a generic campus image would. Program discovery and audience routes carry much of the useful interaction, because applicants and current students need different information. The visual feature introduces the institution without trying to summarize every course. Tableau’s customer account describes institutional data culture using Tableau Cloud, including student-reporting context. It is separate from the public website’s implementation and should not be read as a guarantee of educational or employment outcomes.
What you can learn
Show a recognizable field of study, then make the path to programs and admissions concrete. Keep current-student tasks distinct from recruitment, and explain locations, delivery formats and requirements before asking someone to inquire. Practical imagery works best when the surrounding content helps visitors compare real options rather than only imagining a future career.
Pros
Trade-specific imagery makes the broad educational offer more concrete.
Program and audience routes support different stages of the student journey.
Cons & considerations
Career imagery should lead to precise program and location information.
Recruitment messaging must not obscure returning students’ practical tasks.
Platform source: Primary documented Tableau association. Documented association: Institutional data culture using Tableau Cloud; student/public site remains separately observed. Platform evidence is separate from the direct website screenshot and is not a complete current infrastructure audit.
Kegan has 15+ years of experience working with small businesses, Fortune 500 companies, and everything in between. No development job is too big or too small: he brings the same hands-on attention to a focused improvement, a complete website, or a custom application.
For Tableau projects, he can help with reporting requirements, data connections, metric definitions, embedded dashboards, access boundaries, validation, and maintainable handover. He works directly with clients on scope, design, implementation, testing, and handover, with an emphasis on clear communication and a system that remains practical to maintain after launch.
Show 3 other Tableau developersHide other Tableau developers
Choose a recurring decision, a small initial audience and a source that can be reconciled. Define the measure and its owner before building a large workbook. Keep the first dashboard understandable enough that a new team member can explain its purpose and the meaning of each major number.
An analytical feature in an existing application
Plan the host application and the embedded analytical surface together. Decide how users authenticate, what content they can reach and how the surrounding interface handles unavailable access. Review the appropriate Embedding API and connected-app documentation for the intended product and version rather than copying a token example without its context.
Inventory the existing views, their consumers and their definitions. Group reports by the decisions they support rather than by who happened to create them. Set a process for promoting reviewed outputs, retiring duplicates and announcing meaningful changes. A catalog becomes useful through clear ownership and context, not simply through having more thumbnails.
From references to requirements
Plan the reading experience, trust boundary and change process
Build a small analytical narrative with explicit definitions
Start with a question that can be answered in a sentence. Identify the measure, the relevant population and the time period. If the view compares locations, explain which locations are included and whether their data is comparable. If it describes a trend, decide how incomplete periods, corrections and missing observations appear. Write a worked example and reconcile it with the source before reviewing colors or chart types.
Organize the first view around the reader’s sequence of understanding. Give them an overview, a useful comparison and a route into relevant detail. Do not make every chart equally large merely because they fit a grid. Keep the reporting period and active filters visible. Use descriptive labels rather than unexplained internal field names. A reader should be able to explain what the view says without knowing how its workbook was assembled.
Review the design with someone who did not build it. Ask them to interpret the main result and identify what they would do next. If they reach a different conclusion from the intended one, investigate the wording, comparison and context rather than assuming that more training will solve the problem. Preserve their questions as part of acceptance: they often reveal ambiguities that a technically correct visualization hides.
Choose an embedding and data-security design deliberately
Map the host application, Tableau deployment and source data before choosing an authentication example. Confirm the actual product and version. Tableau’s connected-app documentation describes explicit trust relationships and notes that Tableau connected apps differ from Salesforce connected apps. Those names should not be treated as interchangeable configuration objects. Keep privileged signing material on the server and review the current supported authentication method with the implementation owner.
Decide which data each audience may see, then evaluate the appropriate row-level security approach. Tableau documents several options, including database enforcement and policies on virtual connections where available. Workbook-level user-filter approaches also require careful permission design. Do not assume that hiding a control or preselecting a filter prevents access to other records. Review download and editing capabilities as part of the same boundary.
Test with users who should receive different results and with a user who should receive no access. Include expired sessions and account changes in the test plan. The application needs an understandable response when a report cannot load, without exposing sensitive diagnostic detail. Keep a record of who owns authentication, content permissions and data entitlements so an incident does not fall between three teams with no clear decision-maker.
Treat publication as the start of a maintained service
Test representative data volumes and the filter combinations people will actually use. Include empty results, long labels and a deliberately broad reporting period. A development workbook that performs well on a tiny sample may behave differently with operational data. Record a useful baseline so future maintainers can distinguish a source problem, a modeling change and an interface regression.
Check the experience in the space where it will be used. A dashboard designed for a large monitor may be difficult inside a narrow application column. Review keyboard navigation, text alternatives, focus behavior and the use of color. Provide definitions and a way to reach supporting information without depending on a mouse hover. An analytical surface should remain understandable to someone who cannot see every decorative or interactive detail.
The handoff needs more than a workbook file. Include source dependencies, definitions, access decisions, expected refresh behavior and recovery instructions. Name the person who can pause a report when its data is unreliable and the person who approves a changed definition. Preserve a small set of known results for future checks. A maintained dashboard is one whose purpose and limits remain understandable after the original author has moved to another project.
A useful handover demonstration
Ask the actual team to carry out its routine job: publish a realistic update, correct a mistake, preview a narrow screen, and identify who owns an integration failure. For a library or frontend framework, also ask who maintains the content source and deployment. A polished screenshot does not answer those operational questions.
Beyond the screenshot
Tableau project planning checklist
Name the decision and primary audience for the first view.
Define measures, populations, periods and exclusions.
Reconcile a small worked example with the source.
Keep active filters and freshness information visible.
Confirm the actual Tableau product and deployment version.
Choose the supported embedding and authentication approach.
Keep signing material and privileged credentials server-side.
Design data entitlements independently from visual filter defaults.
Test different permitted users, denied access and expired sessions.
Review editing, download and export capabilities.
Test realistic data, narrow layouts and keyboard navigation.
Document change, publication, incident and recovery owners.
Test with real content, a keyboard, a small screen, slow or failed requests, and the people who will maintain the system. These are planning checks, not an accessibility, security, performance, or search-ranking certification.
Sources & editorial method
How this Tableau collection was reviewed
Twenty public interfaces were independently inspected and paired with checked Tableau documentary associations. Historical, regional and product-specific limits are retained. The planning recommendations are original guidance rather than promised performance improvements or a complete audit of any organization’s infrastructure.
Every image is an unmodified capture from the actual website, with its source and capture date. Some captures are reused from our shared catalog; their dates remain the original capture dates. None comes from a vendor gallery or a generated reconstruction. Moving imagery and live content can change.
Technology attribution uses public page assets or metadata, official platform documentation, or a cited first-party project case study. Documentary and framework-relationship evidence is identified where used; it is not a complete current backend inventory. A CMS image CDN alone does not establish a full CMS deployment. A library’s presence does not prove which individual controls use it, and a platform label does not establish AI authorship.
The composition notes, lessons, pros and tradeoffs are original editorial observations. We have not measured conversion, traffic, security, performance or accessibility conformance. Website owners retain their brands and imagery; these examples are not our client portfolio. Written, Edited and Curated are independent records, not dates advanced by a build. See our editorial standards or suggest a correction.
Questions worth asking
Tableau website development FAQs
Are all these public pages rendered by Tableau?
No. They are public design references paired with scoped analytics cases. The sources do not establish the marketing frontend, and some concern a historical deployment, a region or a department rather than the whole organization.
Can we apply a Server customer case directly to Tableau Next?
Not without checking the actual product and requirements. Product names, authentication arrangements and available features differ. Use a customer case as context and current documentation for the intended implementation.
Does a selected filter establish row-level security?
No. Design and test the data-access boundary explicitly. Review the appropriate security approach and related permissions, including whether users can edit or download material in a way that changes the intended restriction.
What makes a dashboard useful beyond attractive charts?
Clear definitions, a relevant comparison and a readable decision path. A reader should understand the population, period and limits, then know where to find detail or report a discrepancy.
What should another maintainer receive?
Provide the source map, definitions, access decisions, expected results, refresh behavior and recovery process. Name the owners of publication and changes so future work does not silently alter the meaning or exposure of the data.
Begin with one explainable question and a deliberate access boundary. Expand the collection when readers trust the definitions and maintainers can support the experience.