Best Datadog Websites of 2026 (20 Real-World Examples)
Datadog-associated websites, clear public journeys, and a practical observability brief
These 20 public website examples are connected to scoped official Datadog evidence. Most sources describe engineering monitoring rather than the pictured homepage. Several references are explicitly historical, and a customer association does not establish browser instrumentation, complete coverage or current performance.
A website can look convincing while an important task fails behind it. Observability planning starts with the service behavior the team needs to understand: a search that does not return, an application request that errors or a deployment that changes a journey. The goal is not a dashboard full of attractive charts; it is enough reliable context for the responsible person to investigate a real problem.
PayPal, Toyota, Autodesk, Forbes and Porsche Informatik open the collection as recognizable organizations with individual official Datadog material. Their monitoring relationships do not establish the stack of each photographed page. Historical Airbnb, Peloton, Washington Post and other resources retain their original context. Picnic is a directory-only historical reference because the company article linked from Datadog is now unavailable.
Before the examples
What makes good Datadog website development in 2026?
Start with one important journey and an owner
Choose a task the service must support and describe what successful completion means. Identify which team can investigate it and which systems are involved. A homepage screenshot cannot supply that service map. Begin with a small number of useful questions rather than collecting every possible signal without knowing who will use it.
Separate browser experience from backend visibility
Datadog’s Browser SDK documents real-user monitoring for page performance, resources, actions and errors. That is a different observation layer from a company’s general engineering case study. Record whether the project needs browser, application or infrastructure signals and how they relate. Do not assume a browser script proves complete backend coverage, or that a backend case proves a script on the public page.
A quiet chart can mean healthy behavior, infrequent events or a broken collection path. Datadog’s sparse-metrics guidance explains why monitor settings and evaluation periods must fit the expected data. In the brief, state what silence means for this specific task and who should investigate it. Avoid turning every empty result into an automatic success signal.
Study the public task structure and read the monitoring association separately. These reviews do not benchmark performance or inspect private dashboards. Each attribution names the relevant workload, testimonial or dated resource instead of expanding a recognizable customer name into a whole-stack claim.
We start with five recognizable brands or organizations: PayPal, Toyota, Autodesk, Forbes, Porsche Informatik. Each attribution applies to the named website property, not every product or website belonging to its organization. This is a curated reading sequence, not a measured ranking.
PayPal uses a large centered seasonal headline above a photographic shopping scene, with a compact personal-versus-business choice near the introduction. The black-and-white header gives everyday tasks their own place rather than making the campaign the only way forward. A short action beneath the headline is easy to find because the surrounding composition is restrained. The page is useful for studying how a mature platform can promote a current theme while retaining familiar account and product navigation for people arriving with a practical task.
What you can learn
Measure the actual user journey rather than treating a polished first screen as evidence of reliability. Datadog’s PayPal case documents engineering observability and service visibility. It does not independently establish transaction safety, financial suitability or the full implementation of the photographed consumer marketing page.
Pros
The central hierarchy keeps the current campaign readable without a dense feature inventory.
Personal and business choices acknowledge different service contexts before deeper navigation.
Cons & considerations
A seasonal message may not answer a returning visitor’s immediate operational question.
Consent notices need careful placement so they do not obscure the main campaign or tasks.
Platform source: PayPal — official Datadog association. PayPal engineering observability and unified service visibility. Official documentary association only. The named workload or listing is not proof that this public page runs on Datadog, nor a complete or independently tested current stack. Platform evidence is separate from the direct website screenshot and is not a complete current infrastructure audit.
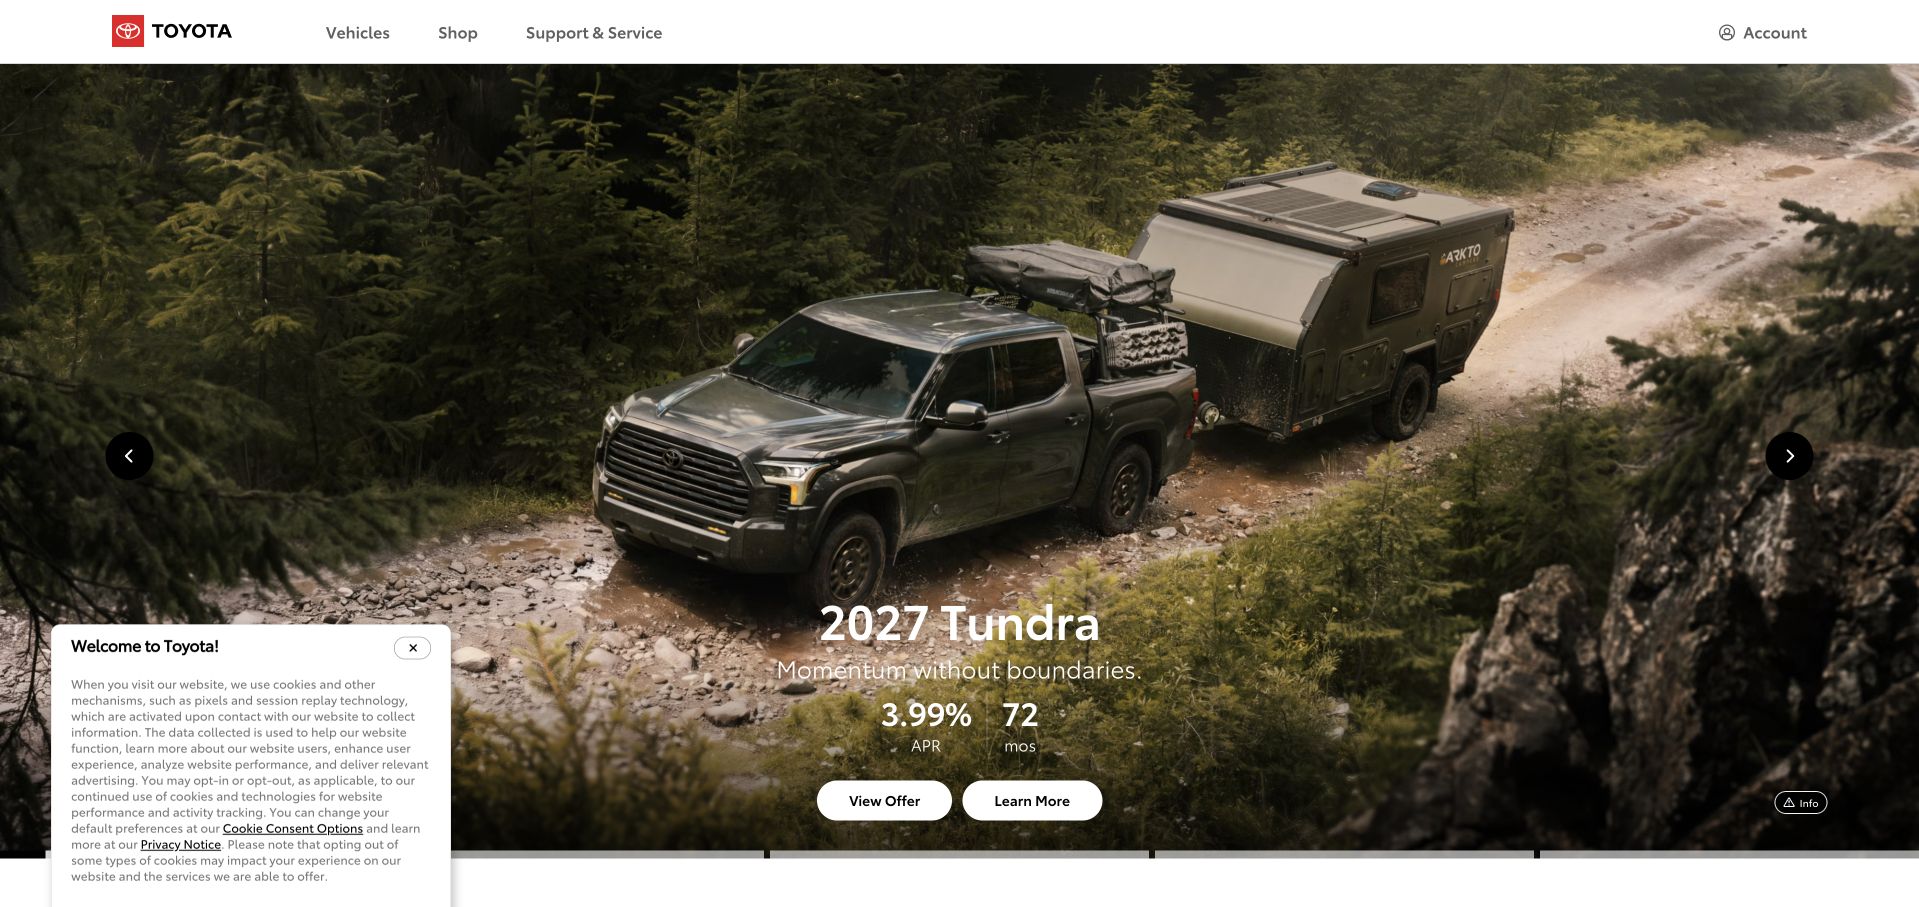
Toyota’s captured public homepage uses a large photograph of a pickup towing through an outdoor landscape. A compact model and offer panel sits near the bottom, while the white header reserves space for vehicles, shopping and ownership support. The scene explains the product’s intended context before the page moves into specification or comparison. This is a useful visual pattern for a broad catalog: the opening can show one compelling use case while permanent navigation protects routes for visitors interested in something else.
What you can learn
A visible campaign and an engineering monitoring relationship answer different questions. Datadog’s Toyota testimonial supports a scoped observability association. It does not prove that this exact homepage is instrumented with a particular browser SDK, nor identify every vehicle, dealer or customer-account system behind the brand.
Pros
The outdoor scene gives the featured vehicle a clear context rather than a neutral catalog backdrop.
Ownership support retains a permanent navigation route alongside shopping.
Cons & considerations
A single featured model can delay discovery for visitors seeking a different vehicle category.
Offer figures and conditions require readable detail beyond the image-led campaign.
Platform source: Toyota — official Datadog association. Toyota engineering monitoring as described in the Datadog customer testimonial. Official documentary association only. The named workload or listing is not proof that this public page runs on Datadog, nor a complete or independently tested current stack. Platform evidence is separate from the direct website screenshot and is not a complete current infrastructure audit.
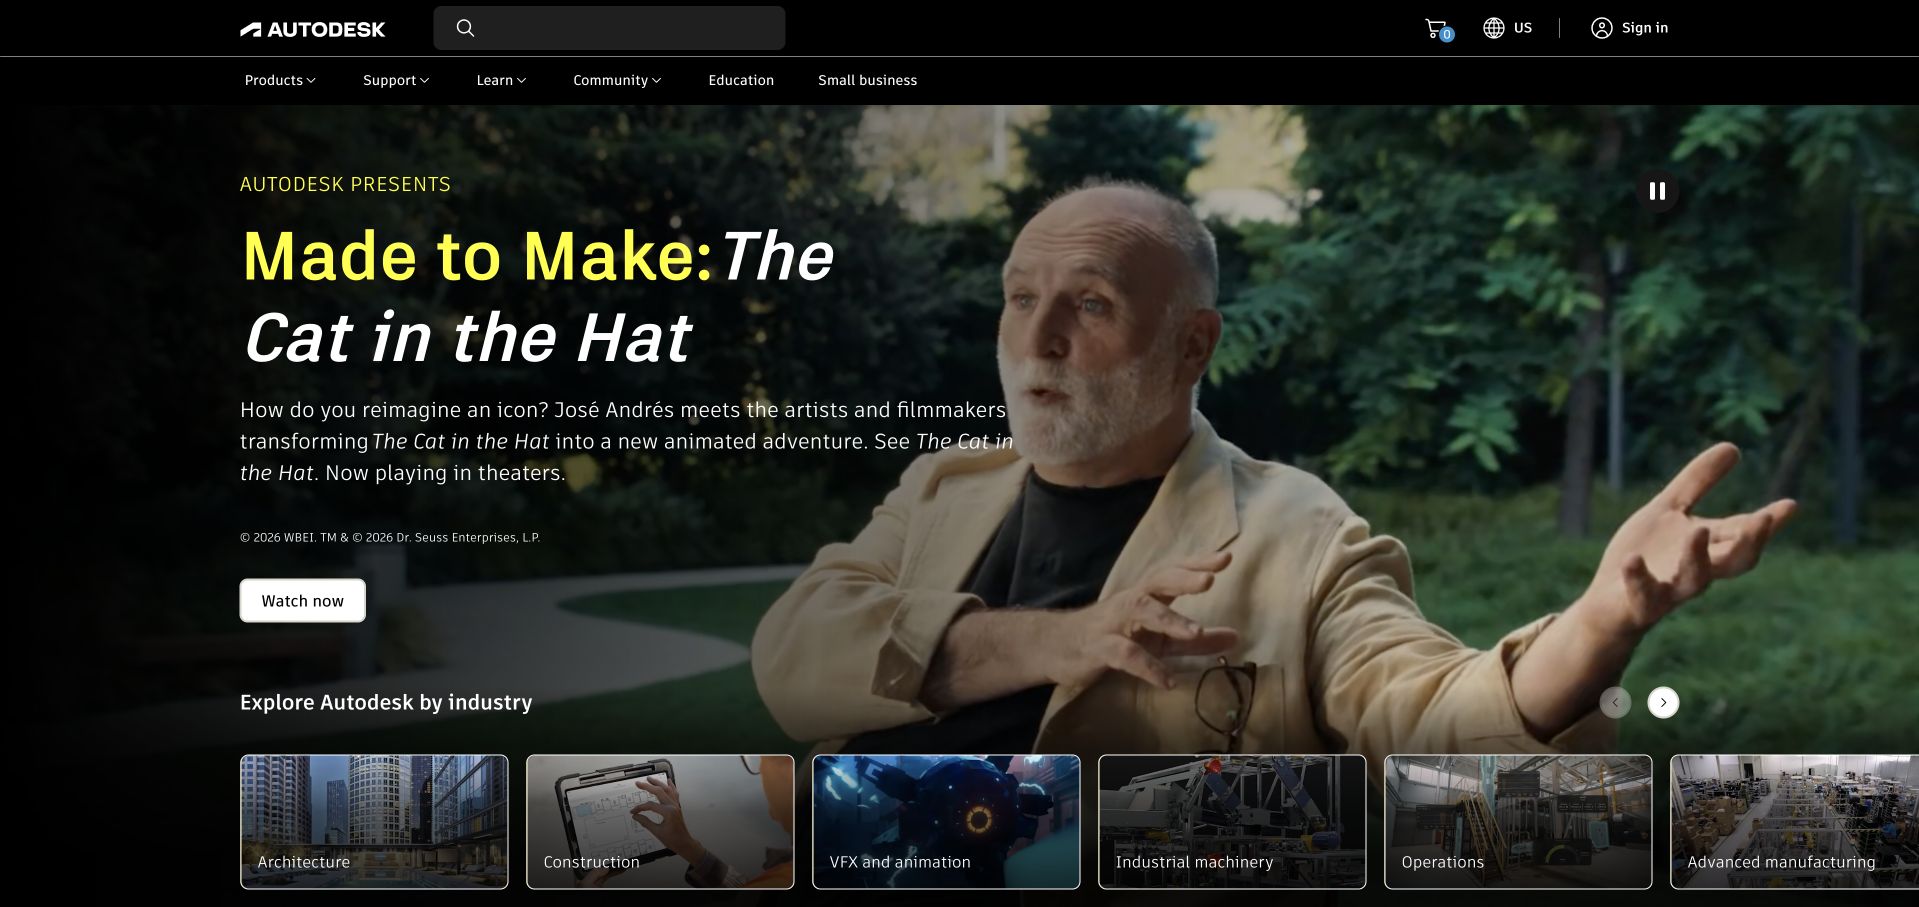
Autodesk uses a cinematic photograph and a large editorial title to introduce a creative-work story. A short explanation and a simple viewing action sit over the darker area of the image, while illustrated industry choices begin at the bottom of the hero. The navigation separates products, learning, community and support, acknowledging a relationship that extends beyond initial evaluation. It is an effective reference for making technical software feel connected to real creative output without turning the first screen into a crowded application comparison.
What you can learn
Let the story explain the work, then define which service must be monitored and why. Datadog’s Autodesk testimonial documents engineering observability. It does not establish the exact telemetry collected from this public page, every Autodesk application or the performance of a specific customer’s project.
Pros
A concrete creative story gives the broad software portfolio a memorable introduction.
Industry tiles offer useful direction after the campaign rather than requiring immediate product-name knowledge.
Cons & considerations
A cinematic hero needs a clear text alternative when video or imagery is unavailable.
Editorial storytelling can postpone product-selection information for a task-focused visitor.
Platform source: Autodesk — official Datadog association. Autodesk engineering observability as described in the Datadog testimonial. Official documentary association only. The named workload or listing is not proof that this public page runs on Datadog, nor a complete or independently tested current stack. Platform evidence is separate from the direct website screenshot and is not a complete current infrastructure audit.
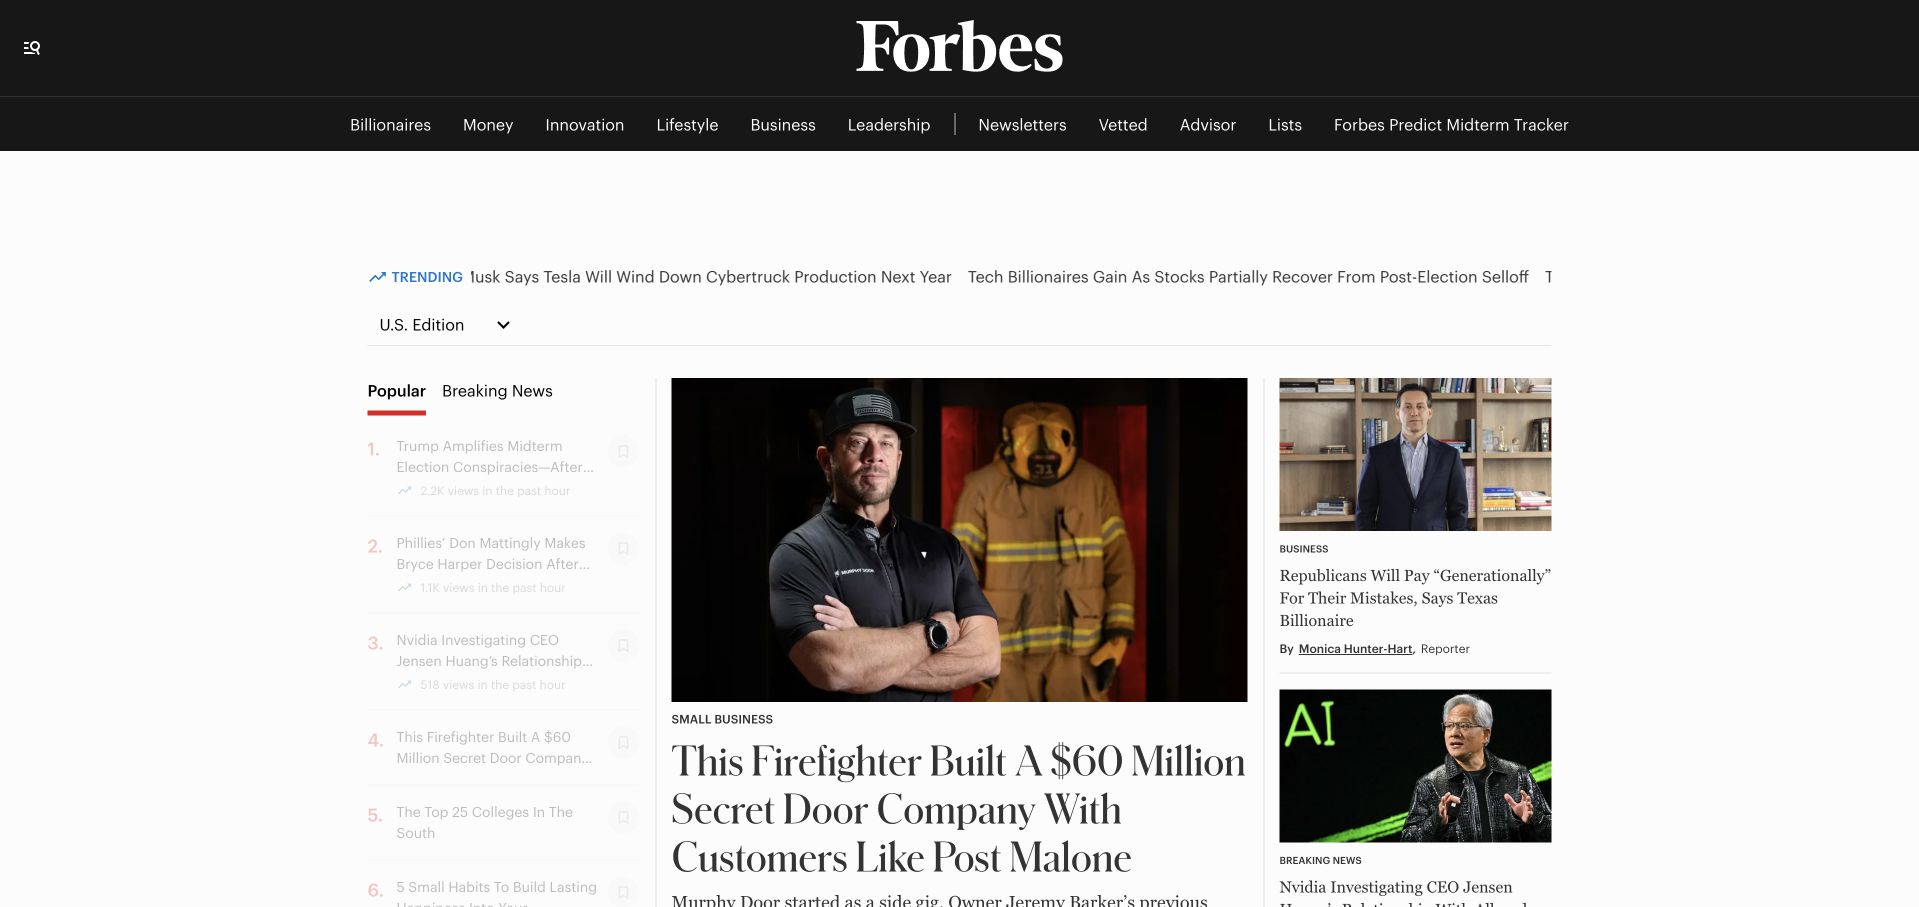
Forbes combines a large masthead, a dark topic bar and a white editorial grid. A prominent lead photograph and headline establish the main story, while smaller adjacent items and a popular-reading column give the page several degrees of emphasis. The composition demonstrates that a dense content property does not need equal-sized cards everywhere: hierarchy can be created through image size, column width and typography. The principal challenge is keeping that hierarchy stable as headlines, advertising and breaking news change.
What you can learn
Traffic monitoring is an operational concern separate from the editorial composition. Datadog’s Forbes testimonial establishes an engineering observability association. It does not identify every publishing component or independently verify page performance, editorial quality, readership figures or the exact monitoring installed on this captured public homepage.
Pros
The lead story, secondary items and popular-reading column have recognizably different visual priorities.
A strong masthead provides continuity above frequently changing editorial material.
Cons & considerations
Advertising and long headlines can disrupt a carefully balanced multi-column composition.
Dense topic navigation needs usable grouping and keyboard behavior on smaller screens.
Platform source: Forbes — official Datadog association. Forbes engineering observability; not proof of every publishing component. Official documentary association only. The named workload or listing is not proof that this public page runs on Datadog, nor a complete or independently tested current stack. Platform evidence is separate from the direct website screenshot and is not a complete current infrastructure audit.
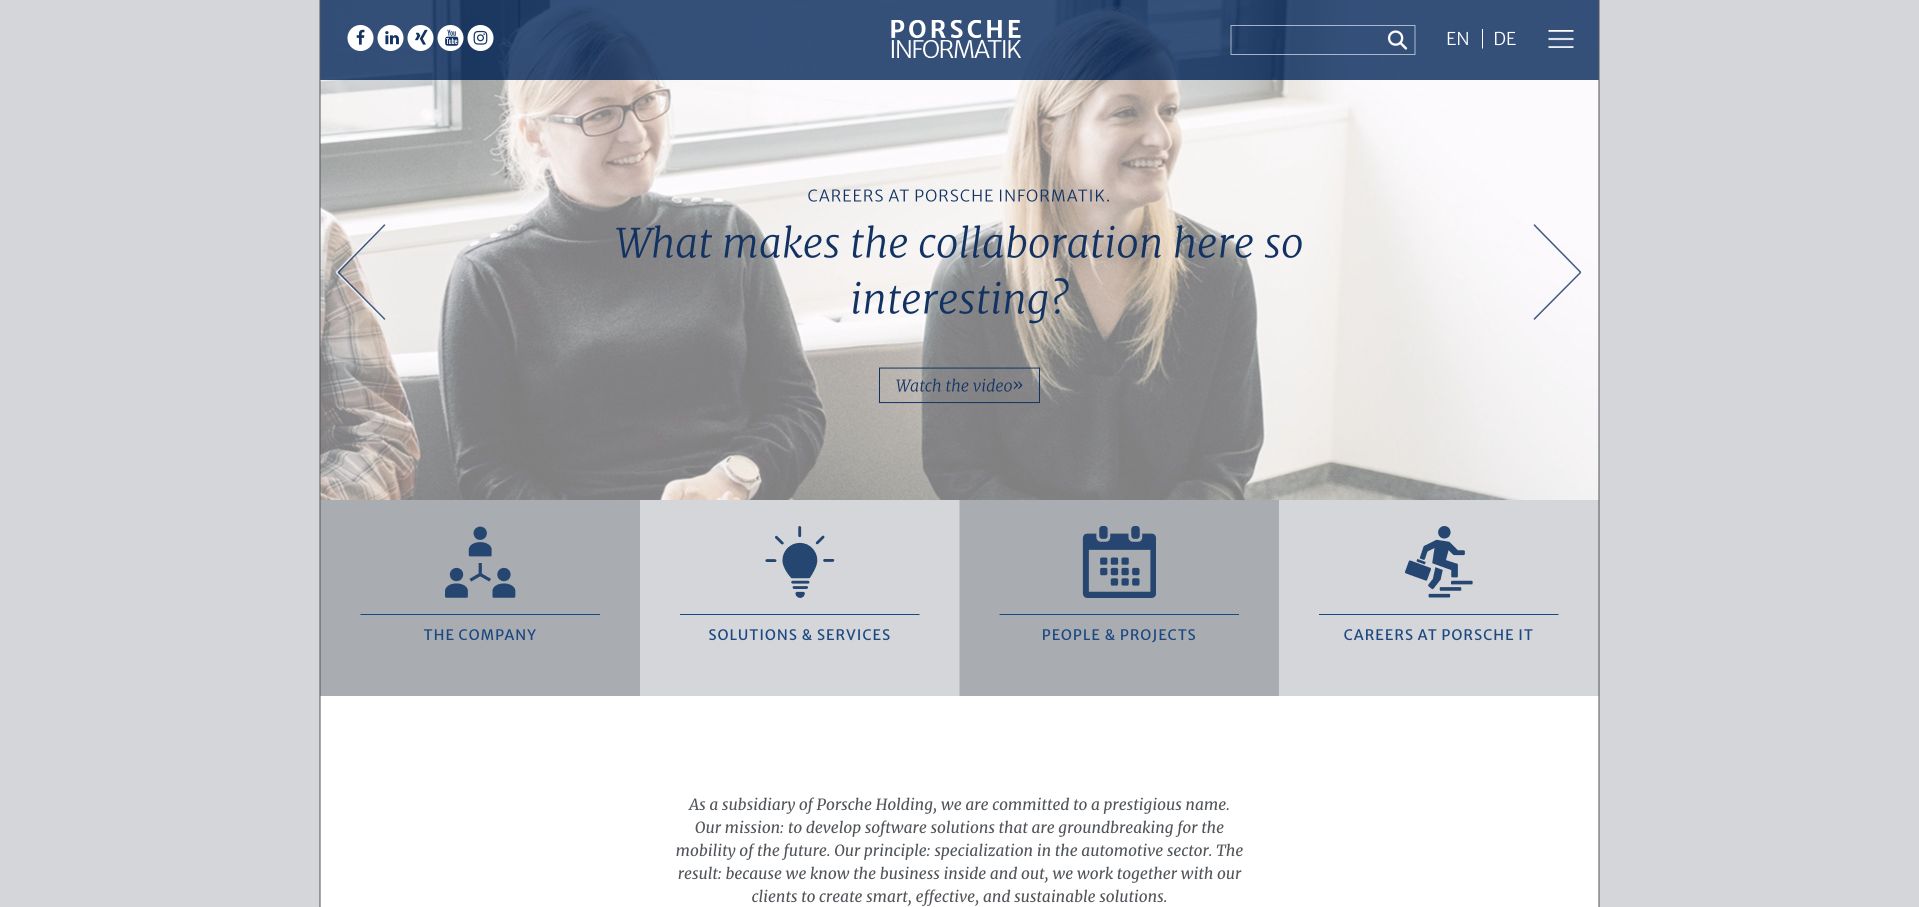
Porsche Informatik uses a centered corporate identity, a blue-toned opening scene and a concise statement about mobility. A row of large icon-led destinations follows the hero, separating the company, services, people and careers. The composition feels more institutional than a retail vehicle site, which is appropriate to the specific organization being shown. The useful lesson is the distinction: a familiar parent name can provide recognition while the page still needs to explain the subsidiary’s own work and intended audience.
What you can learn
Define the monitored organization and application precisely. Datadog’s case concerns Porsche Informatik software operations, not the complete worldwide Porsche website estate. The screenshot is this software company’s public page and should not be relabeled as a production architecture diagram or an independent reliability assessment.
Pros
Icon-led destination blocks give the institutional introduction a clear set of practical next steps.
The visual identity establishes the group relationship without copying a vehicle-shopping layout.
Cons & considerations
A broad mobility statement needs more specific software descriptions before an evaluator can assess fit.
Hero text over imagery requires careful contrast and comfortable reading sizes.
Platform source: Porsche Informatik — official Datadog association. Porsche Informatik software operations, not the complete Porsche global website stack. Official documentary association only. The named workload or listing is not proof that this public page runs on Datadog, nor a complete or independently tested current stack. Platform evidence is separate from the direct website screenshot and is not a complete current infrastructure audit.
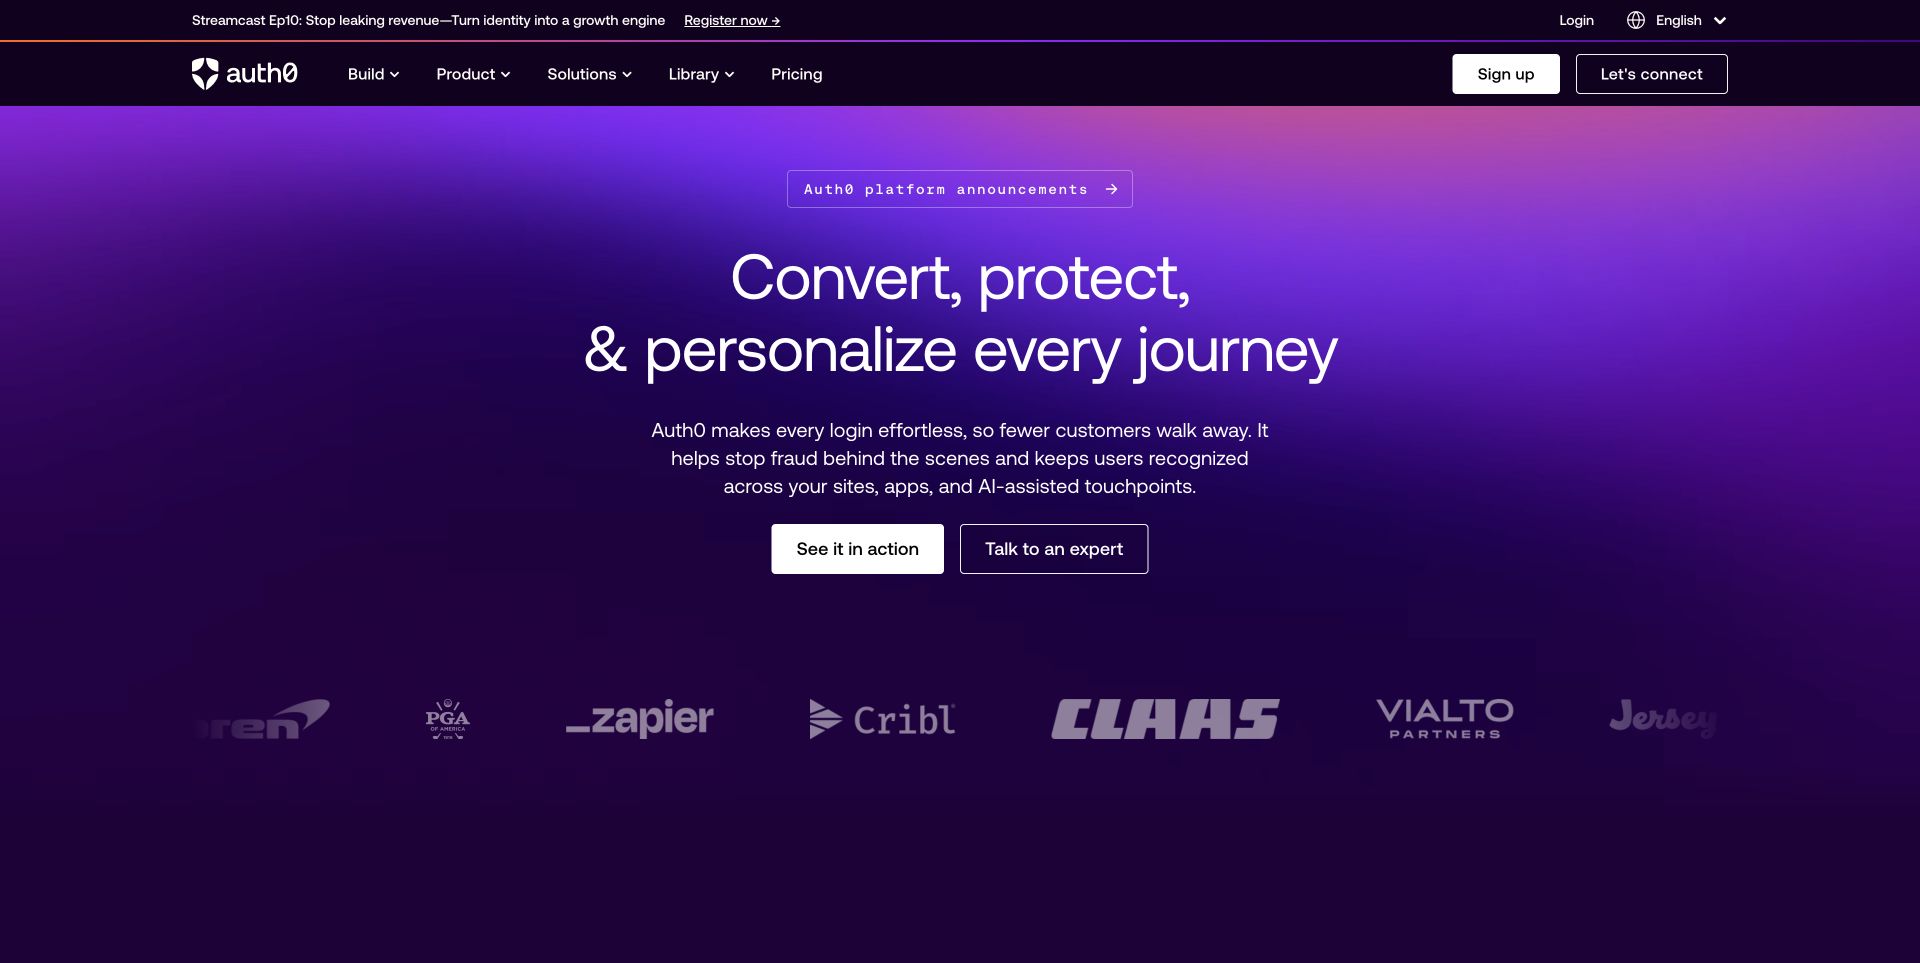
Auth0 uses a purple gradient to frame a centered proposition about customer journeys. Two contrasting evaluation actions sit beneath the supporting text, while a row of customer marks supplies a separate recognition layer. The dark navigation separates building, products, solutions and resources without forcing every detail into the main headline. The result is a coherent public introduction to an abstract technical category, although the deeper product pages still need to explain authentication, authorization and operating responsibility in much more concrete terms.
What you can learn
An infrastructure supplier also has its own services to operate. Datadog’s Auth0 case concerns service monitoring and engineering operations. That association is not a statement that Datadog provides Auth0 identity functions, validates every security claim or identifies the complete frontend stack of this public marketing page.
Pros
A consistent purple field gives an abstract product category a recognizable visual identity.
Customer marks are separated from the proposition rather than interrupting its explanation.
Cons & considerations
Broad journey language needs concrete account and API examples before implementation decisions.
Multiple technical audiences may need faster routes than a general platform introduction provides.
Platform source: Auth0 — official Datadog association. Auth0 service monitoring and engineering operations. Official documentary association only. The named workload or listing is not proof that this public page runs on Datadog, nor a complete or independently tested current stack. Platform evidence is separate from the direct website screenshot and is not a complete current infrastructure audit.
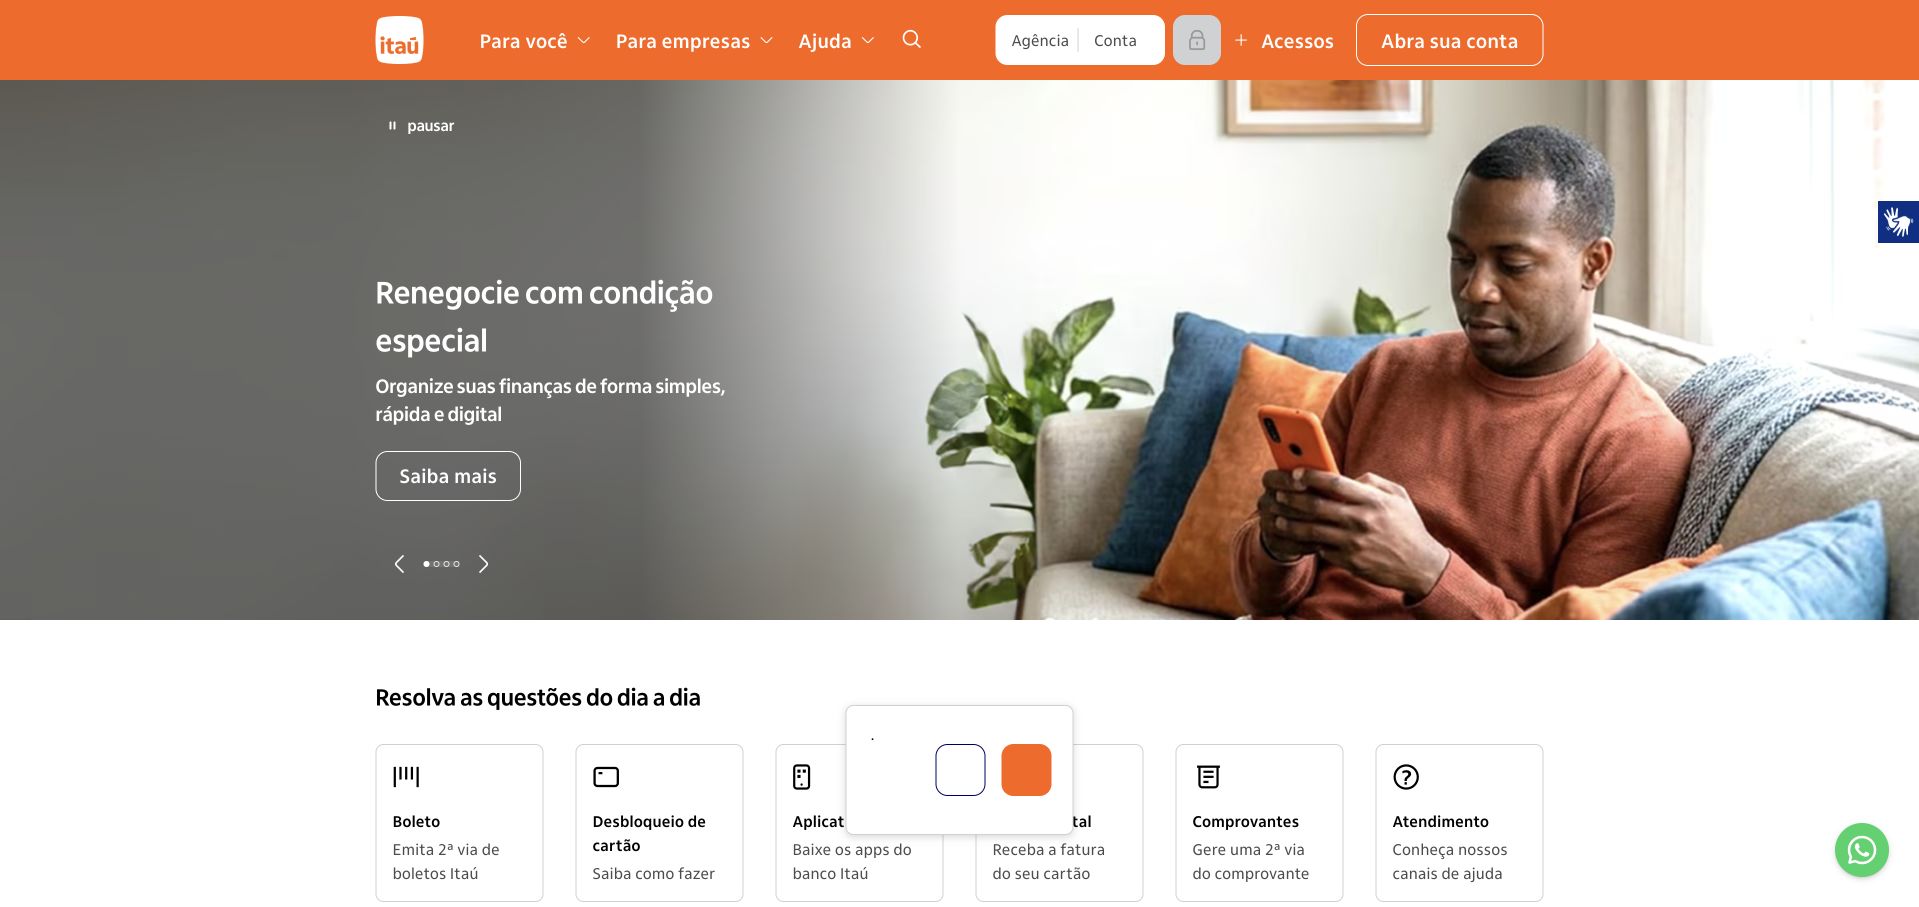
Itaú uses an orange header, a large everyday-life photograph and a short product message positioned in a darker area of the scene. Practical task cards begin directly below the hero, offering another entrance for visitors who are not interested in the current campaign. Account access and customer-type choices remain in the header rather than being absorbed into the photographic promotion. The composition shows how a strong brand color can connect promotional storytelling to routine service navigation across a large consumer financial property.
What you can learn
Observe important tasks rather than assuming the campaign represents every customer journey. Datadog documents technology observability at Itaú Unibanco. The case does not establish the current instrumentation of this public page, certify transaction safety or independently assess the suitability of the products being advertised.
Pros
Practical task cards provide an alternative to the changing campaign immediately below the hero.
Orange brand treatment connects the header to a diverse collection of consumer services.
Cons & considerations
Financial campaign messages need readable conditions and audience-specific explanations nearby.
A large product portfolio can make similar task labels difficult to distinguish without careful wording.
Visible tech stack
Earlier / documented evidence
Datadog
Platform source: Itaú Unibanco — official Datadog association. Itaú Unibanco technology observability. Official documentary association only. The named workload or listing is not proof that this public page runs on Datadog, nor a complete or independently tested current stack. Platform evidence is separate from the direct website screenshot and is not a complete current infrastructure audit.
SAS pairs a large globe illustration with a short research-led statement about trustworthy AI. A white canvas and deep blue accents give the introductory text room, while the main navigation keeps software, learning, support and partners visible. The image is symbolic rather than an application screenshot, so the supporting sentence and action carry much of the meaning. This is useful for a research-oriented campaign when the goal is to introduce an idea before leading visitors toward more detailed product or evidence material.
What you can learn
The public claim and the monitored software platform are different subjects. Datadog’s SAS case concerns software observability. It does not independently validate the campaign’s research findings, AI trustworthiness or the exact telemetry collected on this public page. Those claims require their own supporting evidence.
Pros
The white composition gives a research-oriented message a readable and deliberate hierarchy.
Learning and support remain visible beside sales-oriented software navigation.
Cons & considerations
A symbolic globe explains less about product behavior than a concrete workflow demonstration.
Research-led figures need accessible methodology and scope rather than only a prominent headline.
Visible tech stack
Earlier / documented evidence
Datadog
Platform source: SAS — official Datadog association. SAS software platform observability. Official documentary association only. The named workload or listing is not proof that this public page runs on Datadog, nor a complete or independently tested current stack. Platform evidence is separate from the direct website screenshot and is not a complete current infrastructure audit.
Cognizant uses an architectural city image overlaid with a digital geometric bridge to introduce its AI-services message. Large white typography and a turquoise action stand out against the darker scene. A row of editorial cards begins within the hero’s lower edge, providing more specific topics after the broad opening statement. The white header separates industries, services, insights and company information. The pattern is useful for a consultancy whose offer is too broad for one product screenshot but still needs concrete routes beyond its headline.
What you can learn
A consulting campaign is not an operational architecture description. Datadog’s Cognizant testimonial documents an observability association. It does not establish every customer implementation, validate AI outcomes or identify the full monitoring and publishing systems behind this captured corporate page.
Pros
The overlapping editorial cards offer specific follow-on topics after the broad service message.
A bright turquoise action stays distinct from the dark architectural imagery.
Cons & considerations
A broad AI-builder proposition needs evidence of precise services and delivery boundaries.
Cookie notices and overlapping cards can compete for space at the bottom of the first screen.
Platform source: Cognizant — official Datadog association. Cognizant engineering observability as described in the testimonial. Official documentary association only. The named workload or listing is not proof that this public page runs on Datadog, nor a complete or independently tested current stack. Platform evidence is separate from the direct website screenshot and is not a complete current infrastructure audit.
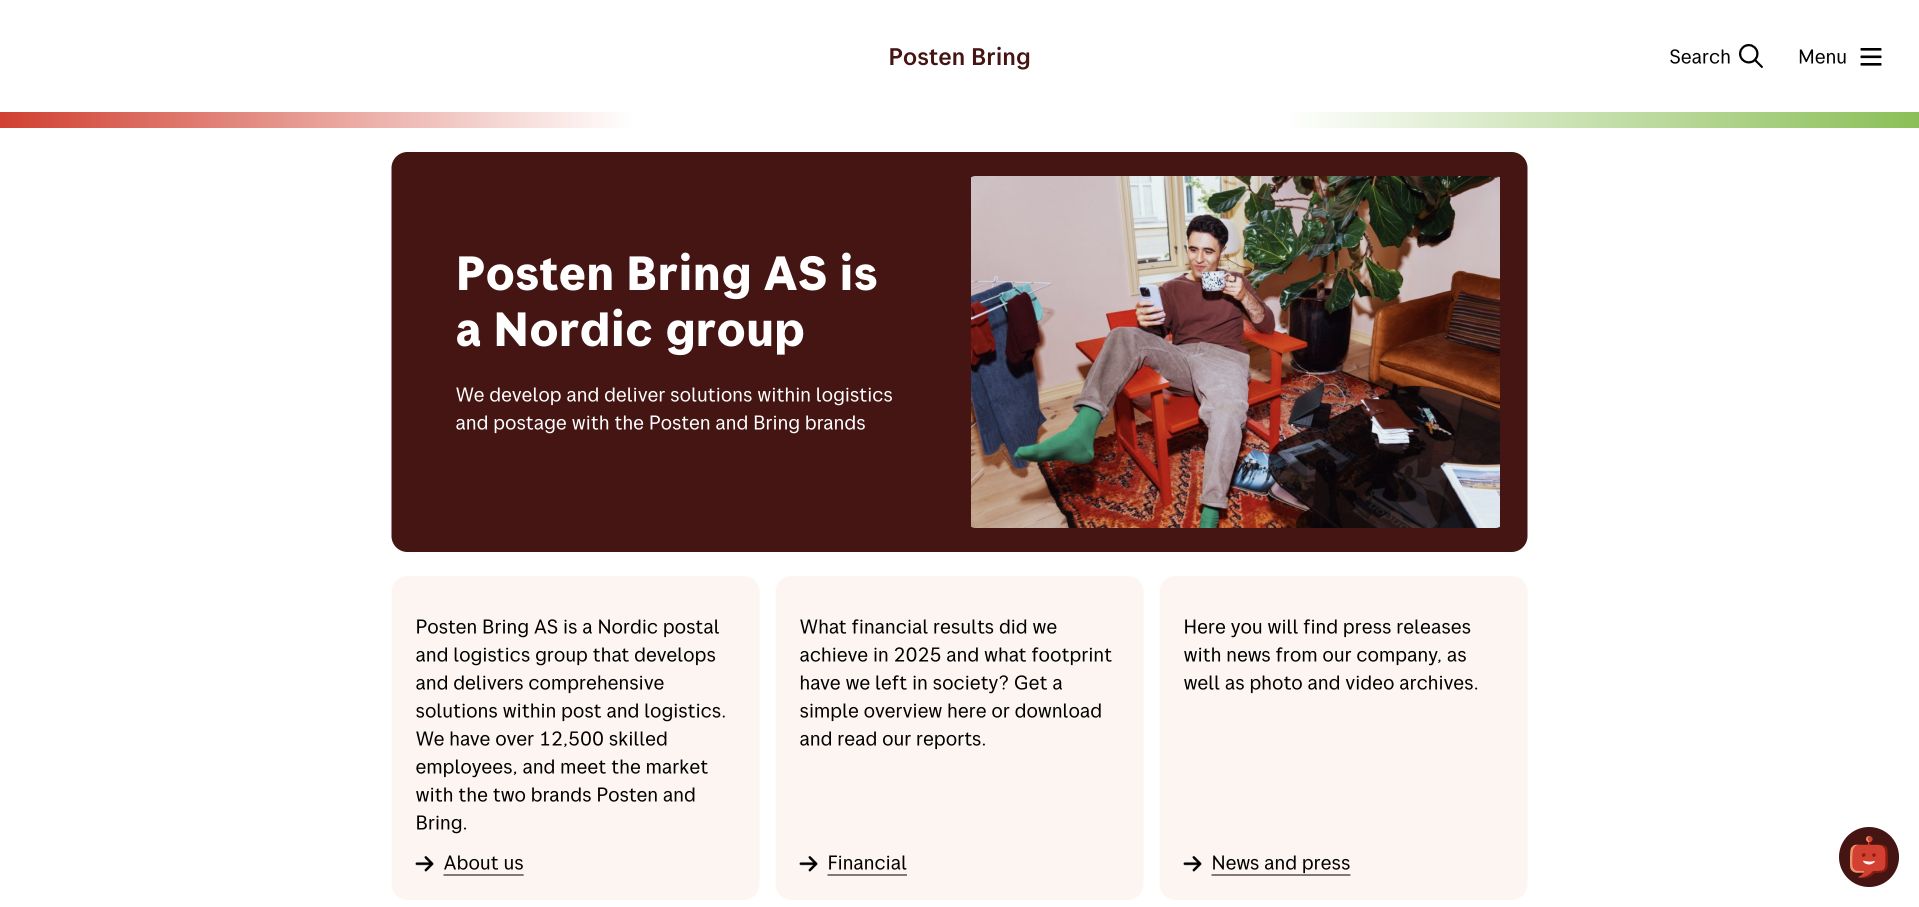
Posten Bring uses a warm-toned hero panel beside a photograph of a delivery interaction. The short introduction identifies the Nordic group and its logistics context, while three text cards below provide organizational information, results and news. The white header is notably restrained, with search and a compact menu rather than a wide catalog. This composition is useful for a corporate site whose purpose is different from a consumer tracking tool: it explains the organization without pretending to be the place for every shipment task.
What you can learn
Choose the public page and the monitored workload deliberately. Datadog’s Posten Bring case concerns logistics engineering monitoring. It does not mean that every tracking system, subsidiary service or this corporate introduction shares one monitoring configuration or complete application stack.
Pros
The delivery photograph gives a corporate introduction a recognizable operational setting.
Three clear text cards provide useful routes without creating a dense navigation tree.
Cons & considerations
A corporate-first entrance may not satisfy a visitor who expects immediate parcel tracking.
A compact menu needs strong labels so important organizational information remains discoverable.
Platform source: Posten Bring — official Datadog association. Posten Bring logistics engineering monitoring. Official documentary association only. The named workload or listing is not proof that this public page runs on Datadog, nor a complete or independently tested current stack. Platform evidence is separate from the direct website screenshot and is not a complete current infrastructure audit.
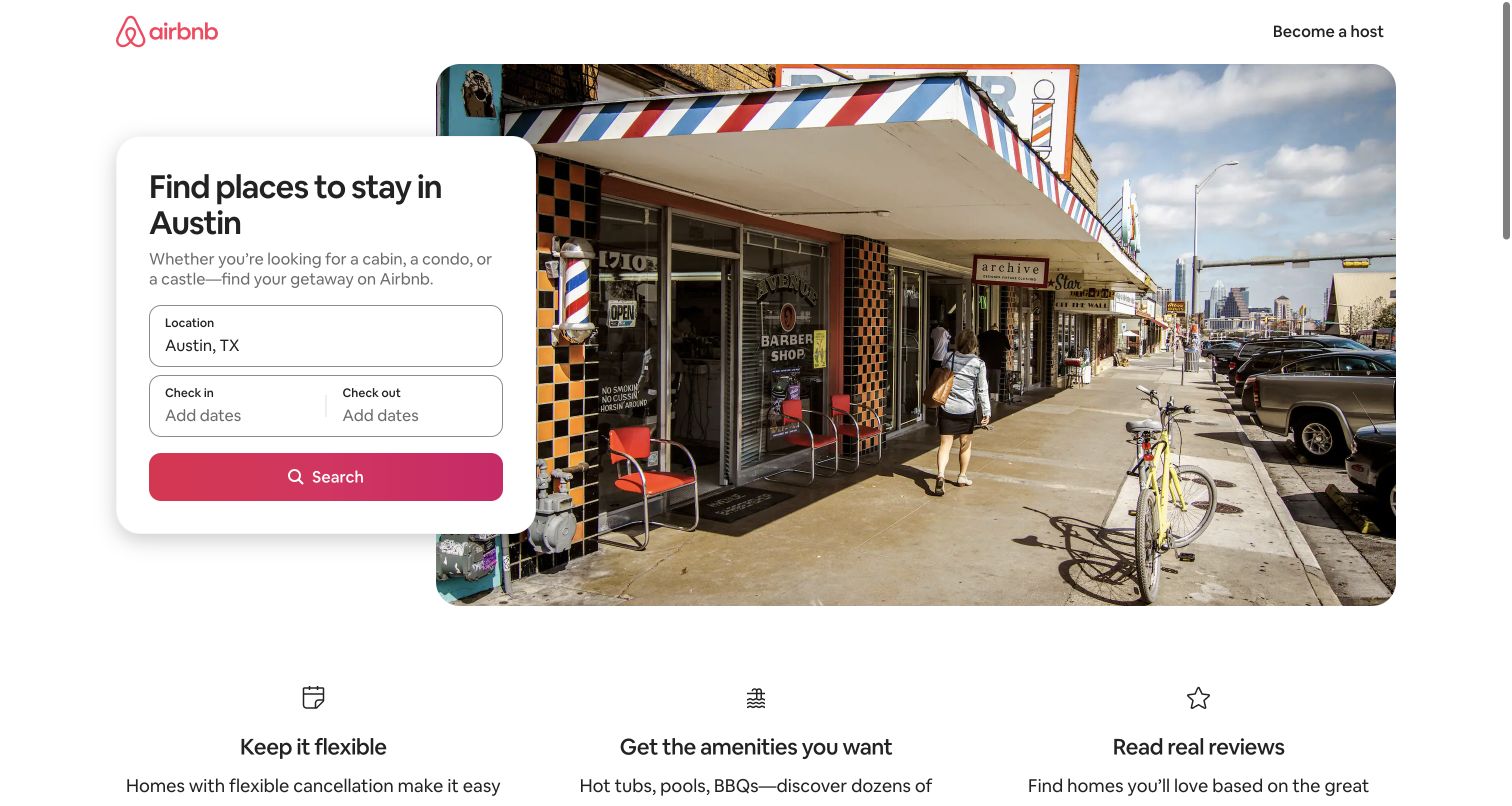
Airbnb’s Austin landing page places a compact accommodation-search card over a city photograph. The card identifies the location, offers date fields and supplies one strong search control. Three benefit summaries below explain flexibility, amenities and reviews, giving the page a clear continuation without a long corporate introduction. The design demonstrates how a large platform can build a focused destination entrance: the image supplies local context, but the form still names the practical decision the visitor is being asked to make.
What you can learn
Keep the date and scope of technical evidence visible. Datadog’s Airbnb alerting talk is from 2016, not a fresh audit of this destination page. It documents historical monitoring practice and should not be expanded into a claim about Airbnb’s entire current technology estate.
Pros
The location-specific form connects a local visual story to a clearly defined search task.
Short benefit summaries explain the browsing proposition without competing with the main action.
Cons & considerations
A scenic introduction cannot communicate the conditions of individual accommodation listings.
Historical engineering material is useful context but cannot establish current production instrumentation.
Platform source: Airbnb — official Datadog association. Historical 2016 Airbnb monitoring and alerting talk; not a current whole-stack audit. Official documentary association only. The named workload or listing is not proof that this public page runs on Datadog, nor a complete or independently tested current stack. Platform evidence is separate from the direct website screenshot and is not a complete current infrastructure audit.
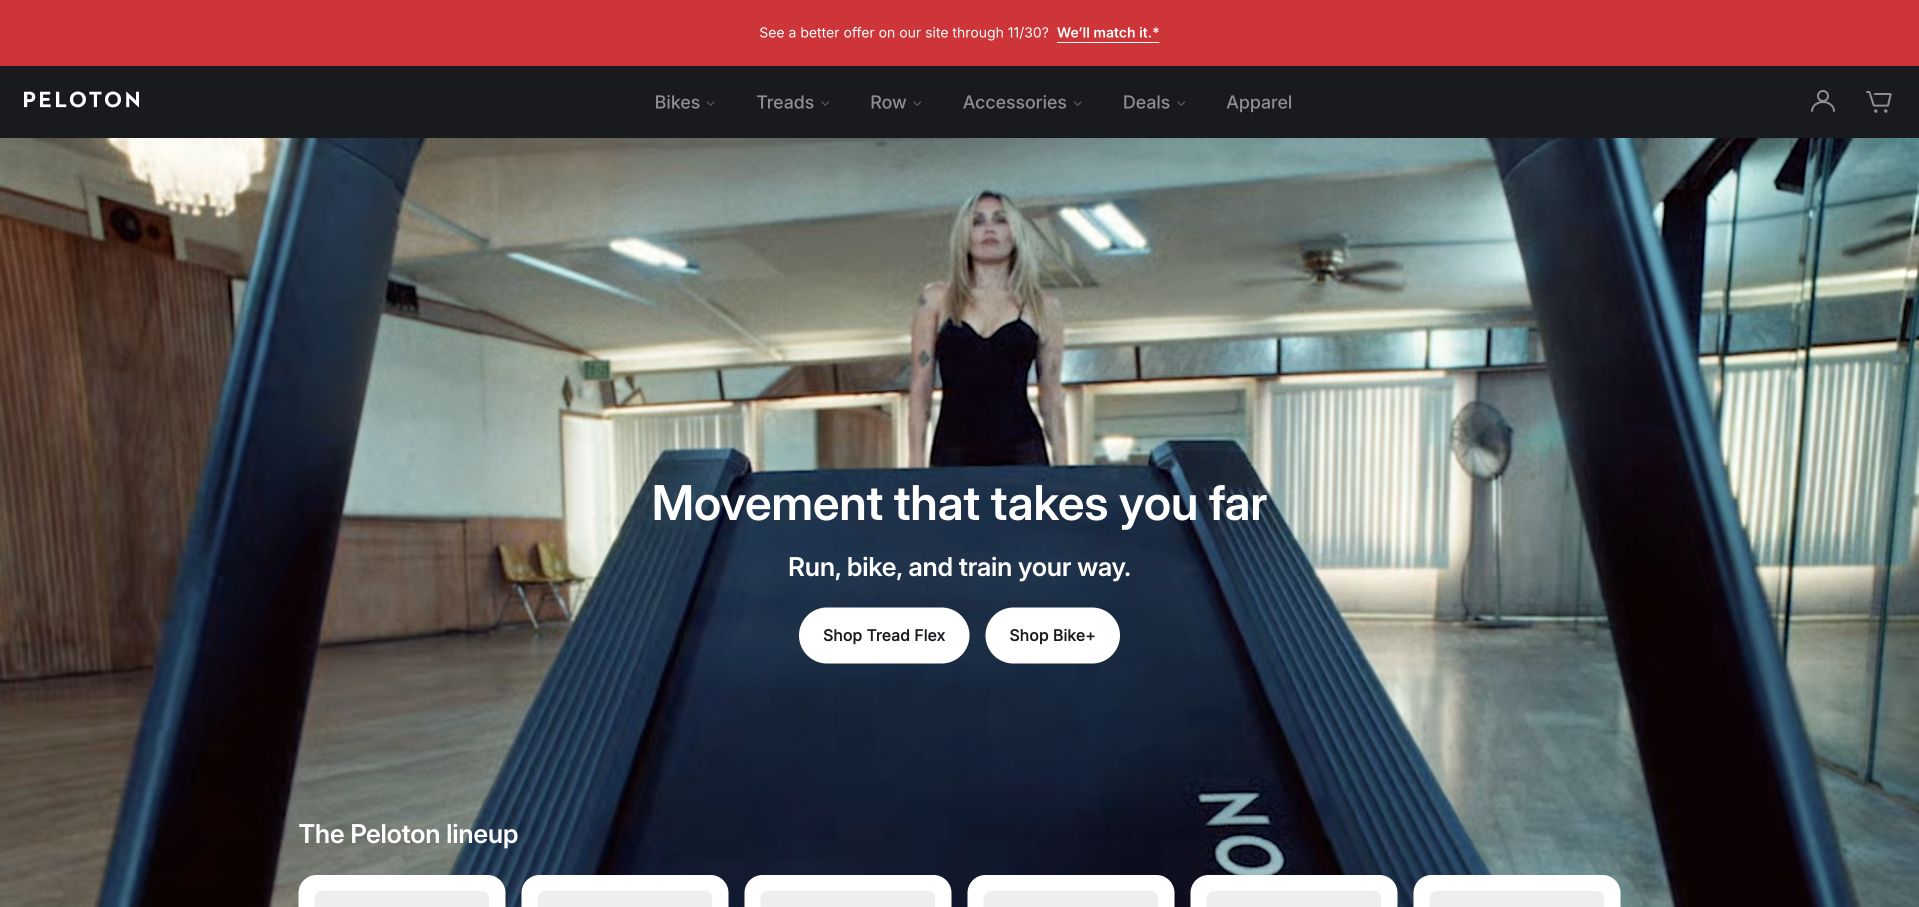
Peloton’s captured page uses a full-width training scene with a compact central message and separate equipment-shopping actions. A dark header keeps product families readable, and a brighter promotional strip carries the current offer above it. The composition ties the brand to the activity rather than beginning with a specification list. Product-line cards start below the hero, so the cinematic opening has a practical continuation for someone comparing equipment rather than merely watching the campaign.
What you can learn
The visible hardware campaign and historical application monitoring are different subjects. Datadog’s resources directory dates Peloton real-time APM material to July 2017. That source is not a present-day audit of the public page, connected equipment or subscription platform, and the review makes no performance or fitness-outcome guarantee.
Pros
Training photography demonstrates the activity and equipment in a recognizable setting.
Separate equipment actions provide more direction than a single generic shop control.
Cons & considerations
A promotional strip adds another decision layer before the permanent product navigation.
Hardware and membership conditions need clear detail beyond the cinematic introductory scene.
Platform source: Peloton — official Datadog association. Historical July 31, 2017 Peloton real-time APM monitoring material in the official Datadog resources directory. Official documentary association only. The named workload or listing is not proof that this public page runs on Datadog, nor a complete or independently tested current stack. Platform evidence is separate from the direct website screenshot and is not a complete current infrastructure audit.
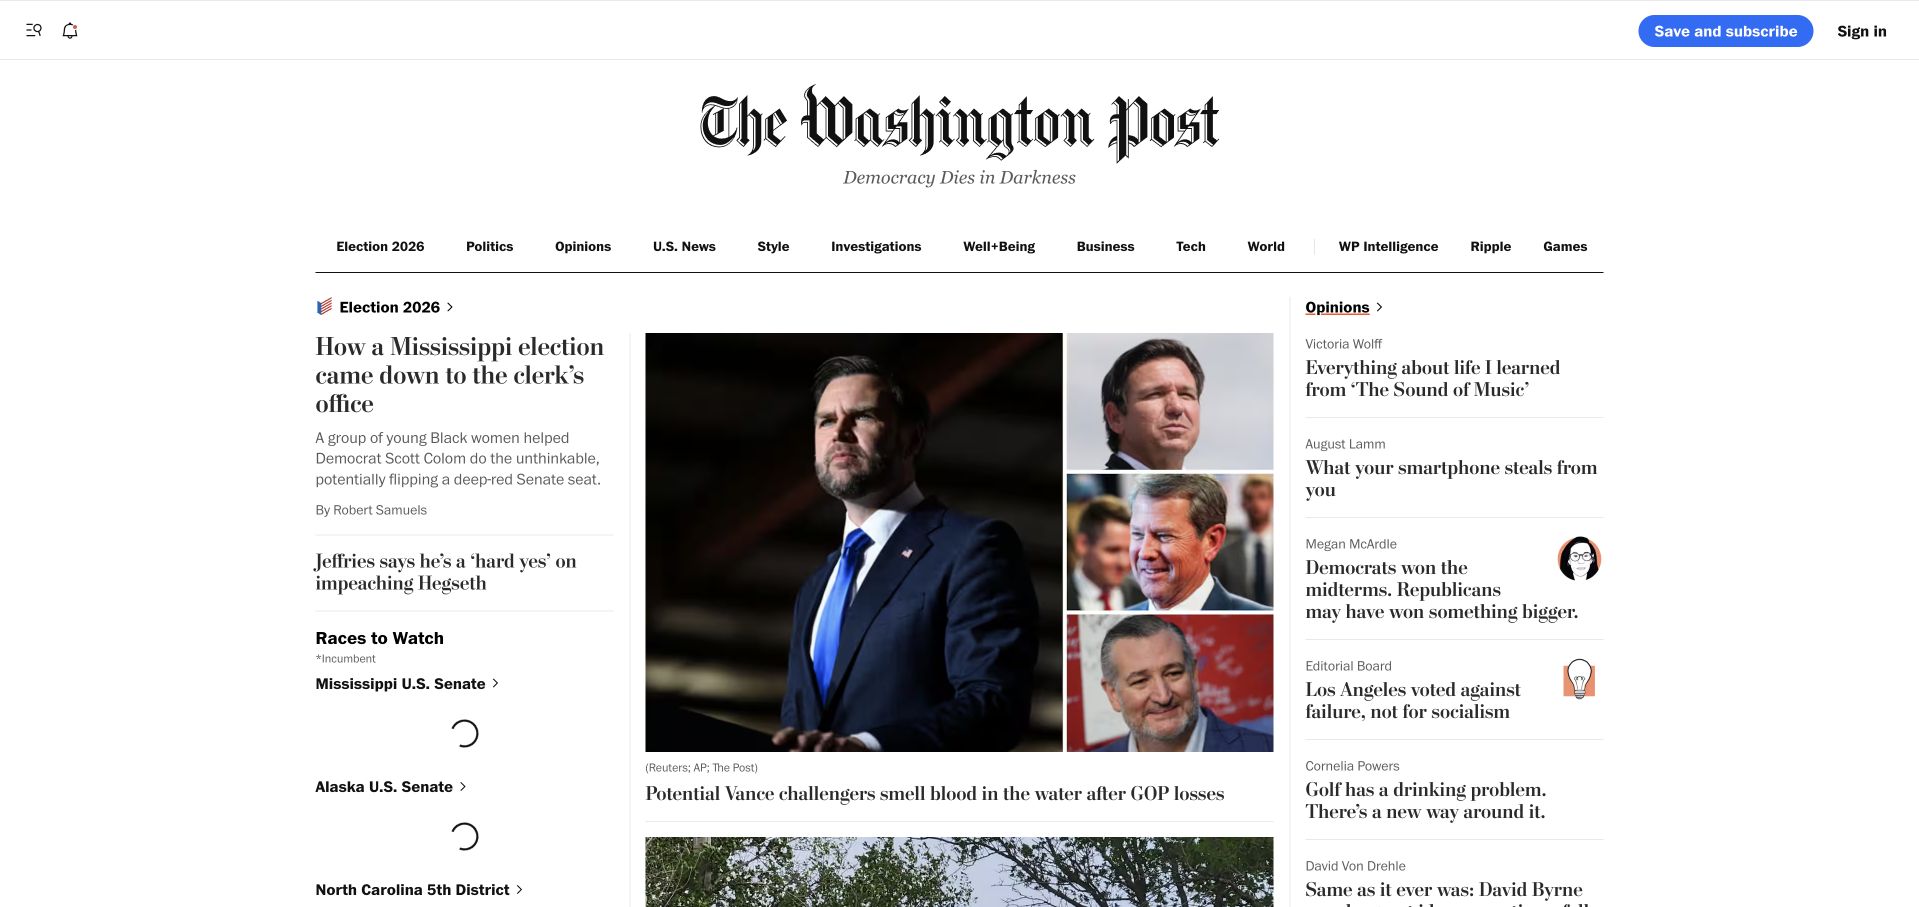
The Washington Post uses a large masthead, a compact topic row and a multi-column editorial layout. The lead image receives the greatest visual weight, while adjacent headlines and an opinion column provide alternative entry points. The design depends on typography and relative column size more than decorative interface effects. It is useful to study as a content-density problem: the page must keep a readable hierarchy even as breaking stories, long headlines and related coverage compete for limited screen space.
What you can learn
Monitoring traffic spikes is a specific operational task, not a description of the editorial system. Datadog’s directory identifies Washington Post material dated July 2022. That historical association does not independently establish current monitoring coverage, public-page performance or the complete publishing stack behind the screenshot.
Pros
The masthead provides a stable visual anchor above rapidly changing editorial material.
Different column widths make lead reporting and secondary opinion routes distinguishable.
Cons & considerations
Dense headlines can become difficult to scan when several stories have similar visual weight.
Live modules and advertising require careful loading behavior to preserve the reading hierarchy.
Visible tech stack
Earlier / documented evidence
Datadog
Platform source: The Washington Post — official Datadog association. Historical July 1, 2022 Washington Post traffic-spike detection material in the official Datadog resources directory. Official documentary association only. The named workload or listing is not proof that this public page runs on Datadog, nor a complete or independently tested current stack. Platform evidence is separate from the direct website screenshot and is not a complete current infrastructure audit.
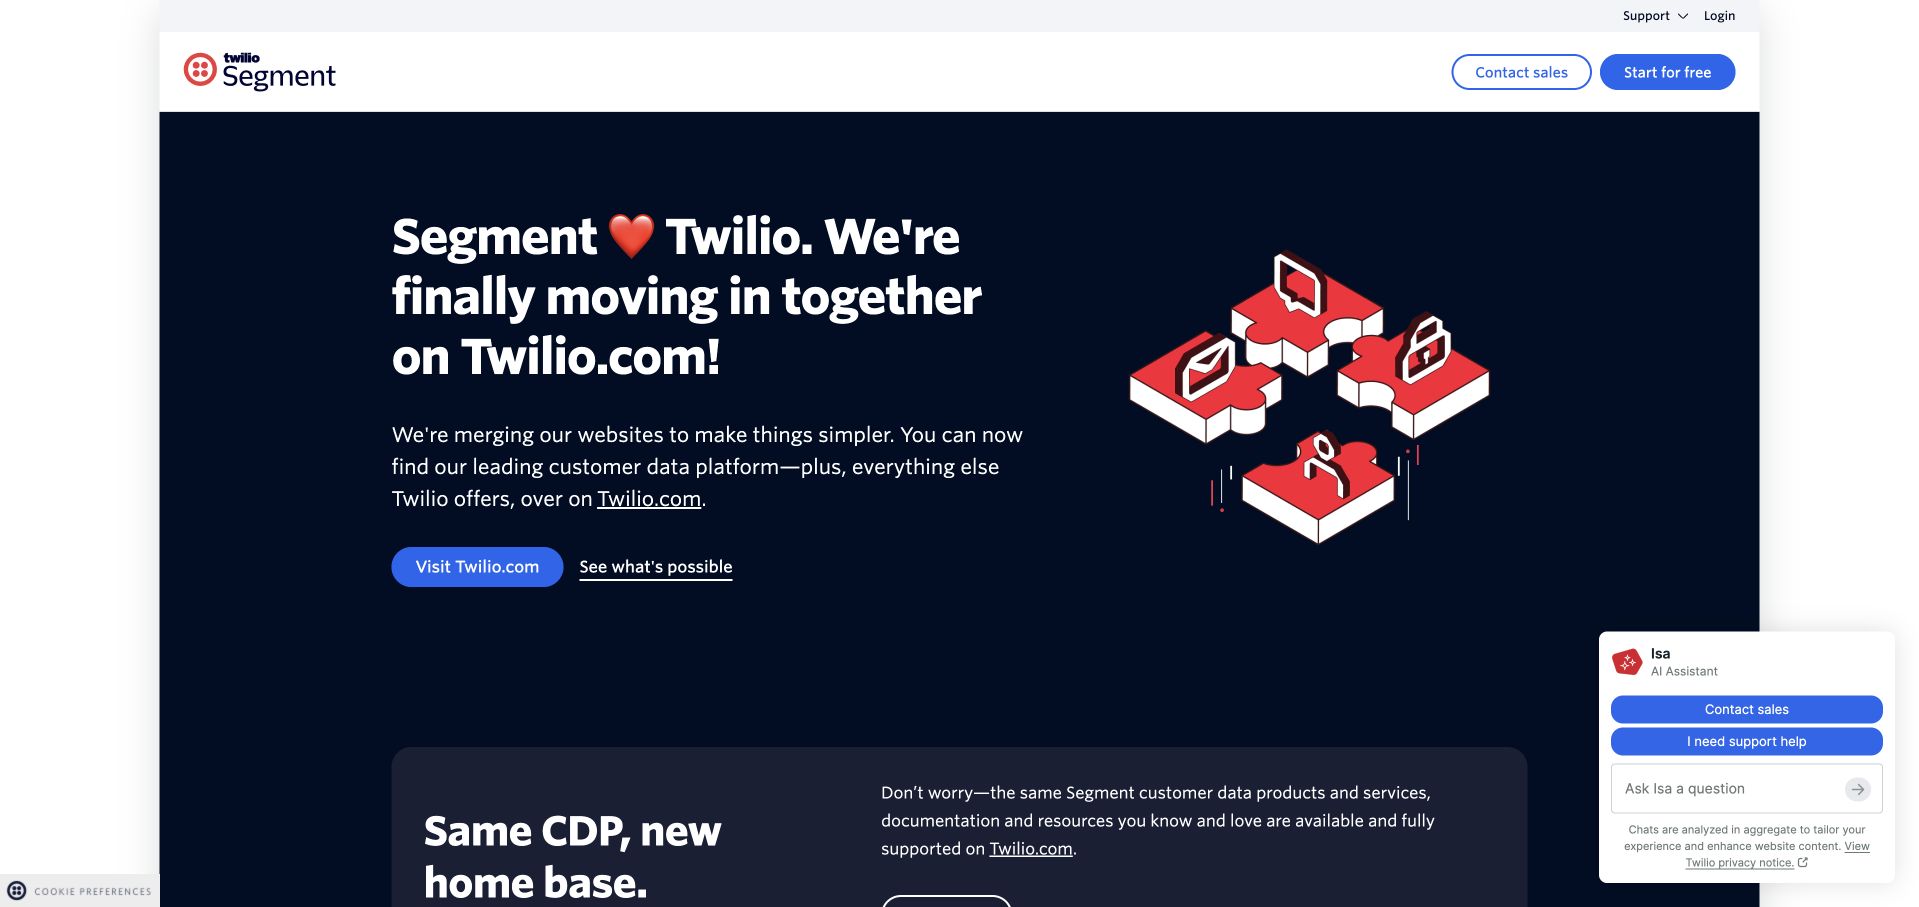
Segment’s public destination explicitly explains that its website is moving into Twilio’s larger platform. A dark blue panel, red dimensional illustration and clear action give that transition a recognizable visual form. Supporting copy explains continuity for documentation and services instead of relying on an unexplained redirect alone. The design is worth studying whenever a product moves into a parent company: acknowledging the change can be more useful than pretending every visitor already understands the new relationship and navigation.
What you can learn
Keep historical operational evidence attached to its original context. Datadog’s 2018 Segment talk concerns shared outages and incident-response culture. It does not establish the current Twilio destination’s monitoring stack or imply that a public brand transition automatically changed every underlying product and application.
Pros
The transition is stated directly rather than leaving visitors to infer why the brand moved.
A prominent action and explanatory copy give the change a practical next step.
Cons & considerations
Assistant panels and notices can compete with the transition explanation on smaller screens.
Old links and documentation destinations still need continuity beyond a well-designed announcement.
Platform source: Segment — official Datadog association. Historical July 12, 2018 Segment engineering incident-response talk. Official documentary association only. The named workload or listing is not proof that this public page runs on Datadog, nor a complete or independently tested current stack. Platform evidence is separate from the direct website screenshot and is not a complete current infrastructure audit.
BuzzFeed uses a white background, a compact masthead and a row of large numbered story cards. Each card combines a photograph with a concise headline, making the opening feel more like a set of immediate choices than one dominant news article. Additional sections begin below, separated by their own labels and card treatments. The design demonstrates how a publication can accommodate varied subject matter through repeated visual grammar, though its density also makes spacing and headline length especially important.
What you can learn
A content layout does not reveal its operational monitoring. Datadog’s resources directory lists Buzzfeed’s Docker-on-ECS monitoring material dated November 2018. This is explicitly historical documentary evidence, not a current audit of container infrastructure, every editorial product or the photographed public page’s performance.
Pros
Numbered lead cards give a varied group of stories a consistent visual structure.
Section labels provide another level of organization below the initial selection.
Cons & considerations
Several attention-grabbing cards can compete instead of producing a clear first choice.
Cookie notices and promotional inserts can interrupt the continuity of the editorial grid.
Platform source: BuzzFeed — official Datadog association. Historical November 2, 2018 Buzzfeed Docker on ECS monitoring material in the official Datadog resources directory. Official documentary association only. The named workload or listing is not proof that this public page runs on Datadog, nor a complete or independently tested current stack. Platform evidence is separate from the direct website screenshot and is not a complete current infrastructure audit.
Betterment uses a blue hero with a large serif introduction and a close view of a phone showing a financial interface. A yellow primary action and a short benefit list create a clear hierarchy without turning the screen into a feature comparison table. The image makes the software tangible, while the navigation distinguishes investing, cash, planning and advisory topics. The pattern is useful for explaining a service whose value unfolds over time rather than through a single immediate transaction.
What you can learn
Treat software-delivery monitoring as an operational subject, not evidence about investment outcomes. Datadog’s Betterment case concerns CI/CD and software-delivery observability. It does not validate account projections, financial suitability, customer results or the complete architecture behind this public investing-service introduction.
Pros
The phone image shows a recognizable product context beside the higher-level service proposition.
A short benefit list gives the hero more substance than an isolated financial slogan.
Cons & considerations
Illustrated balances and projections need clear context rather than being mistaken for expected outcomes.
A simple introduction cannot replace product costs, risks and audience-specific eligibility information.
Platform source: Betterment — official Datadog association. Betterment CI/CD and software-delivery observability case study. Official documentary association only. The named workload or listing is not proof that this public page runs on Datadog, nor a complete or independently tested current stack. Platform evidence is separate from the direct website screenshot and is not a complete current infrastructure audit.
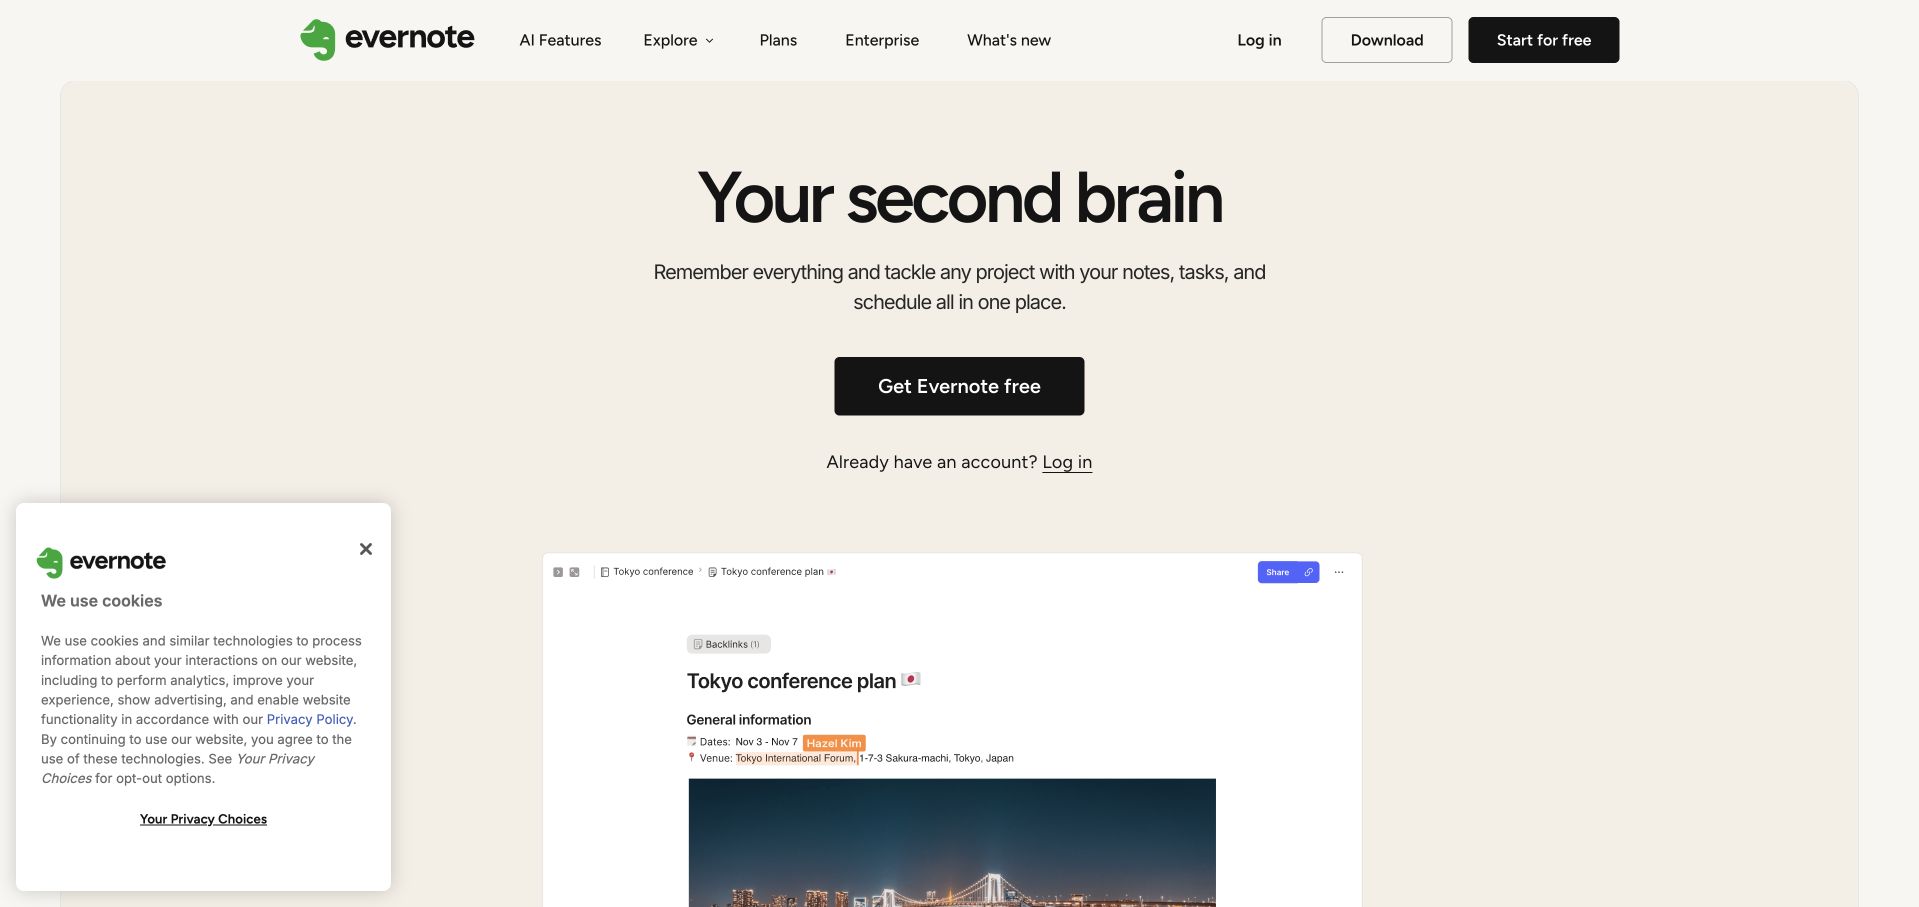
Evernote uses a pale neutral background and a centered introduction before revealing a note-like document interface below. The black primary control is conspicuous because the surrounding palette is restrained. Download and existing-account access remain in the header, so a returning user is not forced to follow the marketing action. The document preview is the most useful detail: it turns the broad organizational metaphor into something concrete while leaving enough white space for the main proposition to remain readable.
What you can learn
Monitoring infrastructure should remain distinct from private user content. Datadog’s official resources directory includes Evernote infrastructure-monitoring material dated July 2017. That historical account does not establish current telemetry collection, note privacy or the complete frontend and backend stack of this public marketing page.
Pros
The document preview gives the product promise a concrete visual counterpart.
Download and login remain recognizable alternatives to the primary new-user action.
Cons & considerations
A broad organizational metaphor needs examples of specific supported tasks further down the page.
Privacy notices can cover the first product preview if their placement is not carefully managed.
Platform source: Evernote — official Datadog association. Historical July 31, 2017 Evernote infrastructure-monitoring material in the official Datadog resources directory. Official documentary association only. The named workload or listing is not proof that this public page runs on Datadog, nor a complete or independently tested current stack. Platform evidence is separate from the direct website screenshot and is not a complete current infrastructure audit.
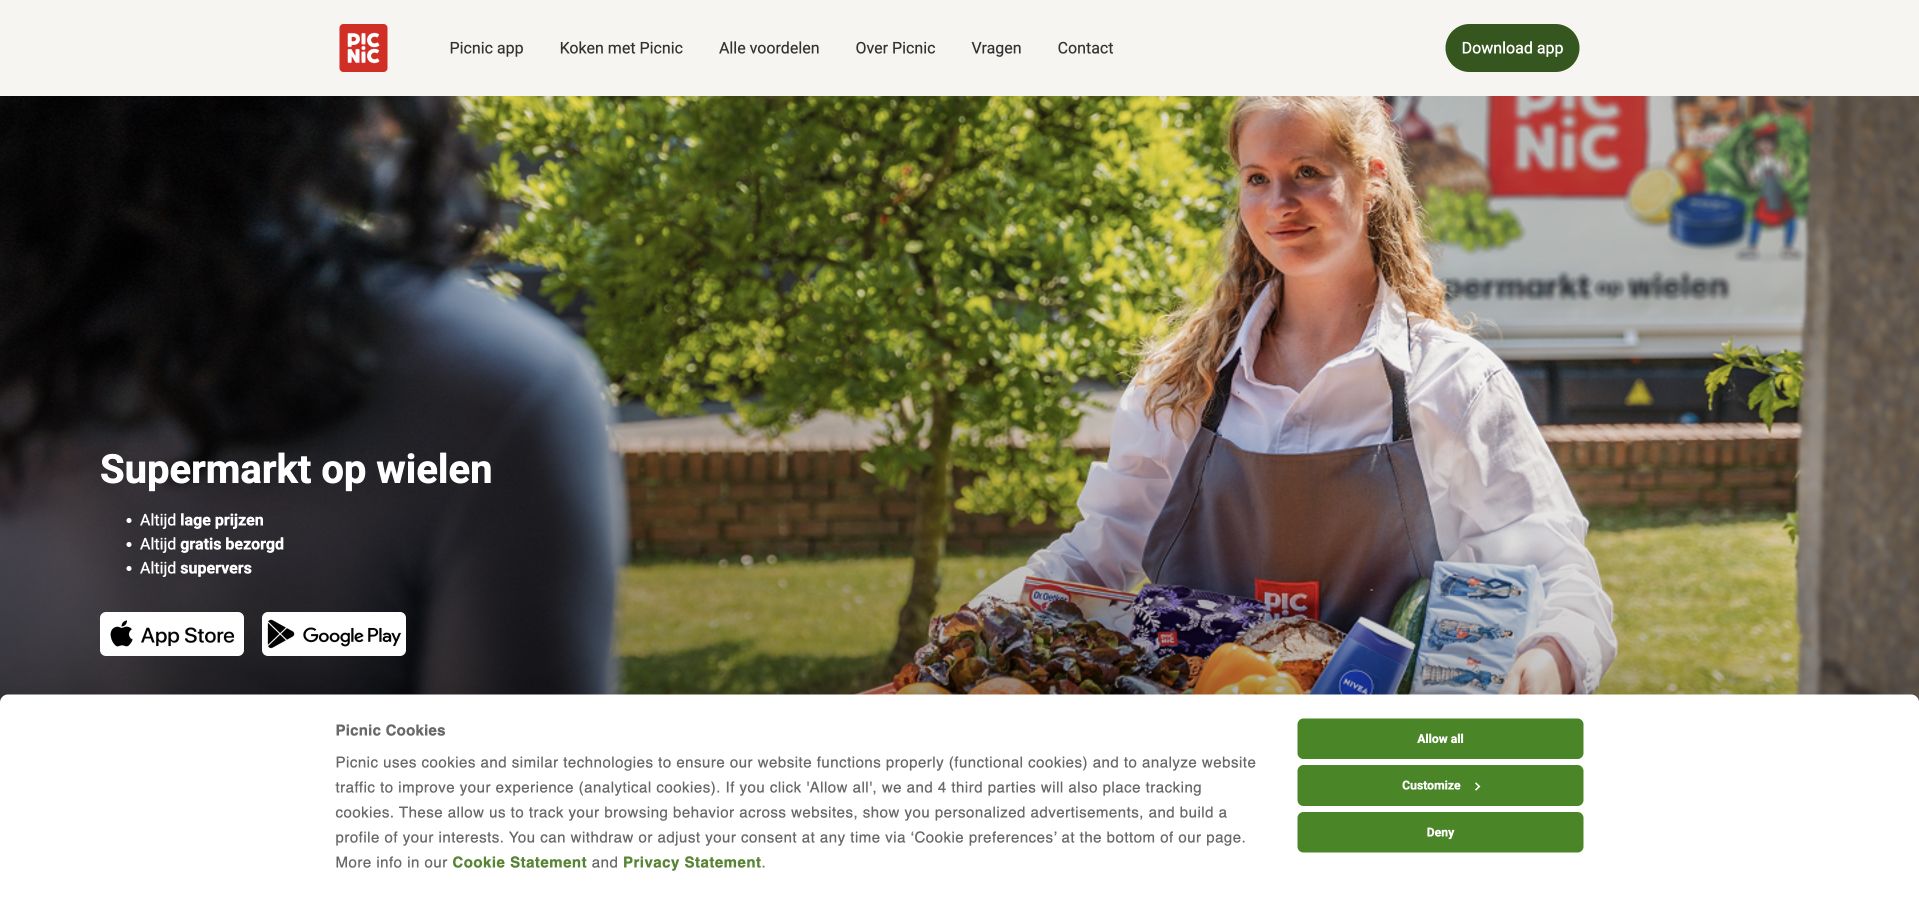
Picnic’s Dutch public page uses a full-width doorstep interaction to explain the service before presenting a long product description. A short text block sits over the darker part of the photograph, with app-store actions directly beneath it. The white header names the app, cooking content, benefits, company information and help. The composition is useful because the image shows a real service moment: a customer receiving groceries, not an abstract illustration of a delivery network or a generic phone-only software hero.
What you can learn
Connect observability to a specific service rather than inferring it from the image. Datadog’s directory lists a Picnic migration account dated October 2023, but its linked company article is unavailable. The historical listing does not establish current logistics components or this public page’s complete stack.
Pros
The doorstep photograph explains the physical service and its human context immediately.
App-store actions establish the next destination without a lengthy account form on the website.
Cons & considerations
Availability and service-area information need a clear route beyond the general delivery scene.
Large cookie panels can cover important parts of an image-led service explanation.
Platform source: Picnic — official Datadog association. Official Datadog resources directory lists Picnic’s migration with an October 31, 2023 date; the linked company article now returns 410 and is not treated as a current readable case study. Official documentary association only. The named workload or listing is not proof that this public page runs on Datadog, nor a complete or independently tested current stack. Platform evidence is separate from the direct website screenshot and is not a complete current infrastructure audit.
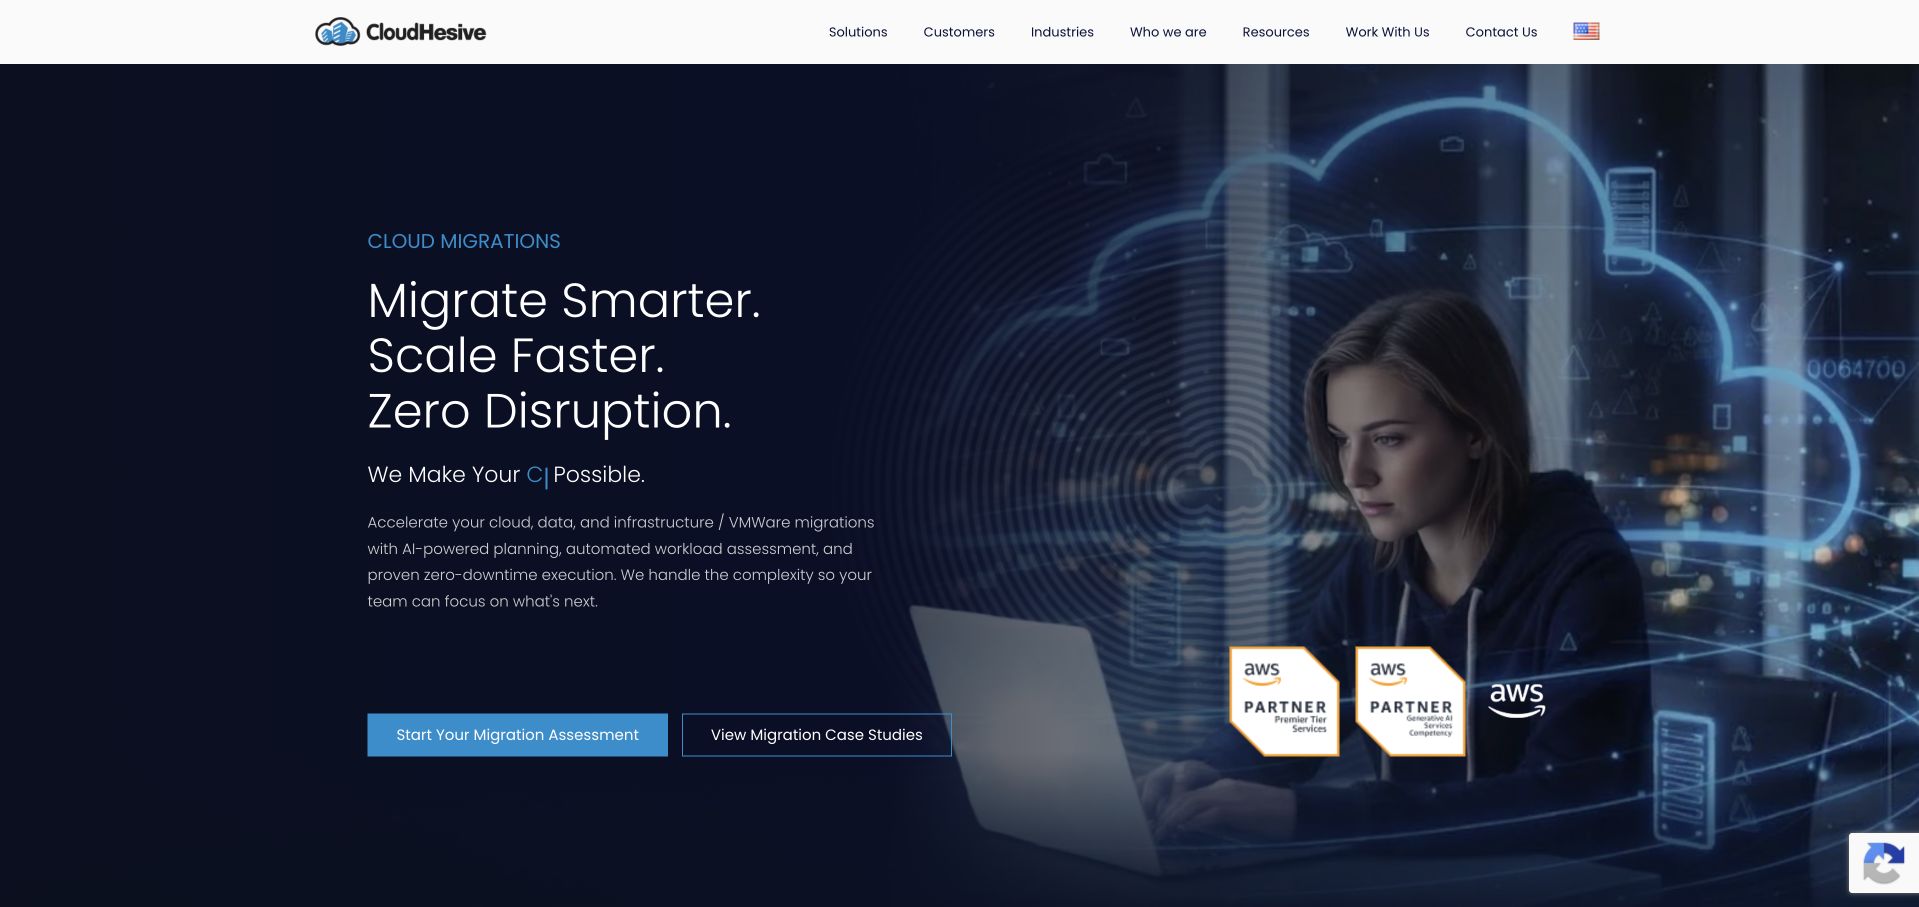
CloudHesive uses a dark blue hero, a short migration-oriented heading and a human portrait combined with cloud imagery. Two actions distinguish starting a discussion from reading customer evidence. The white navigation names solutions, customers, industries, resources and work, giving the specialist offer a wider organizational context. The page is useful for a technical service business because it avoids beginning with a crowded architecture chart, but its strongest claims still depend on the detail and evidence offered beyond the initial composition.
What you can learn
Keep a migration campaign distinct from the provider’s own monitoring relationship. Datadog’s resources directory lists CloudHesive material dated August 2019. That historical association does not independently validate the homepage’s migration claims, guarantee uninterrupted delivery or identify every system used by CloudHesive and its customers.
Pros
Two distinct actions separate service evaluation from a lower-commitment review of customer evidence.
The portrait gives an otherwise technical cloud proposition a recognizable human subject.
Cons & considerations
Strong migration promises require explicit scope and limitations rather than an absolute interpretation.
Dark background detail can reduce supporting-text legibility if the image becomes too busy.
Platform source: CloudHesive — official Datadog association. Historical August 12, 2019 CloudHesive cloud and migration material in the official Datadog resources directory. Official documentary association only. The named workload or listing is not proof that this public page runs on Datadog, nor a complete or independently tested current stack. Platform evidence is separate from the direct website screenshot and is not a complete current infrastructure audit.
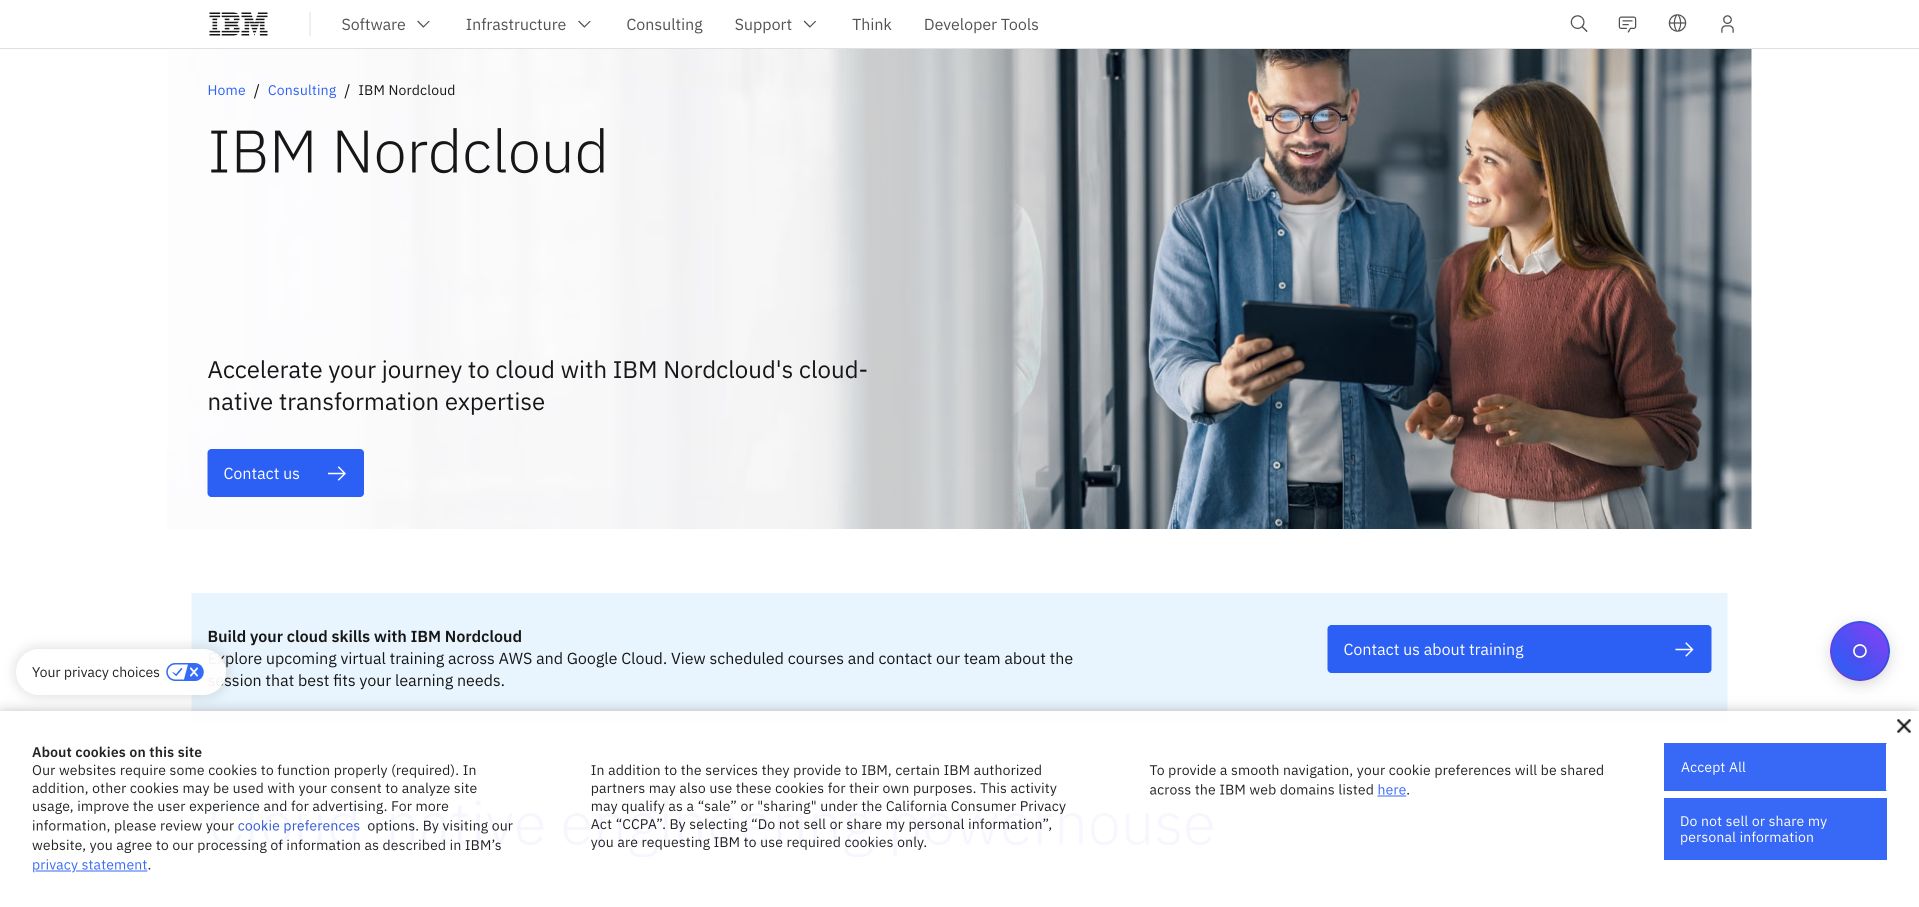
Nordcloud’s current public destination uses IBM’s white-and-blue consulting layout rather than a separate standalone brand site. The specialist name appears prominently beside a workplace photograph, while the parent navigation remains visible. This is a useful reference for an organizational transition: the page can preserve a recognizable service proposition without disguising who now publishes and organizes the content. The spacious composition also leaves room for explanation, which matters when a familiar name has moved into a broader portfolio.
What you can learn
Keep the documentary date and organization boundary intact when a brand moves. Datadog’s resources directory documents historical Nordcloud service-provider and Azure CSP material. It does not prove that the present IBM destination uses the same monitoring setup or that every Nordcloud customer has the same architecture.
Pros
The parent relationship is visible rather than hidden behind an unexplained destination change.
A simple image-and-text layout keeps the specialist service legible within a large corporate system.
Cons & considerations
Parent navigation may introduce unrelated choices before visitors reach the service they expected.
Historical technical cases need explicit scope when ownership and public publishing destinations have changed.
Platform source: Nordcloud — official Datadog association. Historical Nordcloud Azure CSP and Datadog service-provider material in the official resources directory; public IBM subsidiary page is the current visual reference. Official documentary association only. The named workload or listing is not proof that this public page runs on Datadog, nor a complete or independently tested current stack. Platform evidence is separate from the direct website screenshot and is not a complete current infrastructure audit.
Kegan has 15+ years of experience working with small businesses, Fortune 500 companies, and everything in between. No development job is too big or too small: he brings the same hands-on attention to a focused improvement, a complete website, or a custom application.
For Datadog projects, he can help with website integrations, form and campaign connections, analytics implementation, testing, and clear ownership after launch. He works directly with clients on scope, design, implementation, testing, and handover, with an emphasis on clear communication and a system that remains practical to maintain after launch.
Show 3 other Datadog developersHide other Datadog developers
Use this when the question concerns what people encounter in the browser: a page transition, resource problem or application error. Define meaningful route names and inspect the collected context before broad rollout. A monitoring setup should not accidentally turn private page content into diagnostic data.
Identify the request or job responsible for the task and the system boundaries it crosses. Decide which identifiers let the operating team connect related events without adding unnecessary personal information. A high-volume engineering example can supply ideas, but it cannot define the correct instrumentation for your application.
A deployment or delivery workflow
Betterment’s official case concerns software delivery, not just the public investing page. Treat builds, tests and releases as their own workload when those are the real source of risk. The operating question may be which change introduced a problem rather than what the homepage looks like.
From references to requirements
Plan useful investigation, not only collection
Write the questions the team must answer
Use a representative incident scenario and list the decisions needed to investigate it. Name the relevant service, release and environment. Remove decorative metrics that do not help those decisions. The output should explain why a signal exists and where an operator goes next, not simply show that the dashboard has data.
Review the data before enabling wider capture
Inspect representative URLs, errors, context fields and product behavior in a controlled environment. Decide sampling and context deliberately, with the people responsible for privacy and operations. Datadog’s browser configuration supports adjustments to collected context; the right configuration still depends on the actual application and its obligations.
Create a controlled nonproduction failure and confirm that the intended person receives a useful explanation with a next step. Then restore the service and verify the recovery behavior. Test delayed and missing data separately so the team does not learn about a blind spot during a real incident.
A useful handover demonstration
Ask the actual team to carry out its routine job: publish a realistic update, correct a mistake, preview a narrow screen, and identify who owns an integration failure. For a library or frontend framework, also ask who maintains the content source and deployment. A polished screenshot does not answer those operational questions.
Beyond the screenshot
A Datadog observability checklist
Name one important user or operating task.
Define successful completion for that task.
Identify the service and responsible team.
Choose browser, application and infrastructure layers deliberately.
Give environments and releases recognizable names.
Inspect URLs and diagnostic context before rollout.
Decide sampling and collected context intentionally.
Define what missing or delayed data means.
Make alerts actionable for a named owner.
Test a controlled failure and recovery.
Review signal volume and operating costs.
Keep historical customer evidence clearly dated.
Test with real content, a keyboard, a small screen, slow or failed requests, and the people who will maintain the system. These are planning checks, not an accessibility, security, performance, or search-ranking certification.
Sources & editorial method
How this Datadog collection was reviewed
Twenty distinct public website properties were independently reviewed for this Datadog collection. Direct public-browser captures were visually inspected; reused exact-page captures retain their original image paths, dates and provenance. Fresh captures were made November 9 UTC during November 8, 2026 Pacific research. A null capturedAt means the original day, but not a precise time, is known; no timestamp was invented. Official primary customer cases, engineering sessions, documentation and explicitly identified directory listings establish only the named workload or association. Historical material stays historical. Public screenshot appearance is not proof of the pictured page’s complete stack or current backend. These are original design observations, not measured rankings or endorsements of financial, clinical, security, accessibility, performance or AI outcomes. No private application workflows, signups, forms, purchases or account changes were used. Website owners retain their images and trademarks. The sole publisher performs a separate bounded public-stack audit before publication without replacing earlier observations.
Every image is an unmodified capture from the actual website, with its source and capture date. Some captures are reused from our shared catalog; their dates remain the original capture dates. None comes from a vendor gallery or a generated reconstruction. Moving imagery and live content can change.
Technology attribution uses public page assets or metadata, official platform documentation, or a cited first-party project case study. Documentary and framework-relationship evidence is identified where used; it is not a complete current backend inventory. A CMS image CDN alone does not establish a full CMS deployment. A library’s presence does not prove which individual controls use it, and a platform label does not establish AI authorship.
The composition notes, lessons, pros and tradeoffs are original editorial observations. We have not measured conversion, traffic, security, performance or accessibility conformance. Website owners retain their brands and imagery; these examples are not our client portfolio. Written, Edited and Curated are independent records, not dates advanced by a build. See our editorial standards or suggest a correction.
Questions worth asking
Datadog website development FAQs
Does a Datadog customer story prove the homepage uses its Browser SDK?
No. An engineering observability relationship can concern a different service or internal workload. The exact public-page instrumentation needs its own evidence. This guide does not infer it from a company logo or a backend case study.
Is a chart with no errors enough evidence that the service is healthy?
No. Missing or infrequent data can have several causes. Decide what signals should be present and what silence means for the particular service. Test the collection and alert behavior rather than assuming an empty result proves success.
Do these reviews measure website performance?
No. They are original visual and information-design observations paired with documentary associations. The collection has not independently benchmarked uptime, page speed, incident response or any customer-reported results.
Why include cases from 2016 or 2017?
Historical engineering material can explain a specific approach if its date remains explicit. It does not establish the current stack, and a newly captured homepage does not advance the date of the old technical evidence.
Should every public page collect detailed user context?
Not automatically. Define the diagnostic purpose, inspect representative data and involve the responsible privacy and operations owners. Collecting more information is not inherently more useful, and a monitoring tool does not decide the application’s obligations for it.
Use the website examples to identify meaningful journeys. Then build an observability brief around the questions, signals, owners and failure states needed to operate your actual service—not an imitation of a famous company’s dashboard.