Best Looker Websites of 2026 (20 Real-World Examples)
Public design references from organizations with documented Looker analytics associations.
Explore 20 public websites alongside scoped business-intelligence evidence. The collection is about readable interfaces and analytics project decisions—not a claim that Looker renders these marketing pages.
PayPal, Intel, Major League Baseball, Etsy and Wayfair open the collection. Their public pages demonstrate very different communication problems: payments, engineering, sports publishing, marketplace identity and corporate storytelling. Google Cloud material separately documents particular Looker workloads. An enterprise analytics case and a screenshot of the same organization answer different questions.
Looker is not interchangeable with Looker Studio. Before planning a dashboard, identify the actual product, deployment and intended audience. Some references below concern historical use, one concerns a partner’s stated implementation capability, and others describe internal or embedded analytics. Read those boundaries before inferring anything about a company’s present public-page stack.
Before the examples
What makes good Looker website development in 2026?
Agree on the meaning before designing the chart
Start with a decision someone needs to make. Define the measure, reporting period, population and exclusions before choosing a visualization. A shared dashboard is not useful if finance and operations interpret the same label differently. Make the owner of each definition visible in the handoff, and distinguish an exploratory calculation from a reviewed business measure.
Treat an embedded dashboard as an authenticated feature
Private embedding is an application design decision, not simply a copied public link. Google documents supported authentication and embedding approaches with product-specific requirements. Choose the route against the actual audience and edition, then review what the application may expose. Keep the public marketing site and the authenticated analytical area conceptually separate.
A story about license utilization, cloud-cost reporting or venue analytics establishes that workload, not a complete company architecture. Preserve dates and subsidiary context. The useful question is what the example teaches about a particular decision—not whether a famous logo can justify applying the same system to every new website.
The collection · 20 examples
20 Looker website examples worth studying
Exactly 20 public design references, each paired with a qualified documentary association. The visible interface is reviewed independently from the analytics workload.
We start with five recognizable brands or organizations: PayPal, Intel, Major League Baseball, Etsy, Wayfair. Each attribution applies to the named website property, not every product or website belonging to its organization. This is a curated reading sequence, not a measured ranking.
PayPal's captured US homepage uses a white, generously spaced opening with personal and business tabs, one large seasonal headline, and a compact black action. A blue gift-themed image begins below, with an app QR panel on the right. Login and signup remain separate in the header rather than becoming campaign actions. Google Cloud's customer account documents a different layer: employee conversational analytics using Looker models and an MCP-based integration. That is evidence of a governed internal analytics workload, not evidence that Looker renders this payment-service homepage or implements its consumer account interface.
What you can learn
Separate public campaign design from analytics architecture. If a project adds conversational reporting, define authorized metrics and receiving audiences explicitly rather than assuming a familiar brand interface demonstrates the permissions or data model behind it.
Pros
A single campaign action keeps the first-screen message easy to follow.
Persistent account controls remain identifiable outside the promotional content.
Cons & considerations
Seasonal copy can delay a literal explanation for visitors unfamiliar with the service.
The public page does not expose the internal Looker reporting experience described by the source.
Platform source: Primary documented Looker association. Documented association: Governed employee analytics and Looker MCP; not the public payment-page frontend. Platform evidence is separate from the direct website screenshot and is not a complete current infrastructure audit.
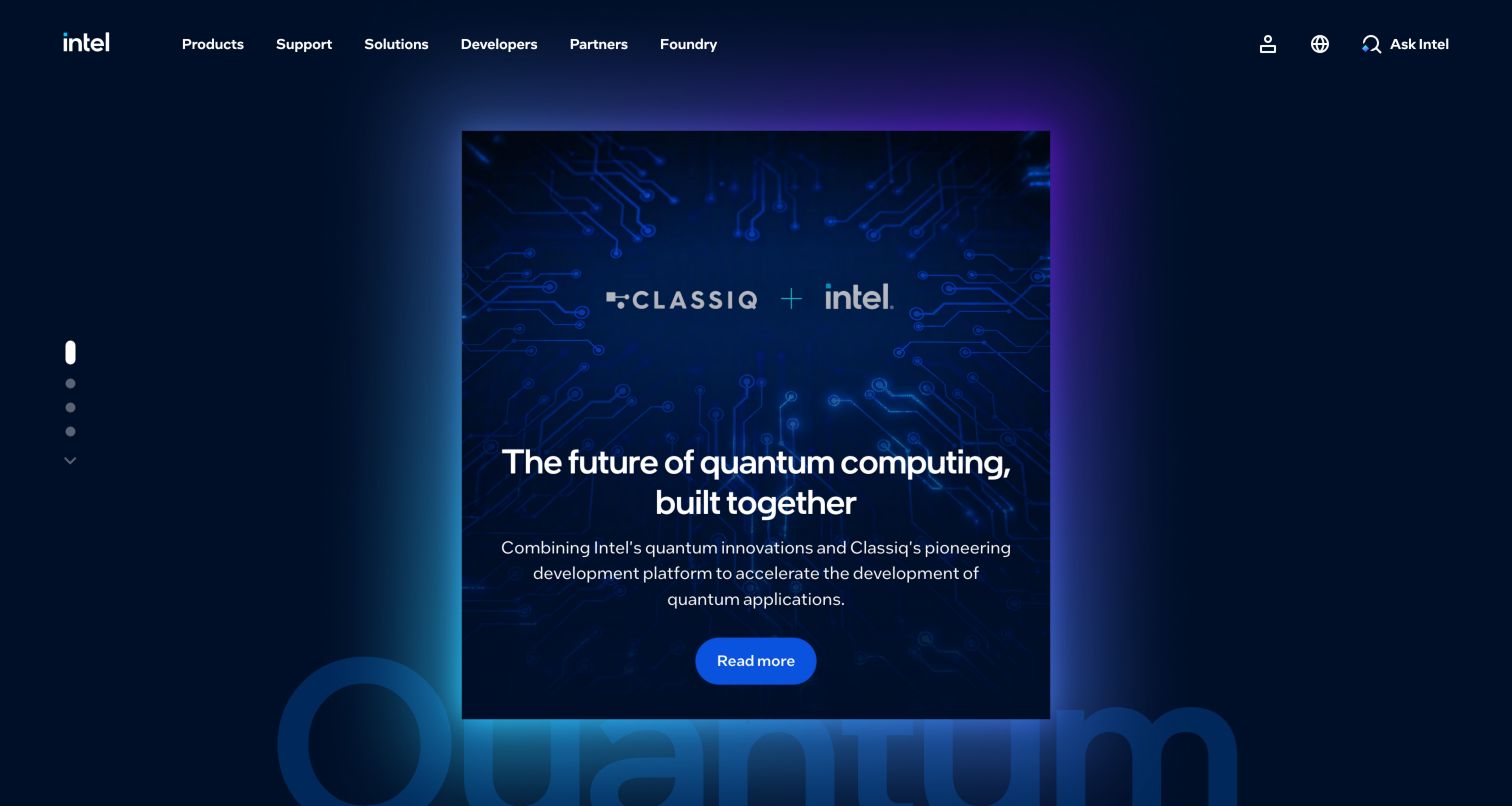
Intel's captured homepage uses a deep blue background and a centered quantum-computing partnership card with a bright blue read-more control. The surrounding header keeps products, support, solutions, developers, partners, and foundry routes visible. The card is a focused editorial surface, not a demonstration of an analytics dashboard. The relevant Google Cloud case concerns Intel's Design Ecosystem Solutions Analytics team and its software-license usage modeling through Looker. That team-specific semantic-model workload should not be extended to every Intel business unit, semiconductor product, or public page. The design reference and the documentary analytics association are separate observations.
What you can learn
Keep the scope of an enterprise reference as precise as the team and workload described. A central modeling project can inform governance decisions, but its existence does not identify the technology generating a corporate marketing card or navigation system.
Pros
The focused card gives a large technology catalog a manageable current story.
The dark surface and blue action provide a consistent visual hierarchy.
Cons & considerations
A campaign card may leave general product orientation to the navigation.
A team-specific analytics case cannot support a company-wide public-runtime claim.
Platform source: Primary documented Looker association. Documented association: Intel Design Ecosystem Solutions internal license-usage modeling; not every Intel business unit or public-page runtime. Platform evidence is separate from the direct website screenshot and is not a complete current infrastructure audit.
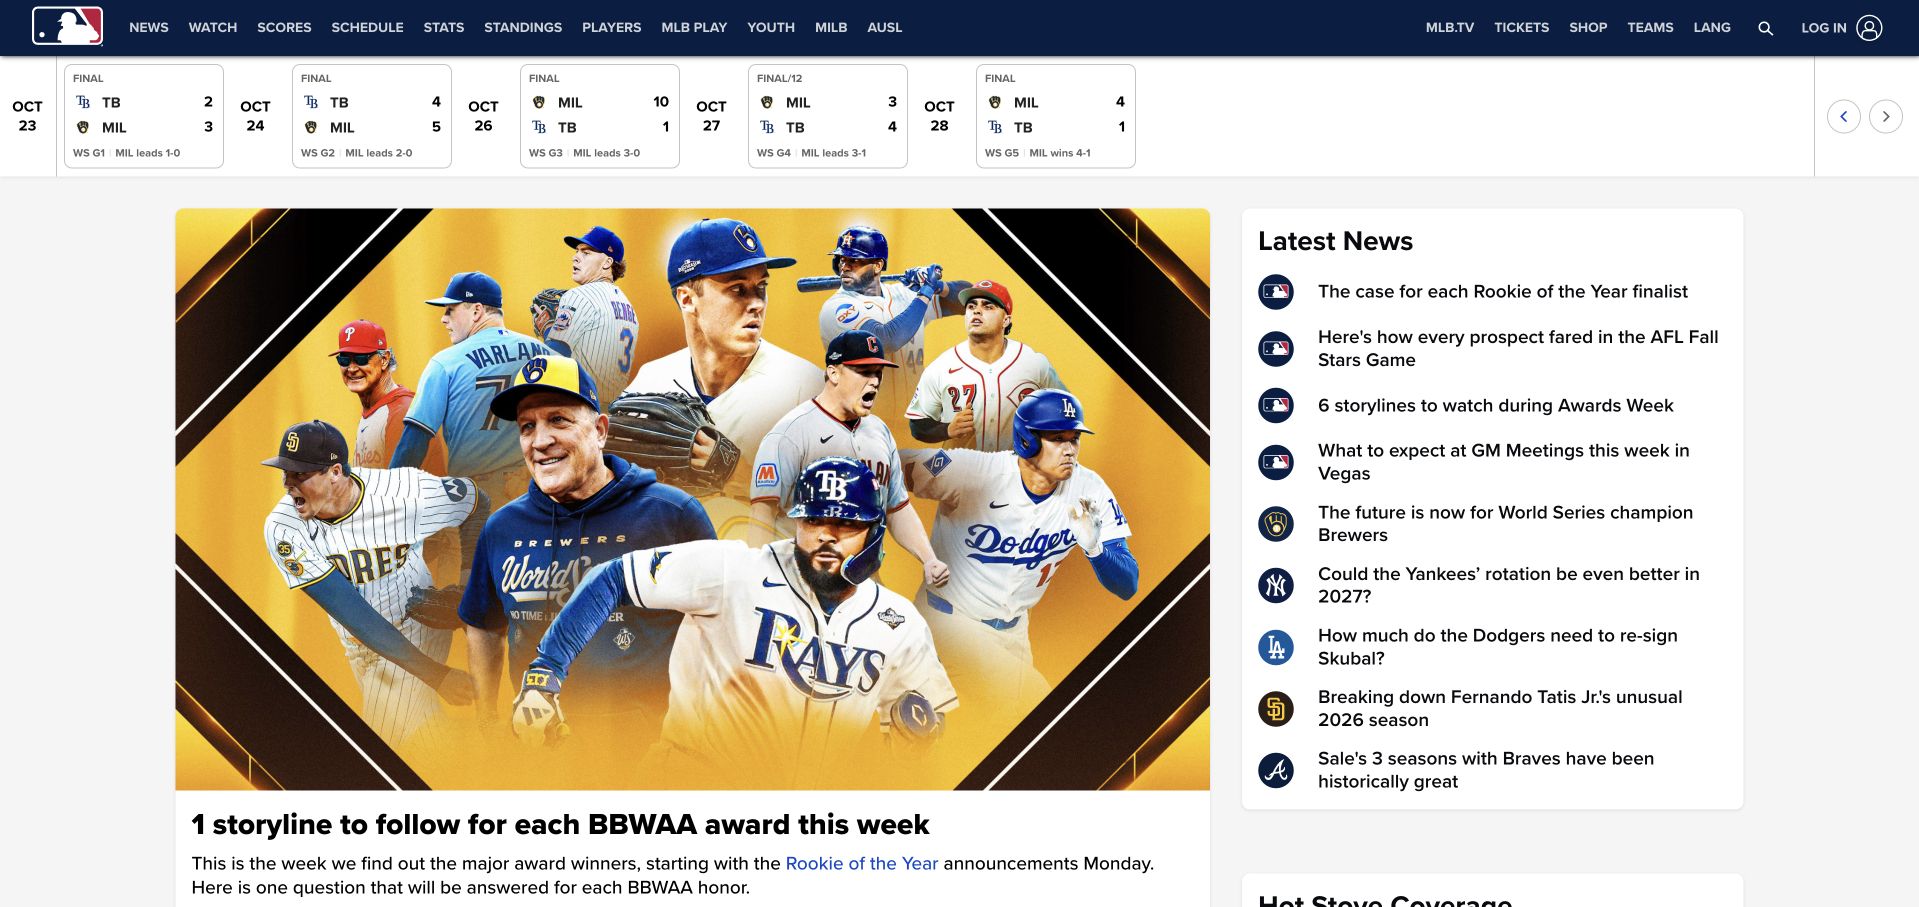
MLB's captured homepage places a compact scoreboard strip below a navy navigation bar, then pairs a large baseball-news feature with a narrower latest-news column. Team and game routes remain available above the editorial content. The visual lesson is the separation of recurring utility from changing stories. An MLB-authored Google Cloud article dated August 11, 2020 describes Looker reporting over its BigQuery warehouse, including business-user analysis and contest-submission dashboards. That historical account establishes a specific business-intelligence association, not current proof of the homepage's publishing system, scoreboard implementation, or every club's technology. The visible news layout remains an independently inspected public design reference.
What you can learn
Separate always-needed utility from changing editorial modules, and preserve dates when citing architecture stories. A historical reporting example can inform a brief without being presented as a current inventory of the public website or every affiliated organization.
Pros
The scoreboard has a distinct place before the changing news content.
A feature-and-latest-news split supports both browsing and quick updates.
Cons & considerations
Dense navigation and small score details need careful mobile prioritization.
The 2020 analytics account does not establish the current public publishing or game-data stack.
Platform source: Primary documented Looker association. Documented association: August 2020 MLB-authored case documents Looker reporting during warehouse modernization; historical workload, not proof of the current MLB homepage frontend. Platform evidence is separate from the direct website screenshot and is not a complete current infrastructure audit.
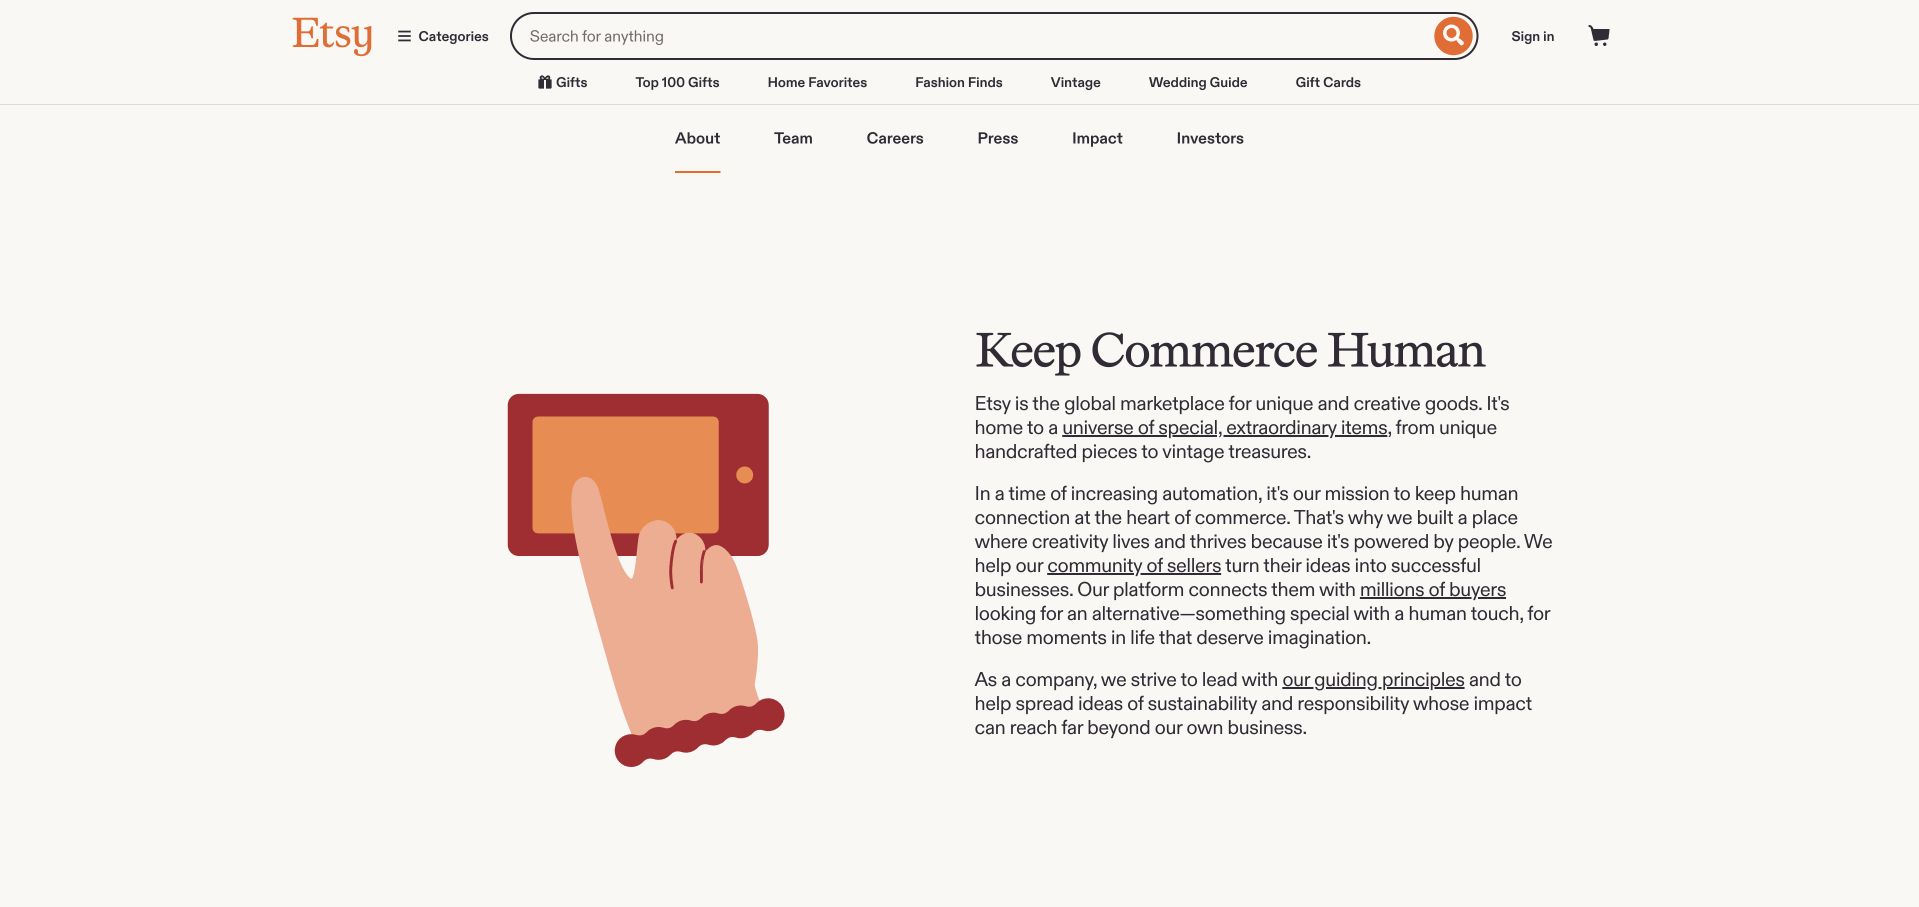
Etsy's about page keeps the marketplace search and category navigation above a much quieter corporate introduction. A simple hand-and-object illustration sits beside a serif mission heading and several short paragraphs, with generous cream space around both. This is an about-page reference, not a screenshot of a product-results grid. Google's customer account separately describes cloud-cost reporting through Looker, connected with budget and billing data in BigQuery. That documentary workload concerns financial visibility inside the organization and should not be used to identify the CMS, commerce engine, or rendering framework of the inspected public page. The useful contrast is between a restrained public story and a distinct internal reporting need.
What you can learn
Let an about page explain the organization in readable content while keeping commerce navigation available. In the project brief, distinguish cost-governance reporting from the systems used to publish that narrative or sell products.
Pros
The illustration and short text blocks create a calm corporate reading experience.
Marketplace search remains available without becoming the focus of the about content.
Cons & considerations
Several navigation layers occupy space before the corporate introduction.
The cost-reporting case does not establish the current implementation of the public page.
Platform source: Primary documented Looker association. Documented association: Historical Google Cloud cost reporting through Looker; current public-page stack remains separately observed. Platform evidence is separate from the direct website screenshot and is not a complete current infrastructure audit.
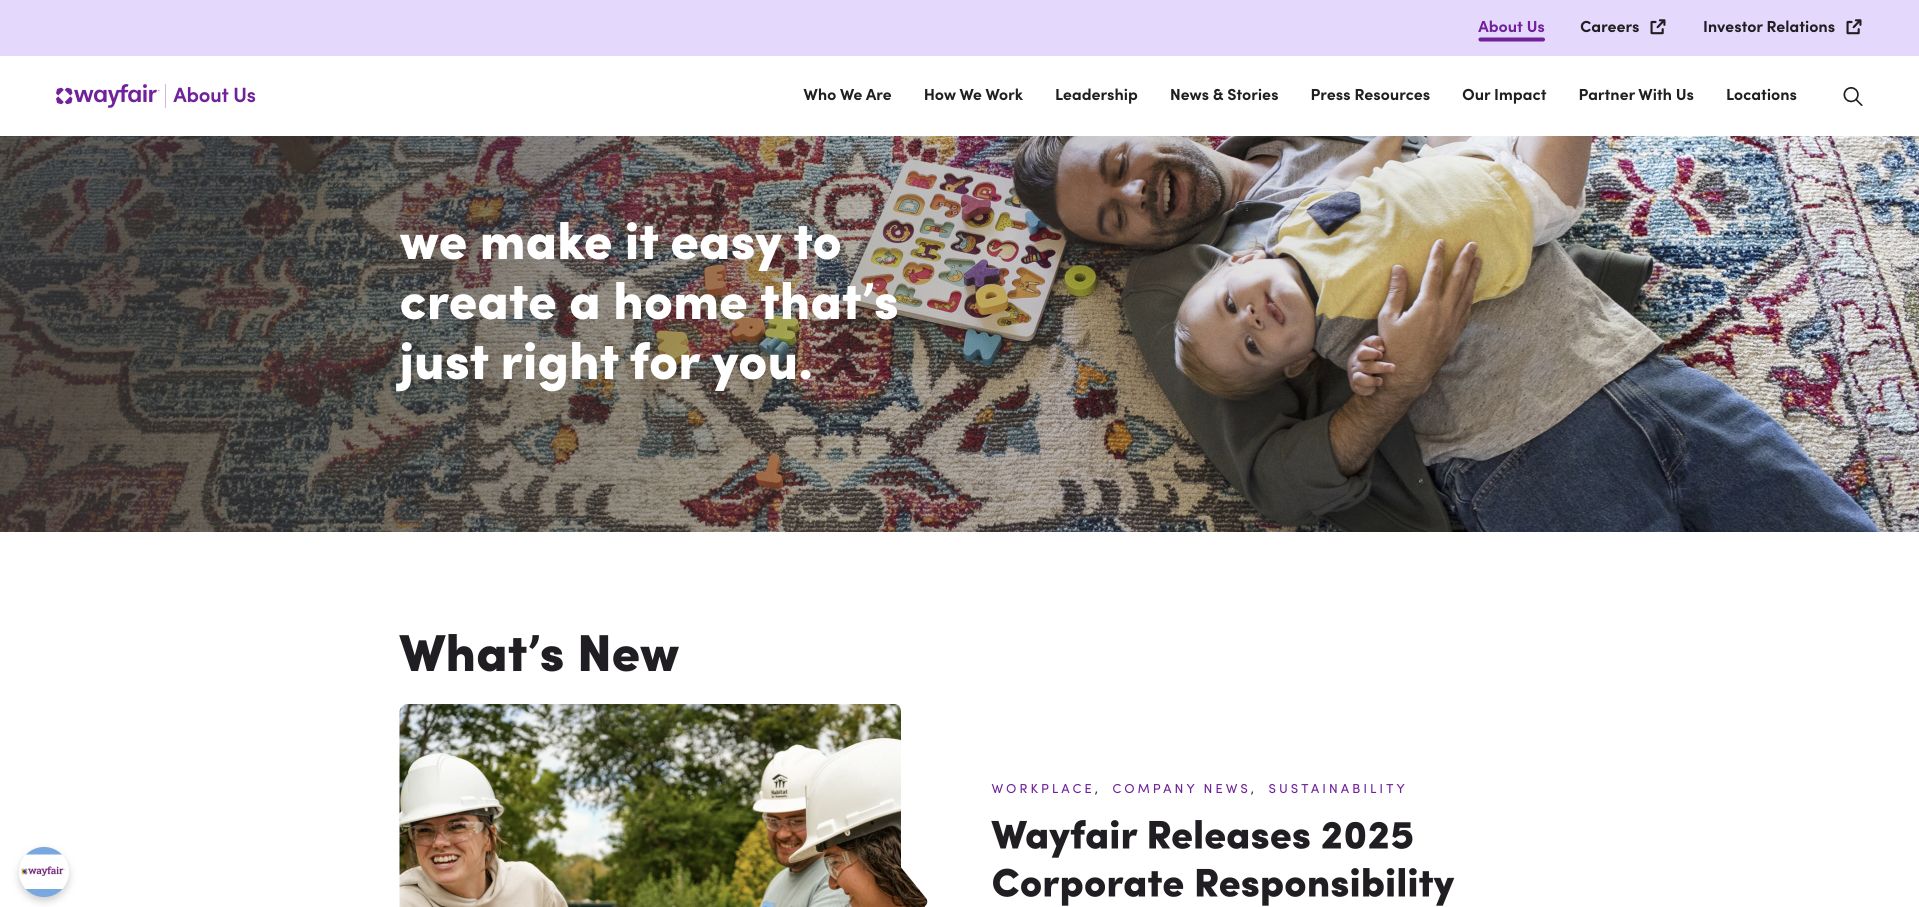
Wayfair's corporate homepage uses a pale purple header and a large family-at-home photograph with a short white mission statement. Company navigation includes work, leadership, suppliers, responsibility, news, and contact rather than a product-shopping taxonomy. A news section begins directly below the image. This is useful for studying a corporate audience separate from the retail storefront. Google Cloud documents Wayfair's employee analytics platform involving Looker, Looker Studio, and Connected Sheets for Looker, organized around governed data. That association concerns business reporting and does not establish which software publishes the corporate page or powers the company's shopping interfaces. The image and navigation are public design observations, not analytics evidence.
What you can learn
Keep corporate and customer-shopping tasks distinct when the audiences differ. Model internal reporting requirements separately, including shared definitions and access, rather than inferring a marketing-site framework from a company's analytics customer story.
Pros
Corporate navigation clearly addresses people researching the organization rather than shopping.
The news section follows the mission image without a long intervening pitch.
Cons & considerations
White overlay copy depends on careful contrast against a detailed family photograph.
The employee analytics case does not identify either corporate or retail frontend technology.
Platform source: Primary documented Looker association. Documented association: Business analytics platform including Looker; corporate homepage used as a public design reference. Platform evidence is separate from the direct website screenshot and is not a complete current infrastructure audit.
Thomson Reuters uses a dark green product-introduction panel beside a large professional portrait. An orange action leads the current story, while a pale section underneath separates legal, tax, accounting, trade, risk, and news-related solutions. The short header organizes solutions, products, purchasing, resources, and help. This is useful for studying how a broad enterprise catalog can remain navigable beneath one prominent campaign. Google Cloud's Looker case concerns semantic modeling and embedded analytics for enterprise regulatory and reconciliation workflows. It does not demonstrate the technology rendering this marketing page, validate professional advice, or imply that every Thomson Reuters product uses the same analytics implementation.
What you can learn
Keep campaign hierarchy and audience taxonomy working together. When discussing analytics in regulated professional products, identify the particular reporting workload and responsible review process rather than turning a vendor story into a broad promise of compliance or public-site technology.
Pros
The solid green panel keeps the current product message readable beside the portrait.
A separate solution row exposes several professional audiences immediately below.
Cons & considerations
A campaign-led opening can postpone the broader catalog explanation.
Documented enterprise analytics does not validate legal, tax, or compliance outcomes.
Platform source: Primary documented Looker association. Documented association: Semantic modeling and embedded enterprise analytics; not a full website-stack claim. Platform evidence is separate from the direct website screenshot and is not a complete current infrastructure audit.
Auto Trader's UK corporate page uses a large outdoor vehicle photograph with an oversized responsibility-oriented statement on the left. A share-price line and compact menu sit above it, identifying the page's investor and company context rather than a vehicle-search journey. A vertical company tab provides another route into the organization. The design is useful for studying a corporate surface whose audience differs from the consumer marketplace. Google Cloud's customer case describes Looker modeling and analytics for internal and external stakeholders at the UK Auto Trader business. That is not evidence about the unrelated US Autotrader company or the framework rendering this particular corporate homepage.
What you can learn
Treat the corporate destination as a separate design task and keep entity names precise. A marketplace analytics reference should describe the documented UK organization and workload, not be generalized to similarly named businesses or every public surface.
Pros
The investor context is visible in the share-price header.
A large photographic story gives the corporate page a distinct role from search results.
Cons & considerations
Very large overlay text requires careful image cropping at narrow widths.
The analytics case cannot identify the current public corporate or vehicle-marketplace frontend.
Platform source: Primary documented Looker association. Documented association: Internal and external analytics associated with the UK Auto Trader business, not unrelated US Autotrader. Platform evidence is separate from the direct website screenshot and is not a complete current infrastructure audit.
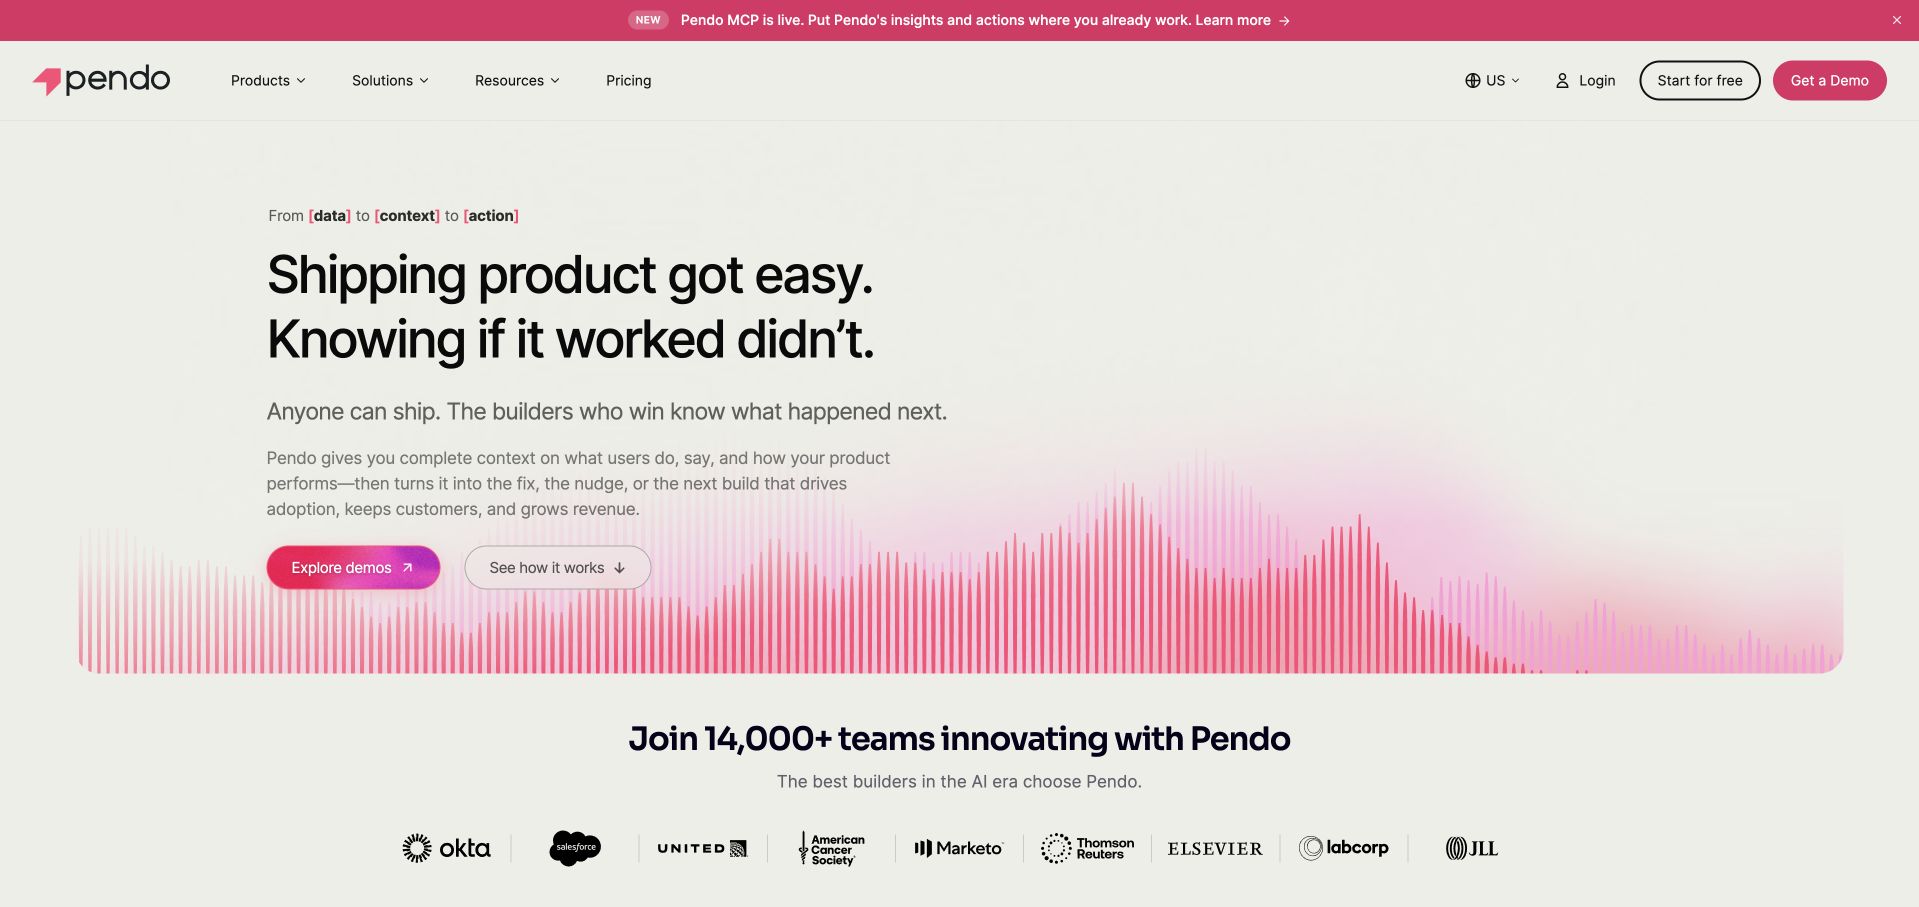
Pendo uses a pale background, a large product-development headline, and a pink graph-like motif along the hero's lower edge. Demo and explanatory actions sit beneath short supporting copy, with customer marks appearing in the next section. The page is restrained compared with a full-screen animated product tour. Its Looker association is a separate business-reporting case: Google Cloud describes Pendo using BigQuery and Looker for reporting across sales, customer success, and marketing. That should not be confused with the implementation of Pendo's own product-analytics features or the rendering of its marketing homepage. The graph treatment illustrates a message rather than proving which software sits behind it.
What you can learn
Describe the measurement question before showing a complex interface. Keep a company's internal business-intelligence stack distinct from the software it sells, and do not let dashboard-like artwork become evidence of an unobserved analytics implementation.
Pros
Large type and a limited pink accent make the product message easy to scan.
Demo and exploratory actions offer distinct next steps before the customer-mark row.
Cons & considerations
A graph-like motif can suggest functionality without explaining the underlying workflow.
The Looker case concerns internal reporting, not every Pendo feature or public page.
Platform source: Primary documented Looker association. Documented association: Business reporting alongside BigQuery; separate from Pendo product-analytics implementation. Platform evidence is separate from the direct website screenshot and is not a complete current infrastructure audit.
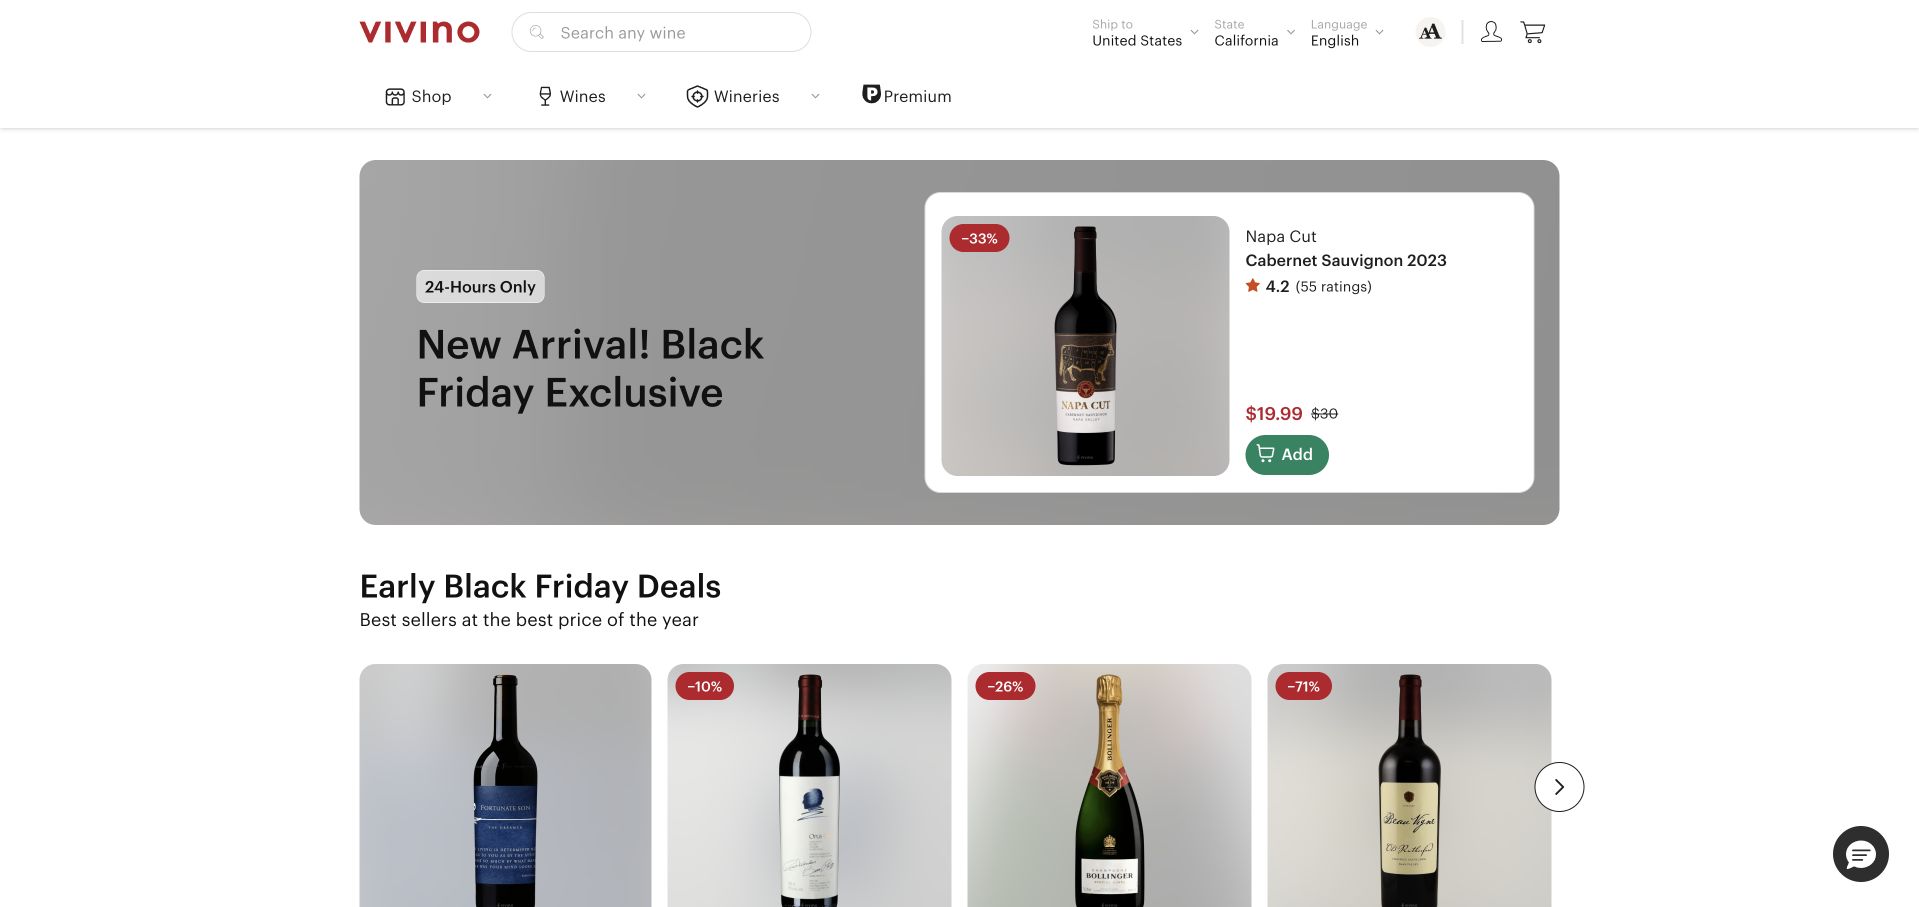
Vivino's captured storefront keeps wine search and category navigation above a compact promotional card and a row of product offers. Bottle photography, prices, ratings, and add controls are organized in repeated cards rather than folded into a long editorial hero. The visible page is a wine-shopping surface, not an employee dashboard. Google Cloud's case describes modeled organizational metrics in Looker over Vivino's Redshift warehouse, bringing together information from several business systems. That documentary association does not mean Looker renders the wine storefront or establishes a complete current commerce stack. The useful design reference is the scannable product presentation and the distinction between a campaign and the broader catalog.
What you can learn
Keep promotions visually separate from the stable product taxonomy. When planning analytics, define the business metrics and permissions behind reporting independently of product-card design, and do not infer warehouse or BI architecture from storefront appearance.
Pros
Repeated bottle cards give price and product information a predictable location.
A compact campaign leaves room for the wider catalog within the first screen.
Cons & considerations
Ratings and discount presentation need clear sourcing and conditions.
The enterprise reporting account does not identify the current storefront rendering or transaction systems.
Platform source: Primary documented Looker association. Documented association: Organization-wide modeled metrics; no inference that the wine storefront is rendered by Looker. Platform evidence is separate from the direct website screenshot and is not a complete current infrastructure audit.
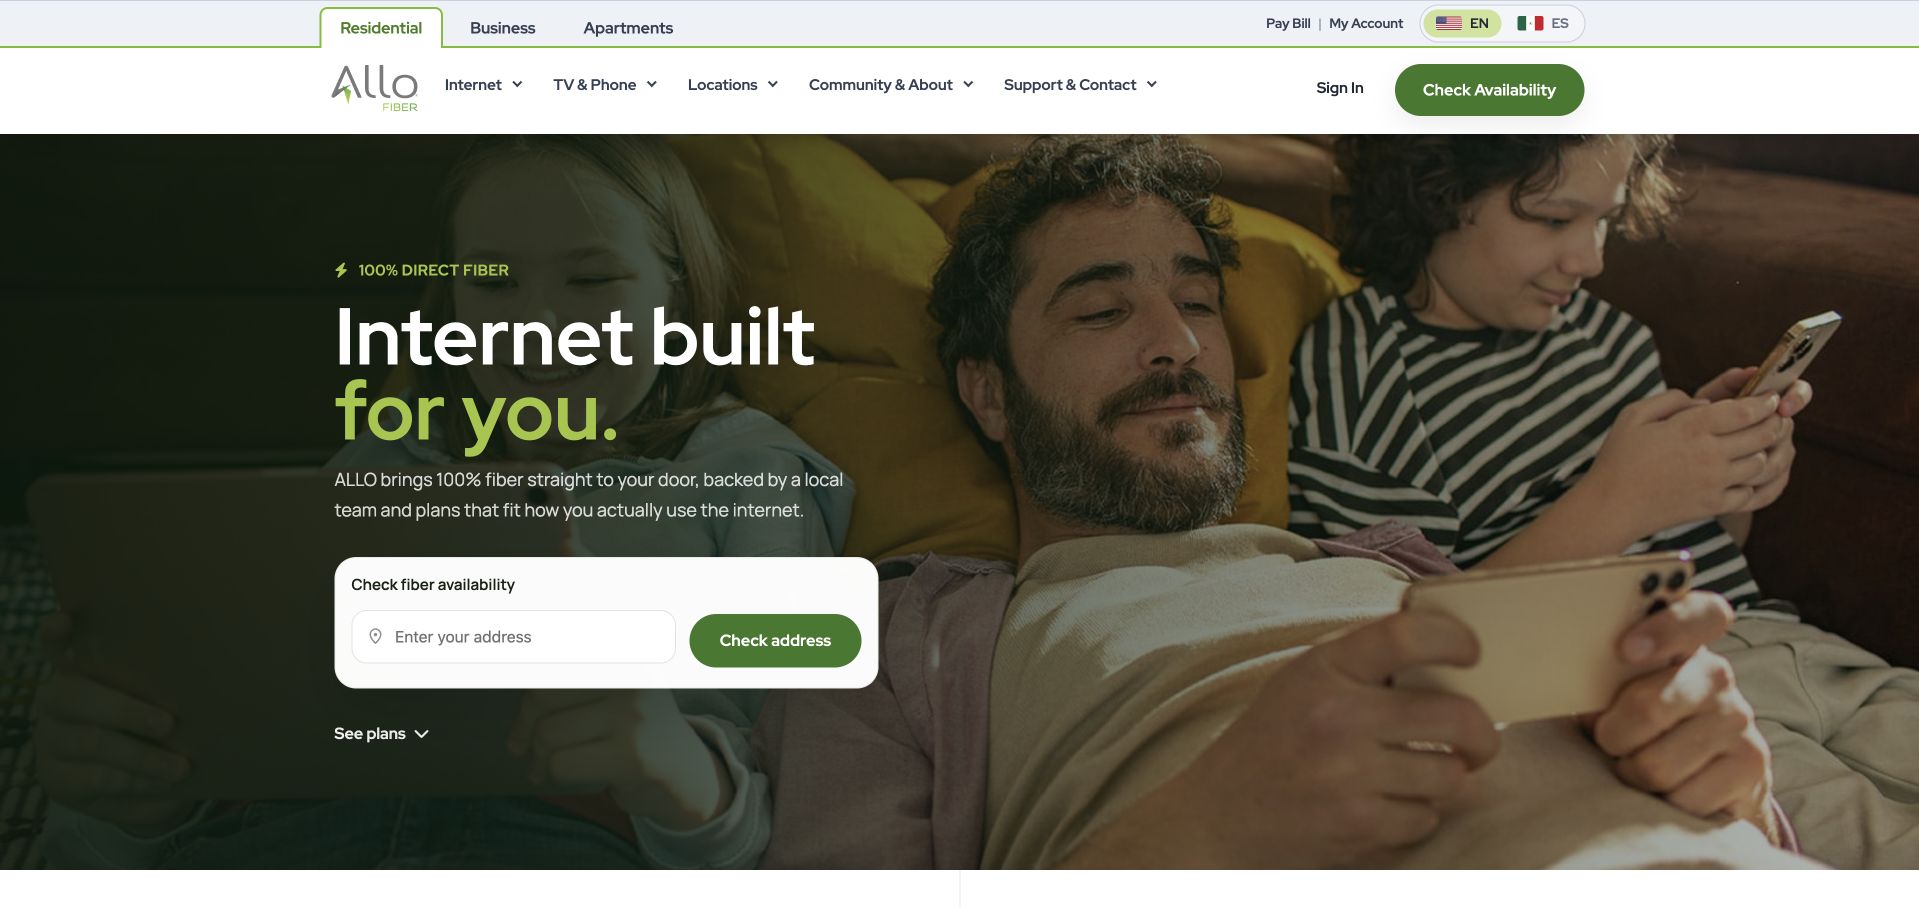
ALLO Fiber uses a dark green residential photograph beside a large service headline and a white address-check card. Residential, business, and apartment audiences have distinct routes above the main navigation, while a separate plans link remains available under the form. The design is useful because eligibility is more important than a generic sales button for this kind of service. Google Cloud documents ALLO's Looker and BigQuery work for internal reporting and conversational analytics. That case does not establish the implementation of this public address lookup, the service-availability database, or the marketing-page frontend. The visible form is a customer-routing interface with its own requirements, separate from organizational BI.
What you can learn
Ask for location when it changes the offer, explain the result, and keep manual support available. Do not assume that an internal analytics story documents the system checking whether an individual property can receive a service.
Pros
The address card gives the opening a useful, concrete eligibility task.
Audience routes distinguish household, business, and apartment contexts.
Cons & considerations
An address result must be clear about what it actually confirms.
The Looker case does not verify availability data or the public lookup implementation.
Platform source: Primary documented Looker association. Documented association: Operational and customer-data reporting; public fiber-service website is a separate surface. Platform evidence is separate from the direct website screenshot and is not a complete current infrastructure audit.
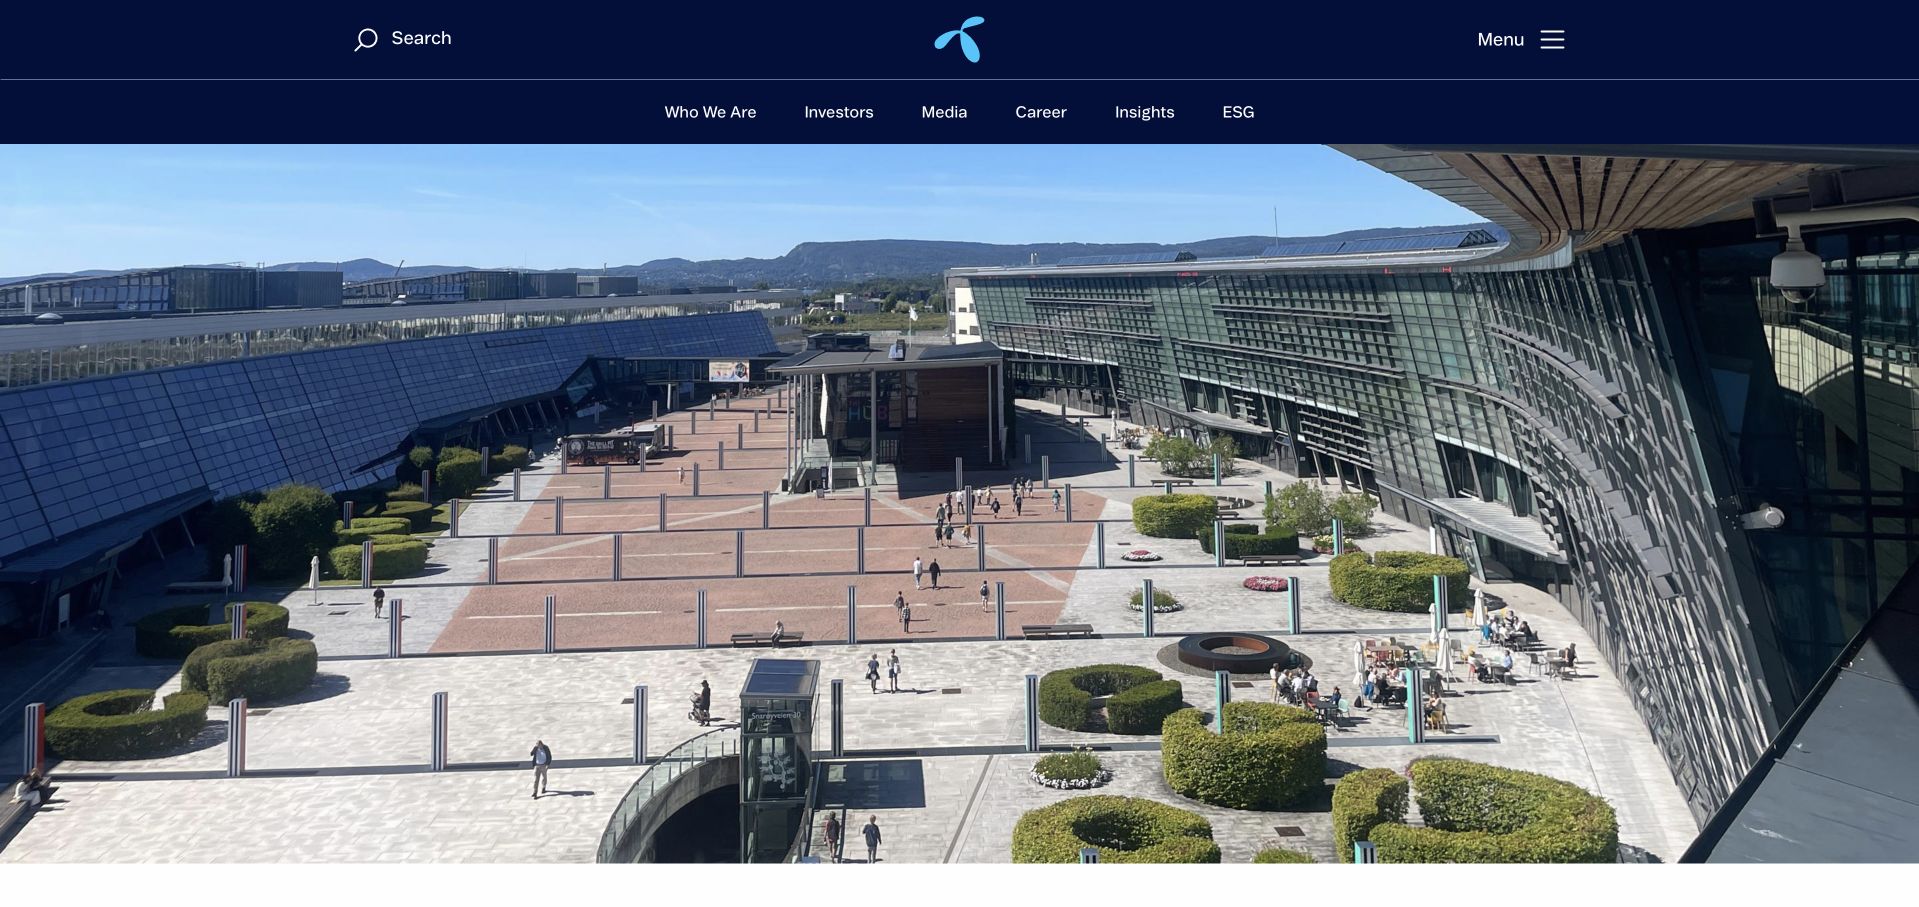
Telenor's group homepage uses a dark navy header and an expansive campus photograph with little overlay copy in the captured view. Company, investor, media, career, insight, and sustainability routes give the image a corporate context rather than a consumer-plan shopping task. The minimal treatment lets the place and brand carry the introduction, but leaves much of the explanation to navigation and subsequent content. Google's Looker case is specifically about Telenor Norway and its self-service analytics approach. It should not be generalized to every Telenor subsidiary, the entire group infrastructure, or the software publishing this public corporate page. The organizational scope is a necessary part of the technology reference.
What you can learn
Keep group-level public content and a subsidiary's analytics workload separate in the brief. A large corporate image can establish context, but audiences still need literal destinations, and technology claims need the exact business unit described by the evidence.
Pros
The navigation clearly identifies corporate rather than consumer-shopping audiences.
A quiet header lets the architectural photograph establish a recognizable setting.
Cons & considerations
The image-led opening supplies little immediate explanation of the organization’s current priorities.
The Norway-specific case cannot establish group-wide or public-frontend technology.
Platform source: Primary documented Looker association. Documented association: Cited telecommunications analytics workload, not an assertion across every subsidiary. Platform evidence is separate from the direct website screenshot and is not a complete current infrastructure audit.
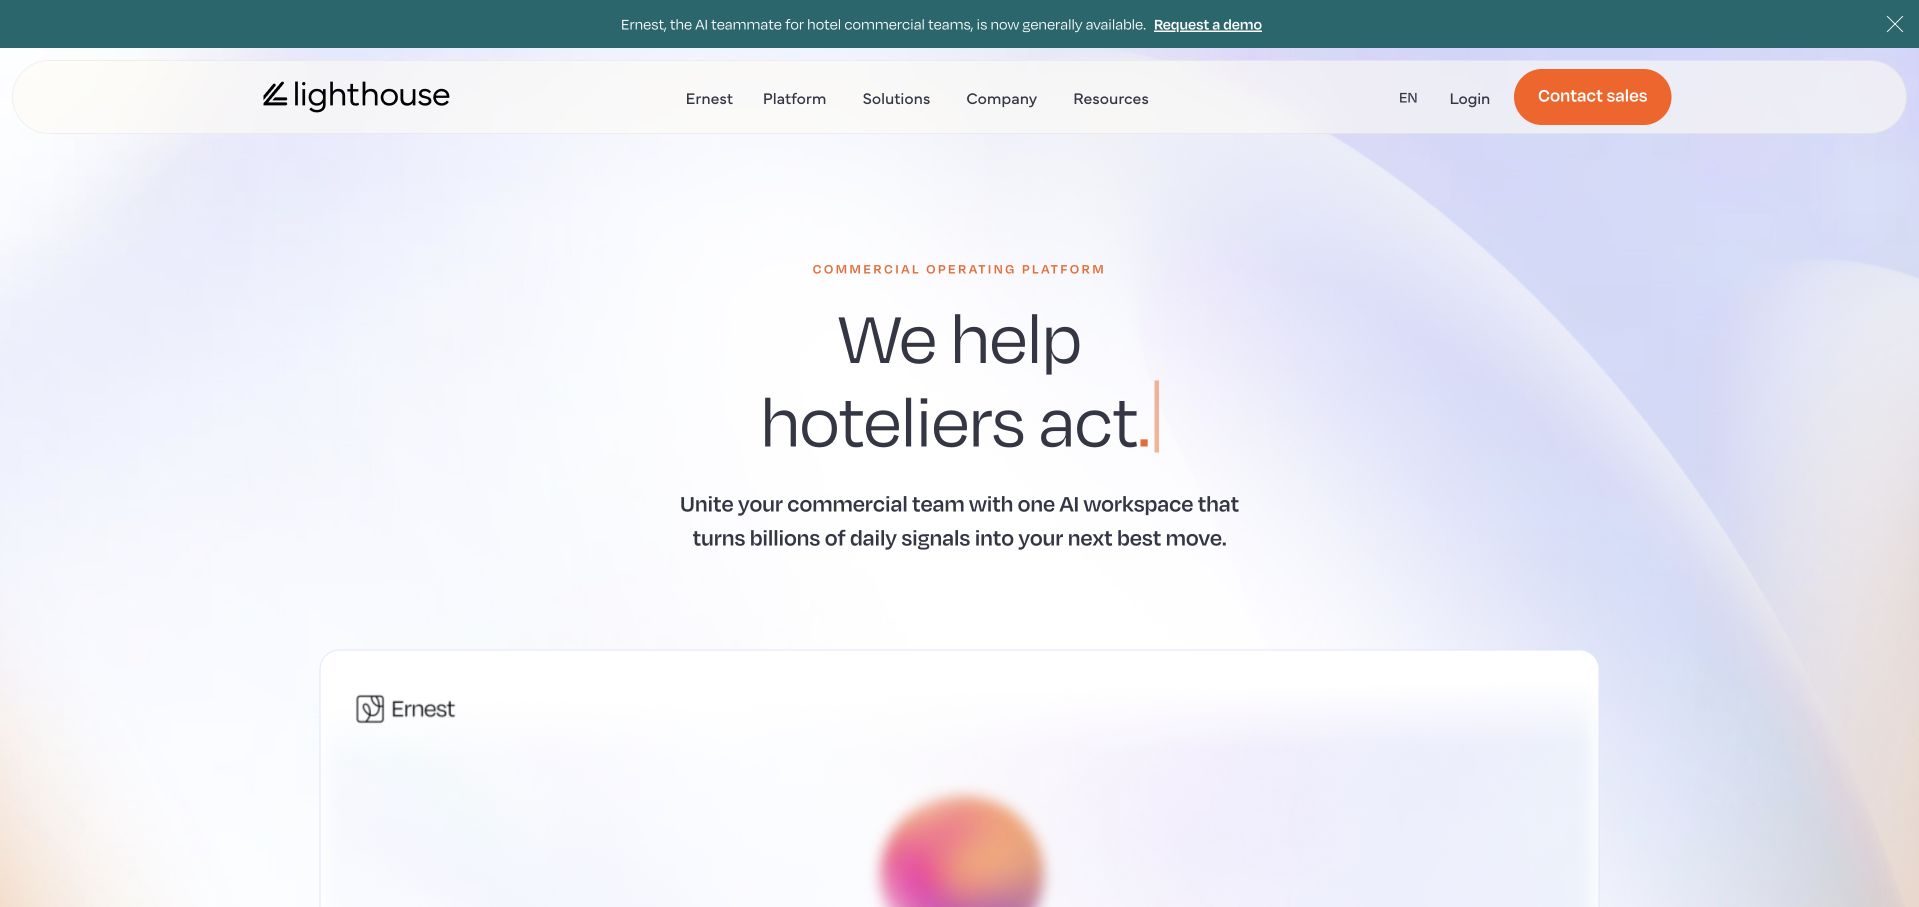
Lighthouse uses a pale gradient background, rounded navigation surface, and a short hotelier-focused headline. A product panel begins below, while an announcement bar introduces Ernest and an orange contact-sales action stays in the header. The result is a calm product-marketing page rather than a dense analytics dashboard. Google Cloud's case describes Looker in Lighthouse's hotel business-intelligence offering, including the BI Pro tier. That is a scoped product-analytics association, not proof that every current Lighthouse feature, the Ernest interface, or the public marketing page shares one implementation. The visible product story and the documented BI workload should remain distinct when borrowing from this reference.
What you can learn
Name the audience and the particular product before describing analytics capabilities. Keep a newly promoted AI interface separate from a documented BI integration unless evidence explicitly connects them, and avoid treating a soft dashboard illustration as runtime detection.
Pros
A concise hotel-industry message makes the intended audience easy to recognize.
The orange sales action remains distinct against the quiet gradient surface.
Cons & considerations
The minimal first screen leaves detailed workflow explanation to later content.
The BI Pro reference does not establish the architecture of every current AI feature.
Platform source: Primary documented Looker association. Documented association: Hotel business-intelligence product; Looker association is scoped to the cited analytics offering. Platform evidence is separate from the direct website screenshot and is not a complete current infrastructure audit.
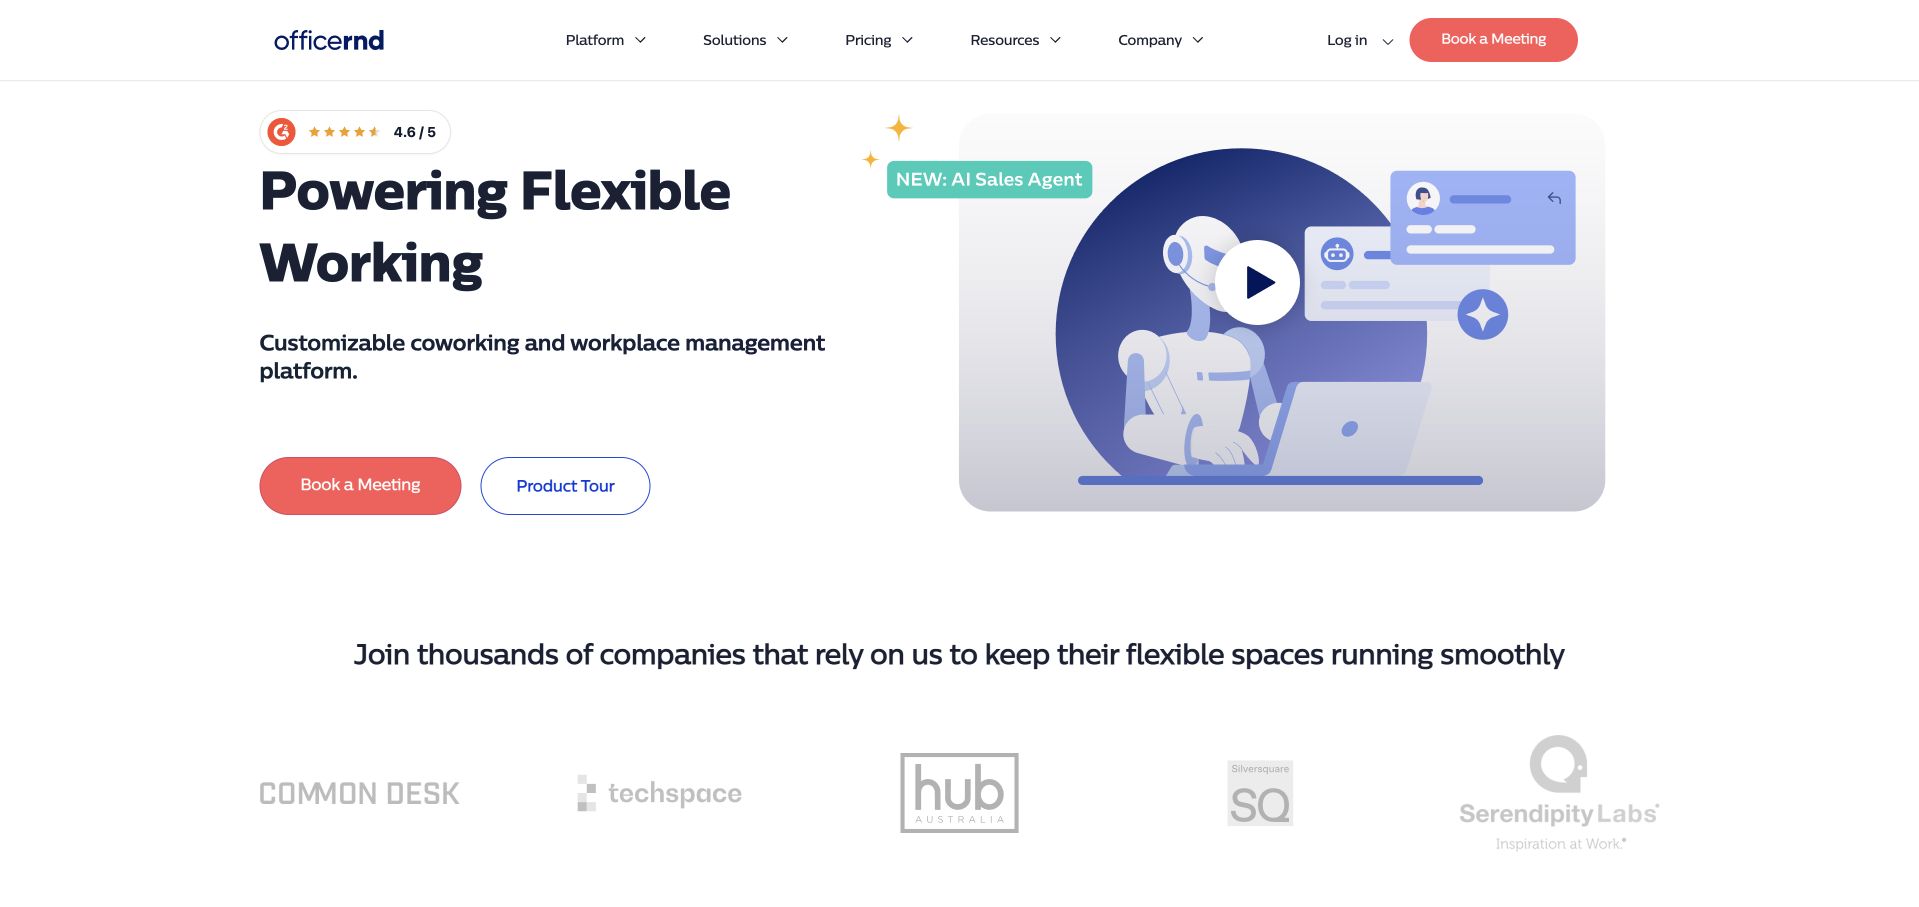
OfficeRnD uses a white hero with a large flexible-working heading on the left and an illustrated AI-sales-agent panel on the right. A coral demo control and outlined product-tour action give visitors different levels of commitment, while customer marks appear directly below. The navigation separates platform, solutions, pricing, resources, company, login, and sales tasks. Google Cloud documents OfficeRnD's central reporting platform and embedded Looker analytics, including a wrapper using the Looker API. That source concerns a particular analytics layer, not proof that the illustrated agent or marketing-page frontend is generated by Looker. The public screenshot is useful for product communication and action hierarchy.
What you can learn
Separate exploratory product education from a sales conversation. For embedded analytics, define the reporting audience and integration boundary explicitly; a customer-story architecture should not be extended to unrelated features simply because they appear on the same product homepage.
Pros
Demo and product-tour actions provide clearly different next steps.
A restrained illustration leaves the service audience and headline readable.
Cons & considerations
An AI-agent illustration does not explain the full workspace-management workflow.
The embedded reporting case does not identify the public marketing or agent implementation.
Platform source: Primary documented Looker association. Documented association: Central business reporting and embedded analytics; not proof of the marketing frontend. Platform evidence is separate from the direct website screenshot and is not a complete current infrastructure audit.
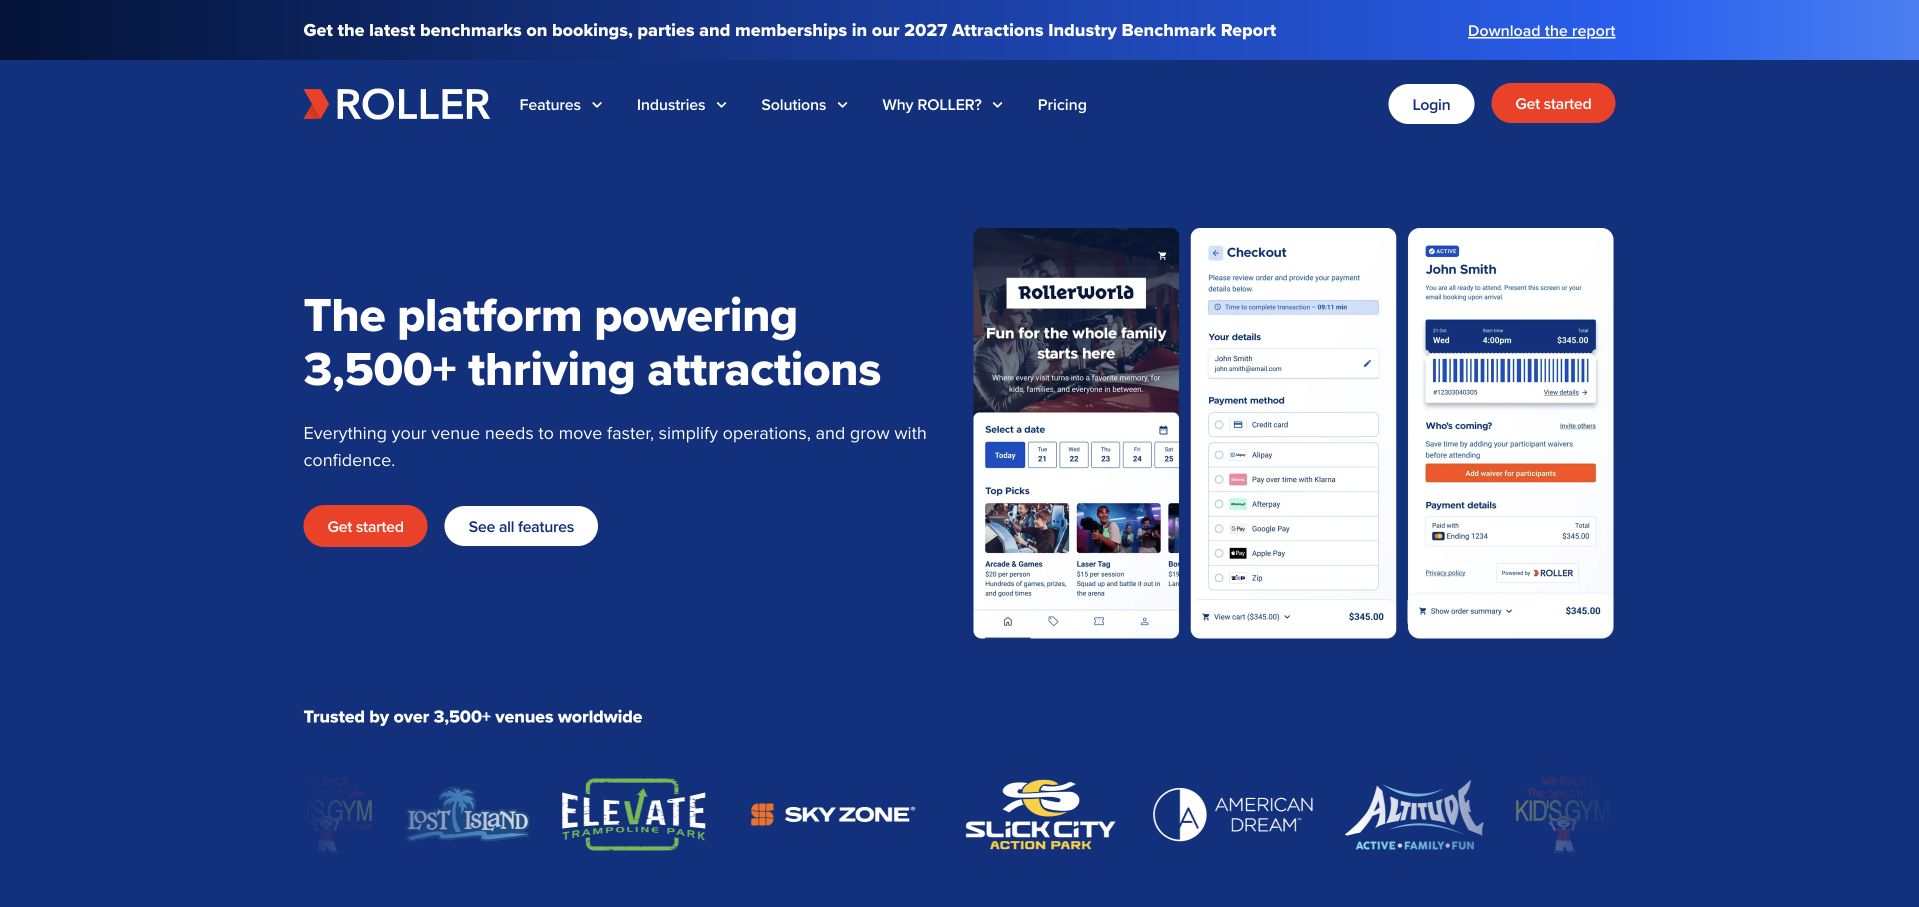
ROLLER uses a solid blue hero with a large venue-management statement on the left and three overlapping interface panels on the right. Red get-started and white feature actions stay beneath the copy, with venue marks forming a separate lower row. A slim benchmark-report strip sits above the header. Three panels communicate several operational surfaces without showing a full application screen. Google Cloud's case documents embedded venue analytics and Looker API use for ROLLER's conversational reporting offering. That is not proof that the visible checkout, booking, or customer mockups are Looker interfaces, nor that Looker renders the public homepage.
What you can learn
Use a small set of interface panels to explain product breadth, but label demonstrations accurately. Keep the reporting integration boundary separate from transaction and customer workflows, and do not equate a public mockup with evidence of the underlying runtime.
Pros
The solid blue surface gives the headline and actions a stable reading area.
Three focused panels communicate product breadth more clearly than a tiny full-app screenshot.
Cons & considerations
Overlapping panels need careful scaling to avoid unreadable interface labels.
The analytics case does not establish the implementation of the depicted transaction workflows.
Platform source: Primary documented Looker association. Documented association: Embedded venue analytics documented by Google Cloud; public product site is separately reviewed. Platform evidence is separate from the direct website screenshot and is not a complete current infrastructure audit.
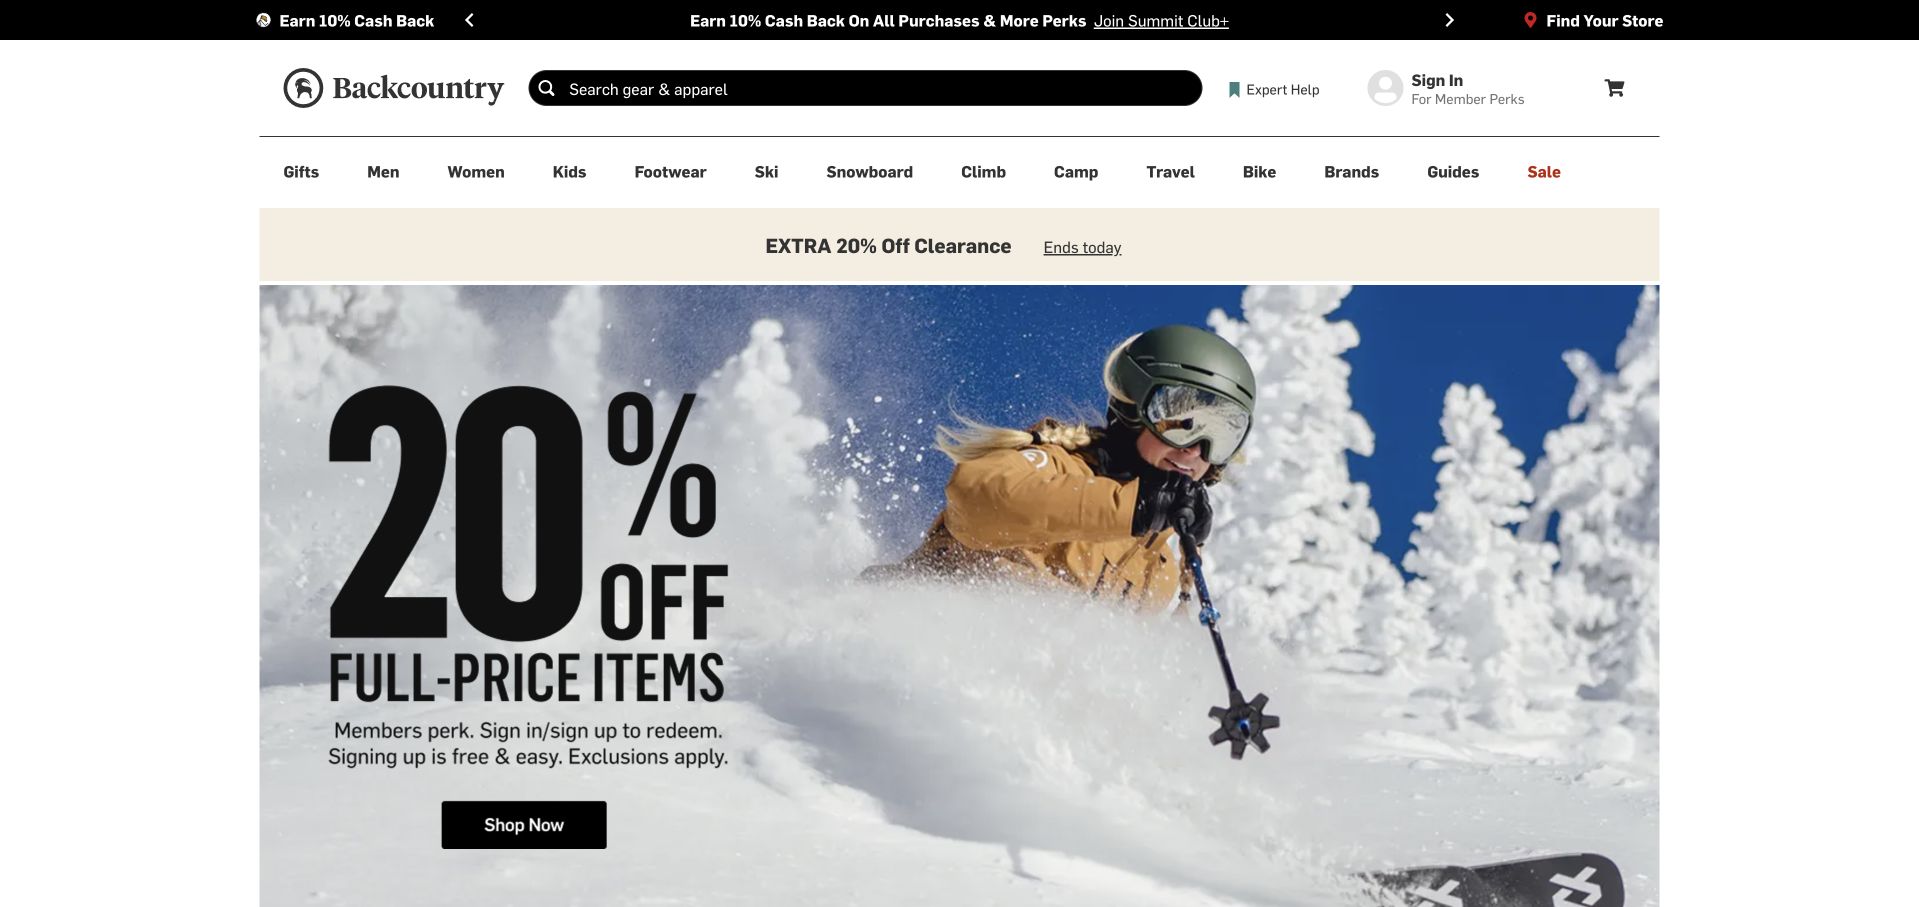
Backcountry's captured storefront places a large ski photograph and membership-discount message beneath persistent search and activity-based navigation. A separate clearance band sits above the hero, while store discovery, expert help, sign-in, and the cart remain in the header. The design gives the campaign strong emphasis without removing the stable catalog structure. In a May 30, 2024 Google Cloud article, Backcountry's CTO described analytics running on Looker with data in BigQuery. That dated organizational reporting association is not proof that Looker renders the storefront, handles membership pricing, or implements the current search. The photograph and navigation are independently inspected public design references.
What you can learn
Keep campaign terms distinct from the product taxonomy and account actions. Use the documented analytics workload to discuss reporting requirements, not to infer the software behind a current promotion, search box, or transaction flow.
Pros
Persistent search and activity categories remain visible above the large promotion.
Account, store, and expert-help routes are separated from the main campaign action.
Cons & considerations
Two promotional bands compete before the visitor reaches the product catalog.
The 2024 analytics article does not establish current storefront or membership-system implementation.
Visible tech stack
Earlier / documented evidence
Looker
Platform source: Primary documented Looker association. Documented association: May 2024 CTO-authored account explicitly describes analytics running on Looker alongside BigQuery; historical enterprise workload, not current storefront rendering. Platform evidence is separate from the direct website screenshot and is not a complete current infrastructure audit.
King's captured homepage gives a colorful Candy Crush scene most of the first screen, with the game identity large at the center. The white header keeps home, games, jobs, gift-card, and community routes visible without competing with the illustration. This is a useful example of a brand world doing the introductory work rather than a long company paragraph. Google's June 6, 2019 acquisition announcement named King among joint Google Cloud and Looker customers. That historical association supports a dated enterprise-analytics reference only. It does not establish the current game client, player-data systems, public website framework, or the implementation of the large illustrated hero shown here.
What you can learn
Use recognizable creative assets for orientation while keeping essential navigation literal. Preserve the date and limited scope of a technology reference, especially when a corporate analytics story is years older than the public page being reviewed.
Pros
The flagship game identity gives the page an immediately recognizable visual subject.
A simple white header keeps company and game-related routes distinct.
Cons & considerations
A single property can overshadow the wider games portfolio.
The 2019 customer mention cannot establish the current public or game-runtime stack.
Platform source: Primary documented Looker association. Documented association: Google named King as a joint Looker customer in June 2019; historical association only. Platform evidence is separate from the direct website screenshot and is not a complete current infrastructure audit.
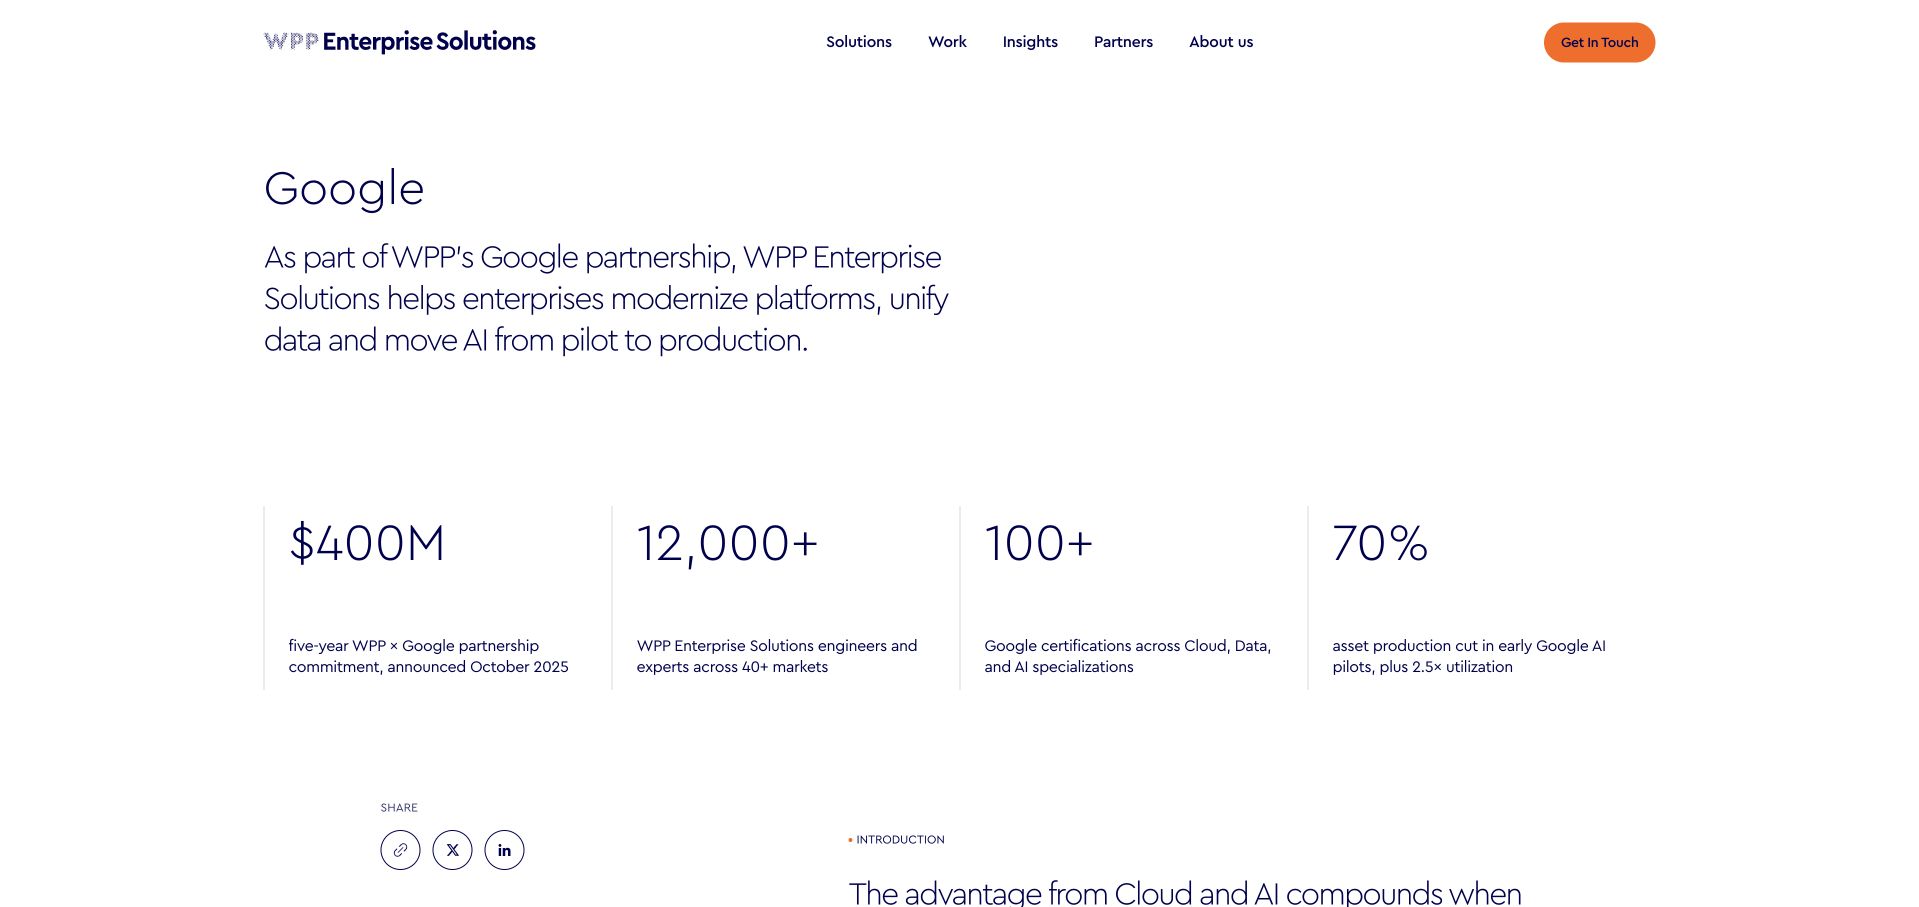
WPP Enterprise Solutions uses a white partner page with a short Google introduction, an orange contact action, and four evenly spaced metric blocks. The restrained layout leaves the relationship explanation readable without a large stock photograph or dashboard illustration. Further content on the same primary page explicitly describes building enterprise data platforms with BigQuery, Looker, and Spanner. This is documented partner capability, not a customer-adoption claim that every WPP company uses Looker internally, and not evidence that Looker publishes the partner page. The screenshot is useful for studying a focused partnership destination whose content and technology reference can be scoped to one directly stated service capability.
What you can learn
Describe a partner's actual capability rather than converting it into a blanket customer or runtime claim. Keep metric sources and timeframes clear, and let the partnership explanation remain useful even when promotional figures change.
Pros
The sparse layout gives the partnership description a clear reading hierarchy.
A four-block row organizes supporting company context without a long paragraph.
Cons & considerations
Large promotional figures need explicit sources and timeframes.
Partner capability does not establish organization-wide adoption or the public-page technology.
Platform source: Primary documented Looker association. Documented association: WPP describes building enterprise data platforms with Looker; partner capability is not proof that its public page runs Looker. Platform evidence is separate from the direct website screenshot and is not a complete current infrastructure audit.
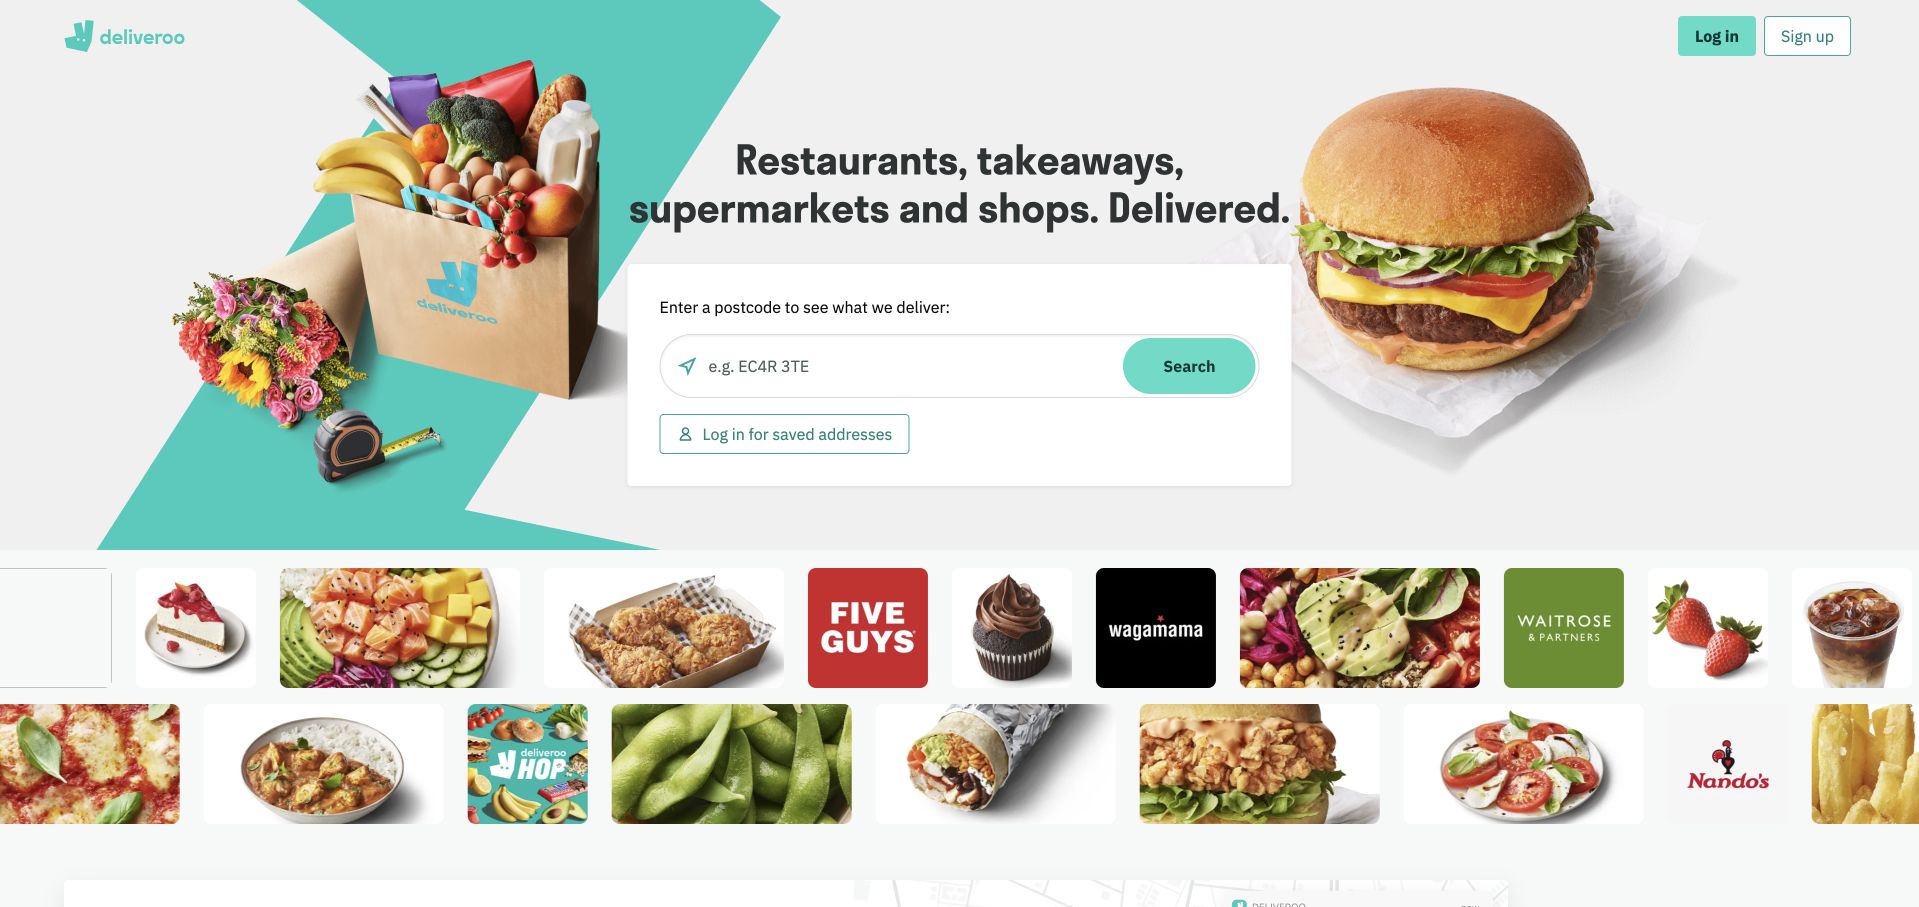
Deliveroo places a postcode or delivery-address search between grocery and burger imagery, with a short delivery-category heading above. Restaurant and store marks form a separate row below, making the range visible without replacing the address task. Login and signup remain compact in the header. The relevant catalog depends on location. The Fivetran customer story separately identifies Looker as Deliveroo's business-intelligence tool over Snowflake data. That documentary reporting association does not identify the technology rendering this public search interface, determine the current delivery catalog, or establish a complete commerce stack. The customer-facing address task and employee analytics workload are separate design and architecture questions.
What you can learn
Make the location dependency explicit before offering an irrelevant catalog. In the analytics brief, define business metrics and data access independently of the public address finder rather than treating a BI customer story as evidence of its implementation.
Pros
The address field gives a broad marketplace offer a concrete first task.
A separate brand row communicates catalog breadth without crowding the search card.
Cons & considerations
The result must make delivery-area and availability limits understandable.
The business-intelligence case does not establish the current public search or ordering runtime.
Platform source: Primary documented Looker association. Documented association: The Fivetran customer story explicitly names Looker as Deliveroo BI; documentary workload, not current frontend detection. Platform evidence is separate from the direct website screenshot and is not a complete current infrastructure audit.
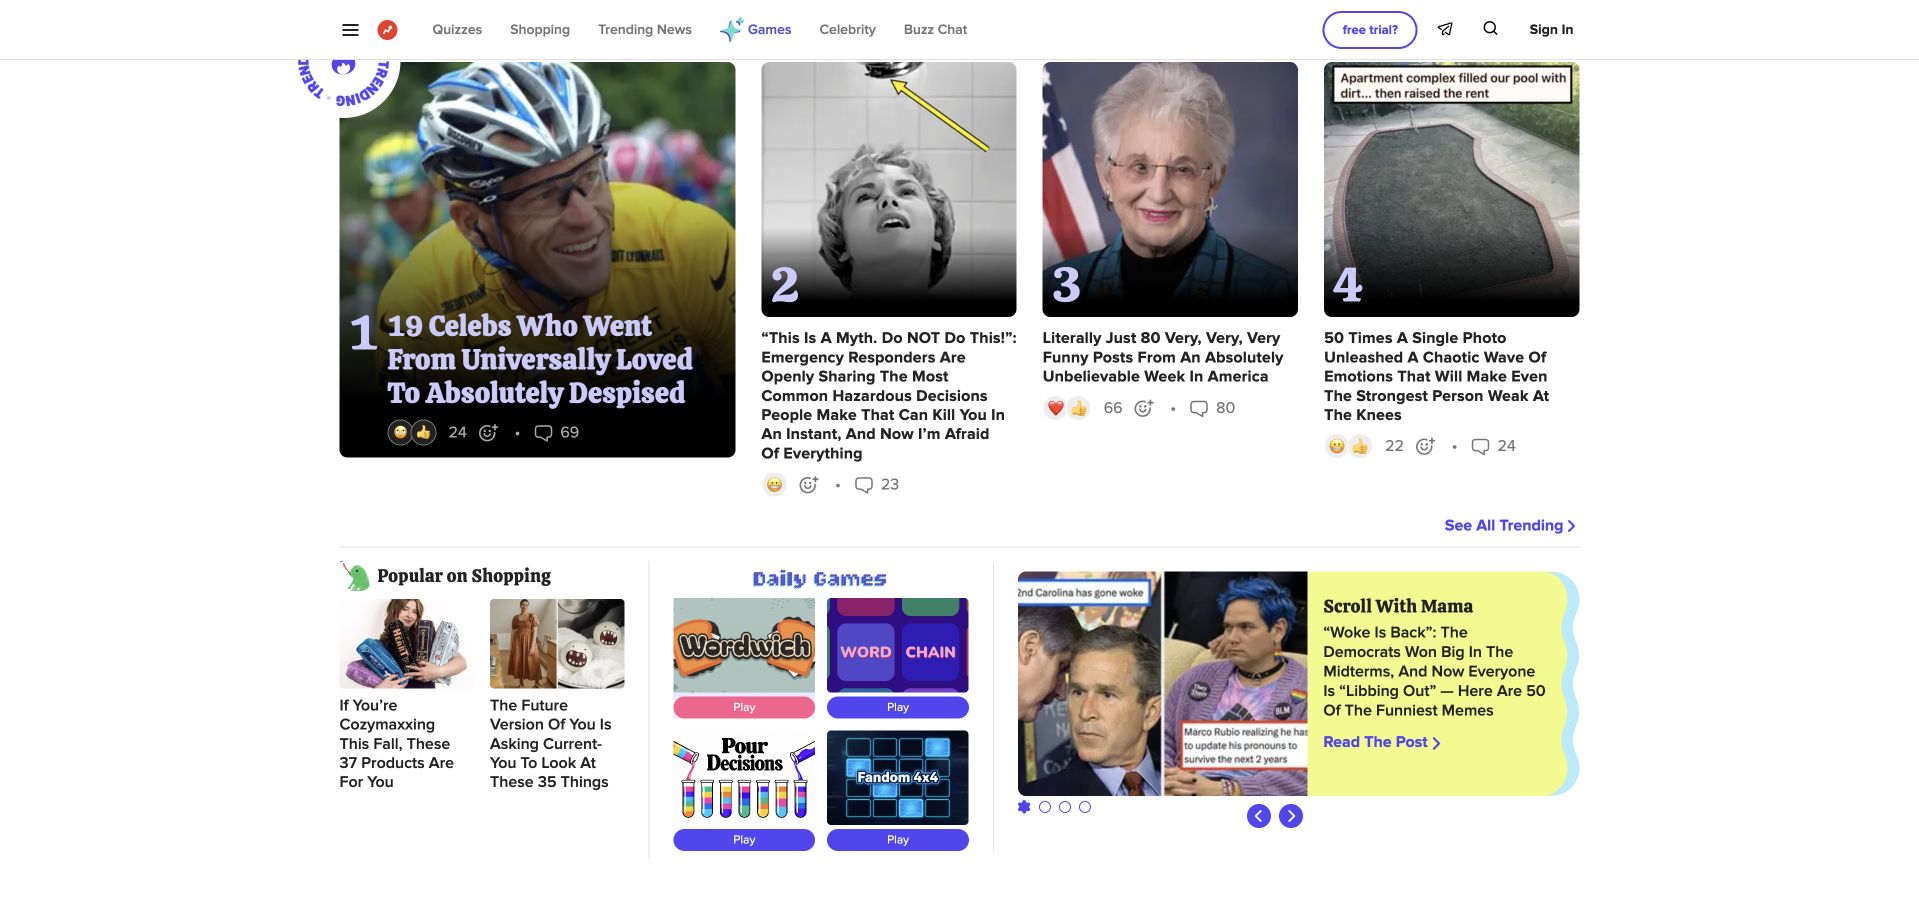
BuzzFeed's captured page uses a header above numbered story cards and smaller rows for shopping, games, and editorial discovery. Images and headlines carry most of the hierarchy, with small reaction and engagement controls beneath some cards. The design is useful for studying density and multiple browsing intentions rather than a single hero action. Google named BuzzFeed as a joint Google Cloud and Looker customer in its June 6, 2019 acquisition announcement. That dated enterprise association does not establish the current publishing CMS, recommendation system, engagement-counter storage, or public frontend. The visible media layout is a separate observation from the historical business-analytics evidence.
What you can learn
Give each discovery mode a readable structure instead of relying on visual density alone. Keep historical analytics references dated, and do not interpret public reaction controls or article cards as evidence of which reporting platform the organization currently uses.
Pros
Different card sizes distinguish major trending stories from secondary discovery rows.
The header leaves substantial room for editorial content rather than a large promotional hero.
Cons & considerations
Dense headlines and small engagement details need a carefully prioritized mobile layout.
The 2019 customer mention cannot identify the current editorial or recommendation infrastructure.
Platform source: Primary documented Looker association. Documented association: Google explicitly named BuzzFeed as a joint Looker customer in June 2019; historical enterprise association only. Platform evidence is separate from the direct website screenshot and is not a complete current infrastructure audit.
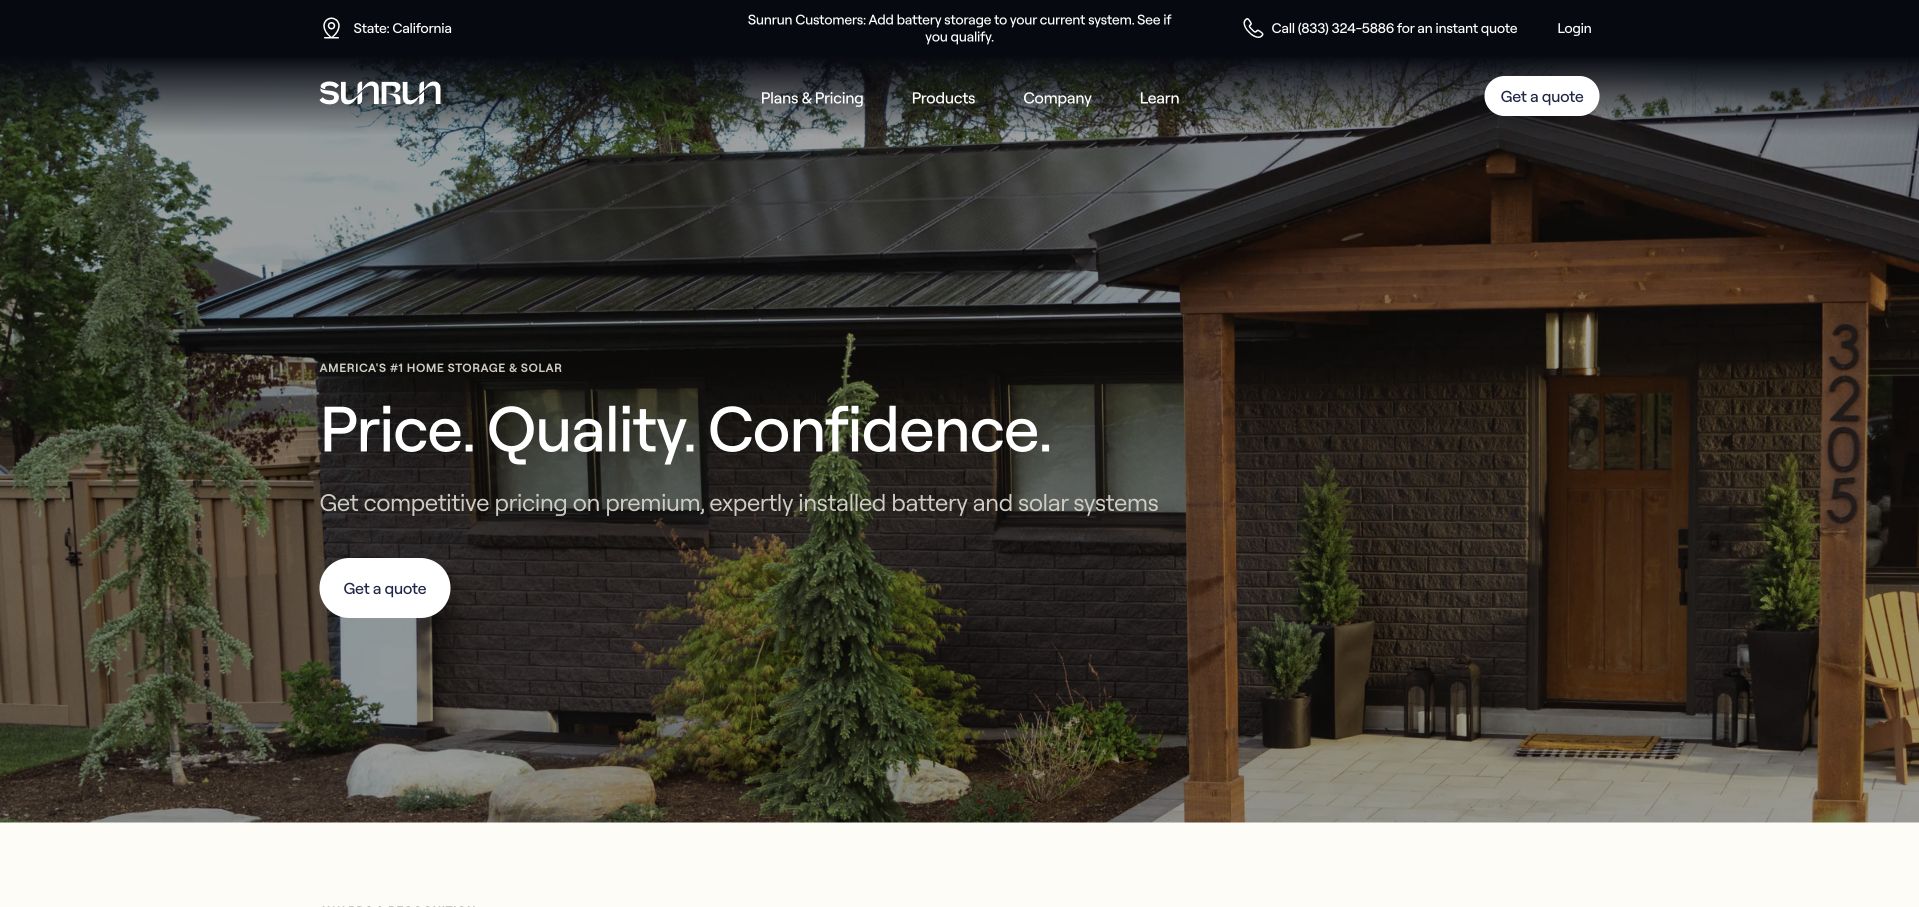
Sunrun uses a large house-and-roof photograph behind a short white headline and a compact quote action. The dark header separates products, company information, learning, login, telephone, and quote routes, while a state label makes the captured regional context visible. The photograph creates a domestic setting without putting a full product catalog into the first screen. Google's August 2020 conference article separately describes Sunrun's modernization using Looker and BigQuery. That historical enterprise reporting reference does not establish the current marketing-page runtime, installation systems, quote calculations, or outcomes for an individual household. The screenshot is a public service-design reference, not a recommendation about solar products or financial benefits.
What you can learn
Keep the quote action distinct from product education and explain regional context. Preserve the historical date of the analytics source, and do not turn a company architecture story or appealing home image into a promise about household results.
Pros
The short headline and small quote action keep the first-screen task focused.
Regional and telephone context remain visible in the header.
Cons & considerations
A broad introductory message leaves detailed scope and conditions to later content.
The 2020 reporting account does not identify current quote or public-frontend implementation.
Platform source: Primary documented Looker association. Documented association: The 2020 Next session describes Sunrun Looker and BigQuery modernization; historical enterprise scope. Platform evidence is separate from the direct website screenshot and is not a complete current infrastructure audit.
Kegan has 15+ years of experience working with small businesses, Fortune 500 companies, and everything in between. No development job is too big or too small: he brings the same hands-on attention to a focused improvement, a complete website, or a custom application.
For Looker projects, he can help with reporting requirements, data connections, metric definitions, embedded dashboards, access boundaries, validation, and maintainable handover. He works directly with clients on scope, design, implementation, testing, and handover, with an emphasis on clear communication and a system that remains practical to maintain after launch.
Show 3 other Looker developersHide other Looker developers
Begin with a small group of employees, a defined source and a recurring question. Write down the measure definitions and access boundaries before expanding the audience. Keep the initial report narrow enough that its owner can explain and reconcile the figures. Design the navigation around decisions rather than replicating the source system’s table names.
Analytics within a customer application
If customers need reporting inside an existing product, plan the relationship between application identity and analytical access. Identify the supported embedding approach and who owns authentication, permissions and session behavior. The customer should not need to understand the implementation to recognize what account, reporting period and data scope they are viewing.
Inventory the dashboards people actually use and the definitions they disagree about. Choose a small replacement set with an agreed comparison period. Avoid treating the work as a pixel-for-pixel recreation of every old chart: preserve valuable decisions and reconciliations, retire redundant outputs deliberately, and give consumers a clear route to explain discrepancies.
From references to requirements
Plan the model, the audience and the operational handoff
Make a metric brief before a dashboard brief
For each initial question, specify the unit being counted and the time being measured. A customer count, an active account and a billed organization may all be useful, but they are not synonyms. Describe how test records, cancellations, refunds and late corrections affect the result. Use a short worked example that a business reviewer can understand without inspecting a query. Keep that example with the project documentation so later changes can be checked against the original intention.
Then design the reading journey. Decide which number is the entry point, what comparison makes it meaningful and what detail the reader needs next. A large total without context can look impressive while answering very little. Show the reporting period and relevant filters clearly. When a source is late, give the reader an understandable state rather than silently presenting yesterday’s data as current. Avoid promising real-time reporting unless the complete source-to-display process supports the requirement.
Finally, assign review responsibility. Name the person who can approve a changed definition and the person who investigates a reconciliation failure. Let a pilot succeed through correct, explainable answers before increasing the number of dashboards. A broad catalog of charts is not a substitute for a small reporting area that people trust.
Define identity and session boundaries for embedding
Draw the route from the host application’s login to the report the user is allowed to see. Identify the intended product and edition first; do not assume an embedding entitlement from a similarly named Google reporting tool. Review the current supported approach with the implementation owner. The application’s ability to display a dashboard is only one part of acceptance: it must also give the right person the right analytical scope and a useful response when access is unavailable.
For signed embedding, Google’s documentation describes server-generated URLs and required configuration. Keep signing material and privileged credentials on the server, not in public browser code. The create-signed-URL API also documents single-use behavior; do not treat a generated URL as a permanent reusable asset. Keep the implementation aligned with the actual supported interface rather than editing the returned URL as a shortcut.
Test a small, explicit matrix of account states: an ordinary authorized user, someone without the required access, an expired session and a user switching between permitted contexts. Include the surrounding application’s navigation and error messages in the review. A chart that loads for an administrator is not evidence that the customer experience is correct. Record who owns the host application and who owns the analytical permissions so an access incident has a clear route to resolution.
Make the delivered experience explainable and maintainable
Evaluate the report as a product surface, not just as a collection of visualizations. Test readable labels, usable filters, keyboard navigation and narrow-screen behavior with the actual content. A dashboard built for a wide monitor may need a different composition inside an application panel. Provide enough surrounding text to explain what the figures mean and what action is appropriate. Do not make color the only way to distinguish an important state.
Agree on a performance budget using representative data and common user journeys. Test the normal view, a longer reporting period and a deliberately awkward filter combination. Record whether a slow result is caused by the source, the model or the interface before changing the visual design. Keep diagnostic detail out of public error messages, but give operators enough context to investigate the affected report.
The handoff should include definitions, source dependencies, access ownership, test accounts, known limits and a change procedure. When an upstream field changes, maintainers need to know which reports depend on it and how to pause an unreliable output. Preserve a comparison set for future revisions. A successful launch means that someone other than the original author can explain the report, identify its boundary and recover it when the numbers or access behavior are wrong.
A useful handover demonstration
Ask the actual team to carry out its routine job: publish a realistic update, correct a mistake, preview a narrow screen, and identify who owns an integration failure. For a library or frontend framework, also ask who maintains the content source and deployment. A polished screenshot does not answer those operational questions.
Beyond the screenshot
Looker project planning checklist
Name the first decision the report must support.
Define the unit, period and exclusions for each measure.
Distinguish exploratory calculations from reviewed business definitions.
Confirm Looker rather than assuming Looker Studio is equivalent.
Identify the deployment and current embedding entitlement.
Separate host-application identity from analytical permission design.
Keep privileged credentials and signing material server-side.
Test ordinary, unauthorized and expired-session states.
Show the reporting period and source freshness clearly.
Review filters, contrast, keyboard use and narrow layouts.
Keep a reconciliation example and representative performance tests.
Assign definition, access, change and recovery owners.
Test with real content, a keyboard, a small screen, slow or failed requests, and the people who will maintain the system. These are planning checks, not an accessibility, security, performance, or search-ranking certification.
Sources & editorial method
How this Looker collection was reviewed
The collection contains 20 independently reviewed public interfaces and separately checked primary associations. Historical dates, product boundaries and organization-specific scopes are retained. Recommendations are original project-planning guidance, not performance benchmarks or claims of complete backend visibility.
Every image is an unmodified capture from the actual website, with its source and capture date. Some captures are reused from our shared catalog; their dates remain the original capture dates. None comes from a vendor gallery or a generated reconstruction. Moving imagery and live content can change.
Technology attribution uses public page assets or metadata, official platform documentation, or a cited first-party project case study. Documentary and framework-relationship evidence is identified where used; it is not a complete current backend inventory. A CMS image CDN alone does not establish a full CMS deployment. A library’s presence does not prove which individual controls use it, and a platform label does not establish AI authorship.
The composition notes, lessons, pros and tradeoffs are original editorial observations. We have not measured conversion, traffic, security, performance or accessibility conformance. Website owners retain their brands and imagery; these examples are not our client portfolio. Written, Edited and Curated are independent records, not dates advanced by a build. See our editorial standards or suggest a correction.
Questions worth asking
Looker website development FAQs
Are these 20 marketing sites built with Looker?
No such claim is made. Their public designs are reviewed alongside documented analytics associations. Some sources concern internal reporting, others embedded offerings or historical use. Those sources do not establish a complete current public-page implementation.
Is Looker the same as Looker Studio?
No. Identify the actual product, deployment and requirements before writing a brief. Similar branding does not make their modeling, administration or embedding arrangements interchangeable.
Should we begin by copying a famous customer’s dashboard?
Begin with your own question, source definitions and audience. A customer story may suggest useful questions, but it cannot establish the right access model or reporting definitions for a different organization.
Can a signed embed URL be treated as a permanent public link?
No. Follow the documented server-side generation and session approach for the intended implementation. Google’s API reference describes single-use behavior; do not reuse or edit generated URLs as an improvised publishing method.
What matters after the dashboard first loads?
Reconcile the numbers, test the intended access states, review the actual interface and document ownership. The handoff needs enough context for another maintainer to understand the definitions and recover a failed report.
Start with one question, agreed definitions and a clear audience. Expand only when the report is useful, its permissions are understood and someone owns its continued accuracy.