Best Power BI Websites of 2026 (20 Real-World Examples)
Public website references paired with documented Power BI reporting workloads.
Study 20 public interfaces and the different analytical projects associated with their organizations. Power BI reporting evidence is not a claim that these marketing sites are generated by Power BI.
Walmart, T-Mobile, Nestlé, Rio Tinto and Reckitt open this collection. The screenshots concern corporate and consumer communication; the Microsoft sources concern particular finance, supply-chain, customer-management or marketing workloads. A recognizable name makes the distinction more important, not less: a subsidiary case does not establish a group-wide implementation.
Several examples use historical conference material, including pandemic-era reporting. Cerner’s case predates its Oracle acquisition, and Aston Martin’s source dates to 2017. Those associations are retained as dated context, not relabeled as fresh runtime detection. Use the public designs for interface lessons and the project guidance below to frame your own reporting requirements.
Before the examples
What makes good Power BI website development in 2026?
Start with the audience and sharing boundary
An employee report, a customer portal and a genuinely public visualization are different products. Decide who should see the data before choosing an embedding route. A report that displays successfully is not automatically safe to publish. Write down the intended audience, the owner approving access and the behavior expected when permission is absent.
Define measures before decorating them
Agree on the meaning of an order, a customer, revenue and the reporting period before styling cards or charts. Name the source of truth and the reconciliation process. A polished report can still be wrong if its filters, time conventions or exclusions differ from the business question people think it answers.
Keep the public page and the reporting workload separate
A retailer can use Power BI internally while its storefront relies on a different frontend and commerce stack. The references here demonstrate that separation. Do not turn a customer story into a universal architecture claim, and do not copy a large organization’s implementation simply because its name is familiar.
The collection · 20 examples
20 Power BI website examples worth studying
Exactly 20 public design references, with workload scope and historical context kept alongside the documentary evidence.
We start with five recognizable brands or organizations: Walmart, T-Mobile, Nestlé, Rio Tinto, Reckitt. Each attribution applies to the named website property, not every product or website belonging to its organization. This is a curated reading sequence, not a measured ranking.
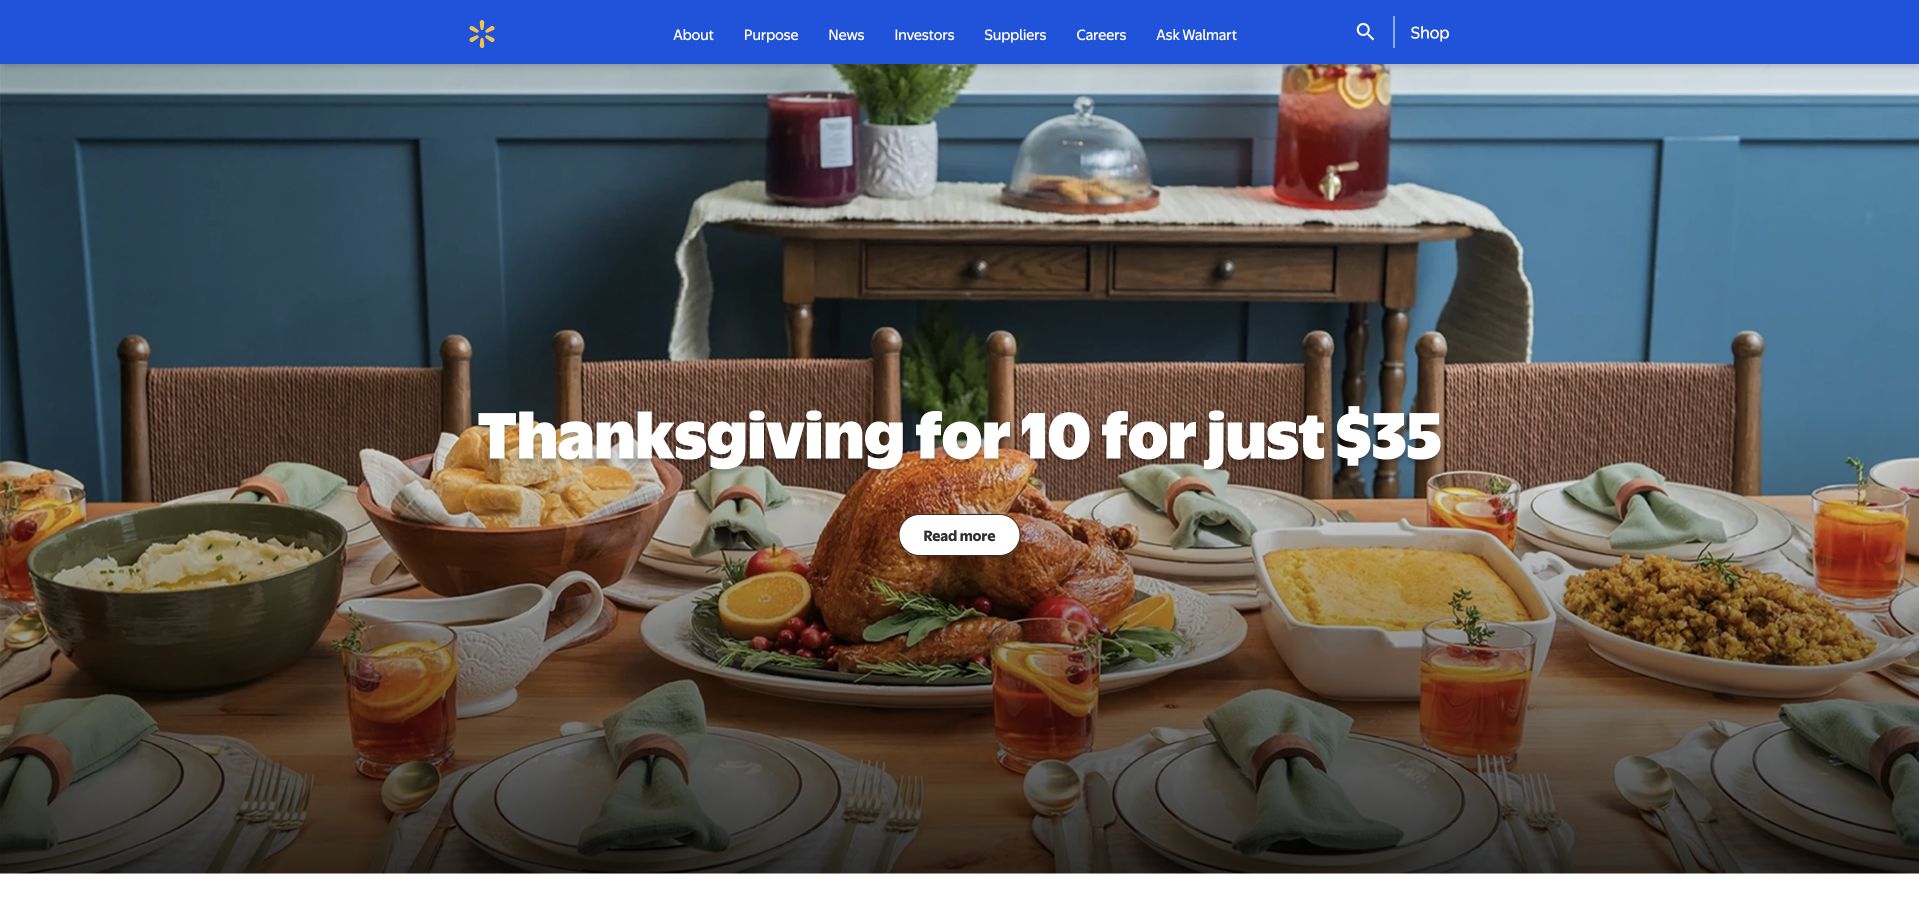
Walmart’s corporate homepage leads with a holiday-table photograph rather than an aisle of products. The broad image and overlaid story introduce a seasonal subject, while a compact blue-and-white header supplies the recognizable corporate frame. Its audience is not quite the same as the retail store’s: company information, news and organizational priorities belong here, not a cart-first shopping journey. The large photographic opening makes that editorial choice visible before the smaller stories below. Microsoft’s October 2022 account concerns finance reporting with Power BI; it does not identify the technology rendering this corporate page.
What you can learn
Give a corporate homepage one timely story, but make the permanent routes independent of that story. A seasonal campaign should not determine whether an applicant, journalist or investor can find the organization’s standing information. Keep the image treatment consistent enough that a different photograph will still support readable text.
Pros
A familiar blue header holds the page together while the lead story changes.
The photograph establishes a human subject before denser corporate information.
Cons & considerations
Photographic text needs contrast checks with every replacement image.
A seasonal lead requires a clear archive and an explicit update owner.
Platform source: Primary documented Power BI association. Documented association: October 2022 Walmart finance reporting with Power BI; internal analytics, not retail-site runtime. Platform evidence is separate from the direct website screenshot and is not a complete current infrastructure audit.
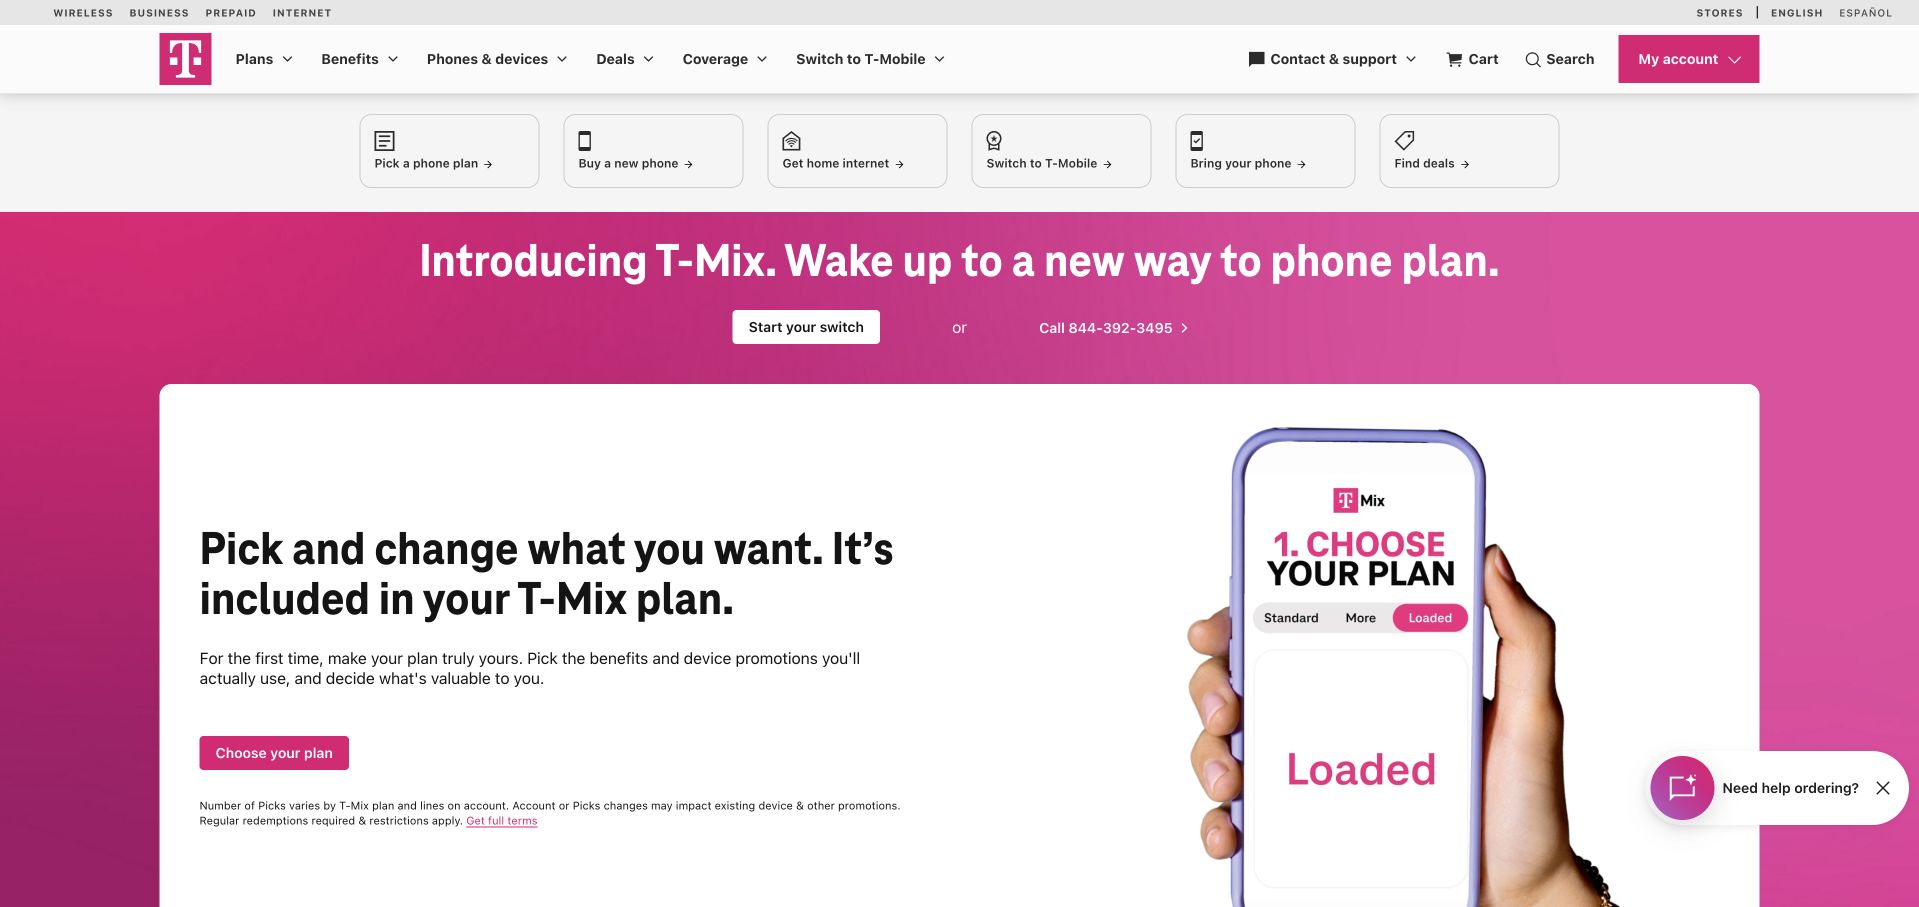
T-Mobile’s public storefront uses its strong magenta identity around a plan-led promotion. Phone imagery and the T-Mix presentation make the offer more concrete than a plain telecommunications slogan, while familiar product navigation stays above the campaign. The opening balances a large promotional statement against smaller details and actions. It is useful to study how a recurring service is packaged visually as something a shopper can compare. The captured page is a consumer sales surface, not the supply-chain reporting application described in Microsoft’s December 2022 Power BI story. Those two contexts should remain separate when borrowing design ideas.
What you can learn
Make a service offer concrete with the relevant product and a short explanation. Preserve clear routes to plan details and eligibility rather than expecting a campaign image to explain a contract. Let the brand color organize the page instead of applying it equally to every sentence.
Pros
The magenta identity makes the main promotion immediately recognizable.
Device imagery helps explain a service offer without a long opening essay.
Cons & considerations
Promotional benefits need accessible terms and clear eligibility nearby.
Several competing retail messages can become crowded on a small screen.
Platform source: Primary documented Power BI association. Documented association: December 2022 supply-chain and 5G reporting; separate from the public storefront. Platform evidence is separate from the direct website screenshot and is not a complete current infrastructure audit.
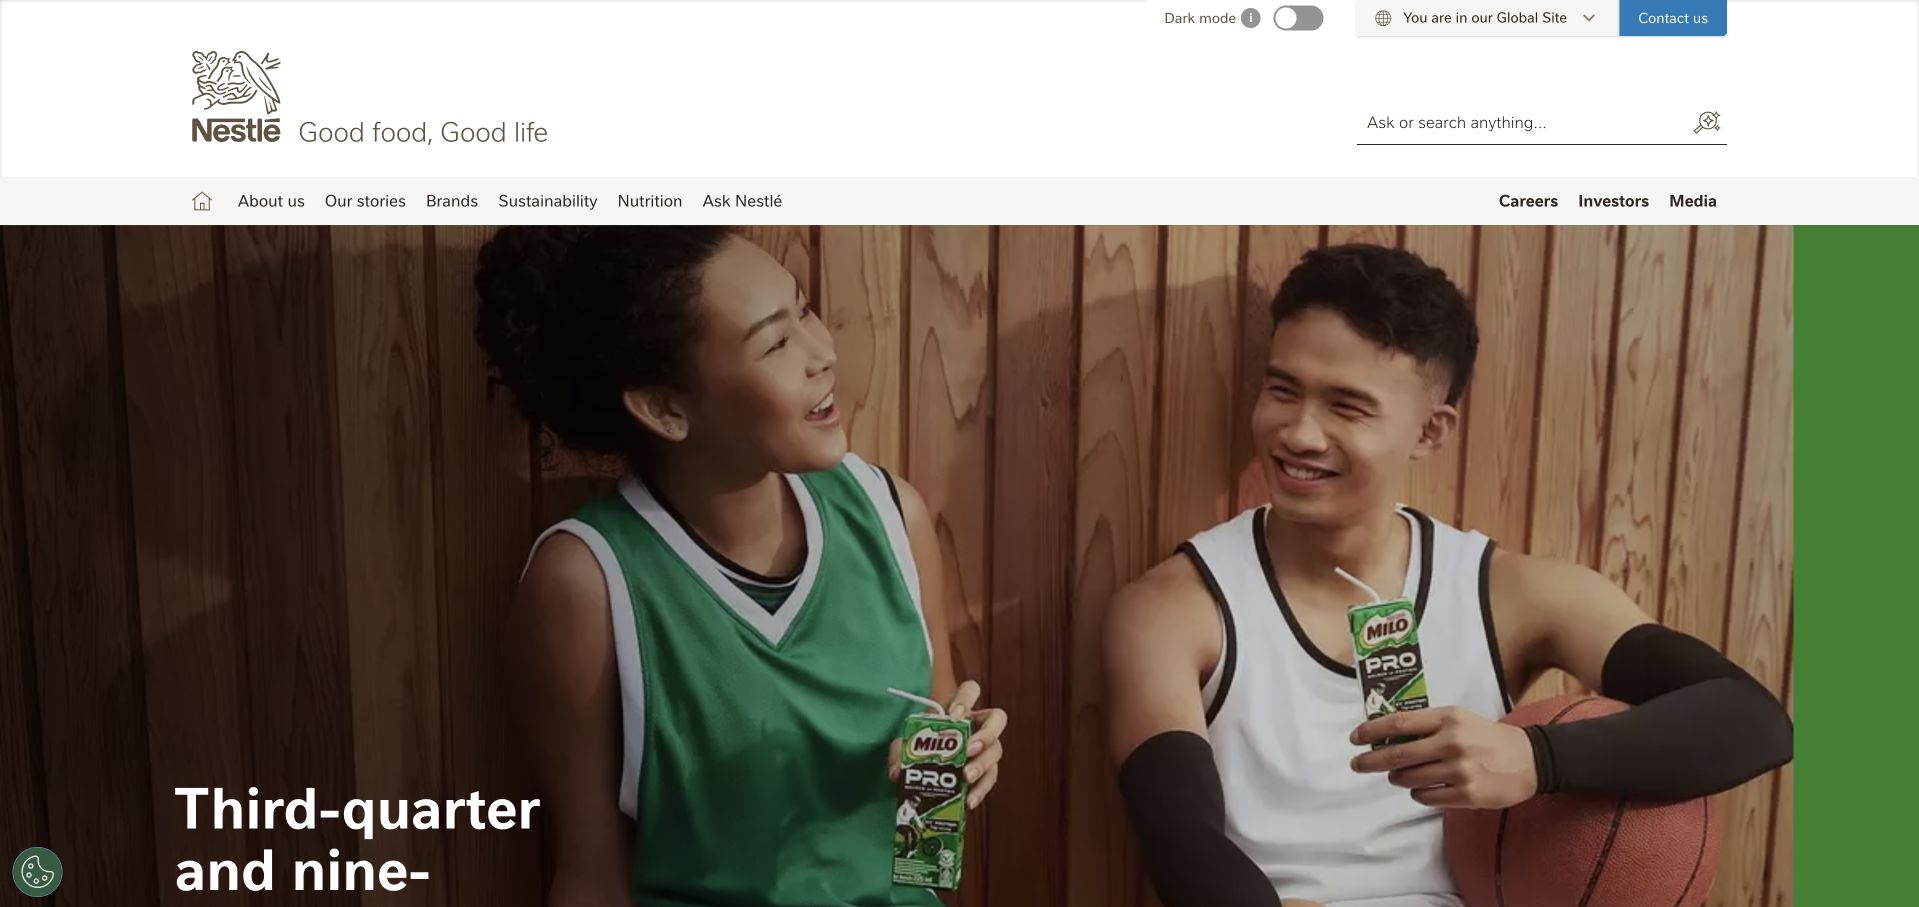
Nestlé’s global homepage uses a white corporate navigation bar above a large editorial campaign. In the inspected opening, Milo and an athletic scene provide a specific brand context within the much broader group identity. Corporate reporting and organizational routes remain distinct from the individual product story. That separation is the useful design move: one example supplies energy while the header explains where the visitor is. The accompanying Microsoft source concerns analytics within a Nespresso customer-management program in Saudi Arabia. It should not be stretched into a claim that every Nestlé brand or this global homepage shares that implementation.
What you can learn
Use one understandable brand story to introduce a large portfolio, then offer stable navigation for the group’s other audiences. Explain the relationship between the parent and the featured brand so readers do not mistake a campaign for the entire business. Make reporting material findable even when the visual feature rotates.
Pros
A restrained corporate header provides continuity across changing campaigns.
A specific product story gives a broad organization a concrete introduction.
Cons & considerations
Rotating campaigns need accessible motion controls and readable fallbacks.
Parent-company and individual-brand destinations must be clearly differentiated.
Visible tech stack
Earlier / documented evidence
Power BI
Platform source: Primary documented Power BI association. Documented association: Power BI analytics within the cited Nespresso KSA customer-acquisition and customer-management program; not every Nestlé brand site. Platform evidence is separate from the direct website screenshot and is not a complete current infrastructure audit.
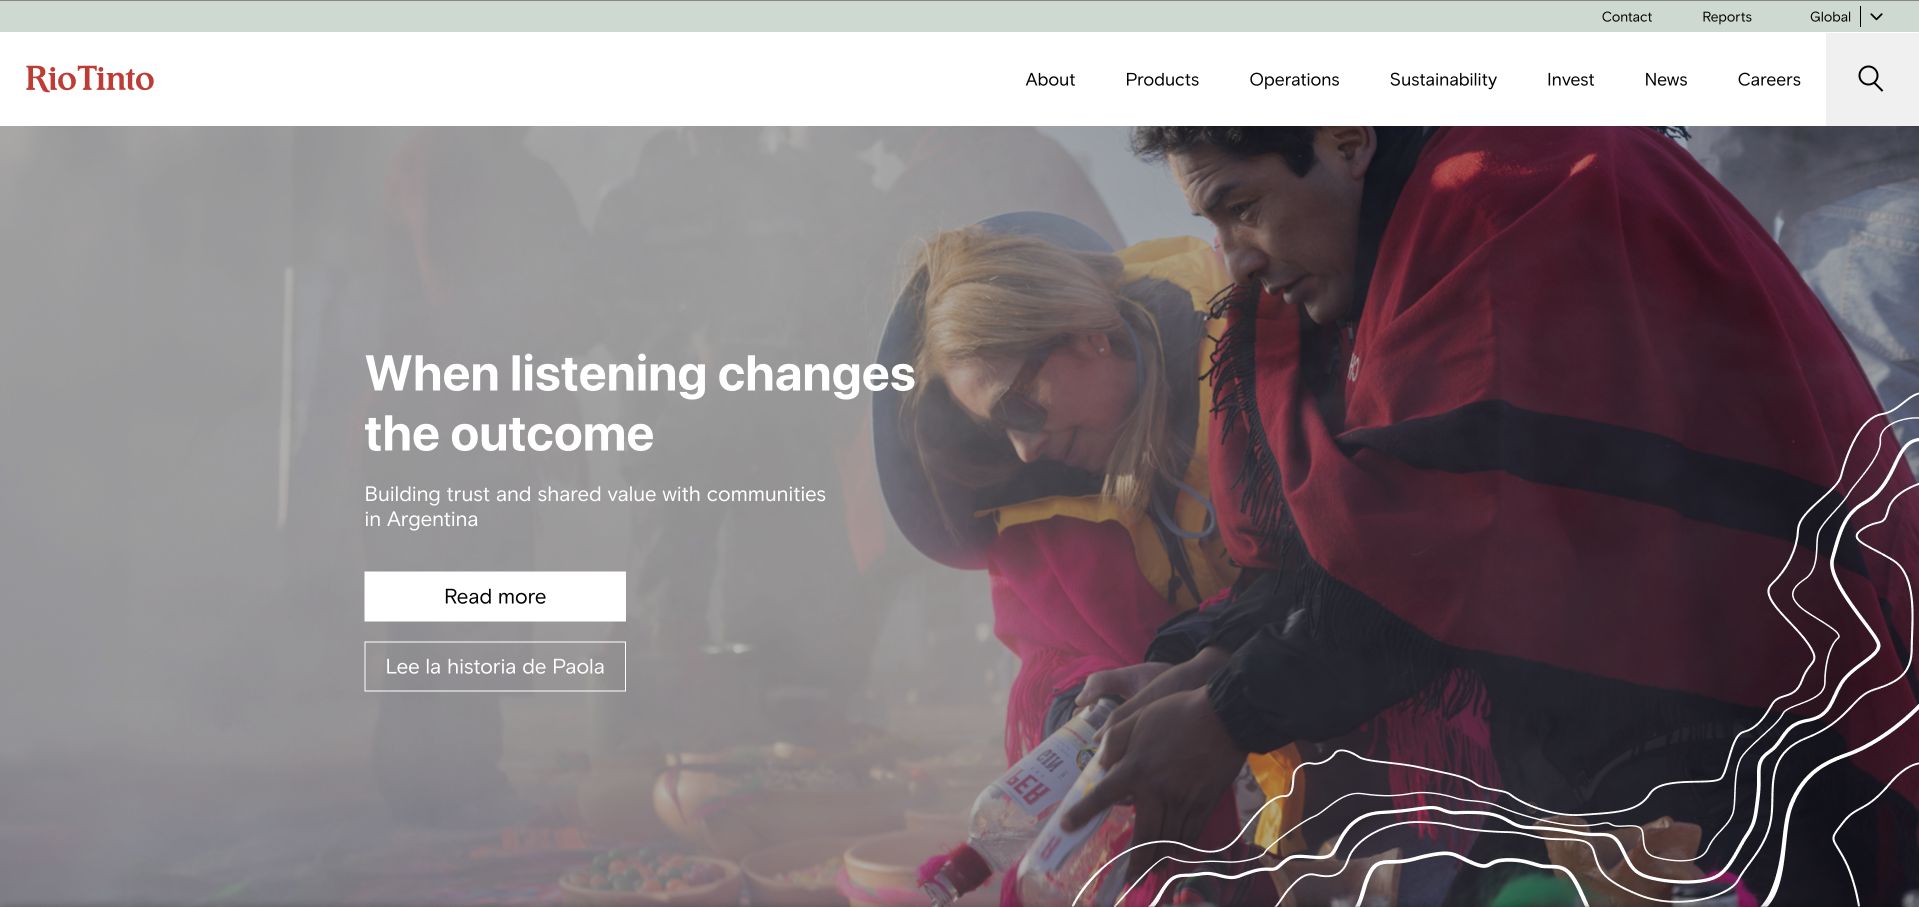
Rio Tinto opens with a broad scene of people and community beneath a restrained white header. The listening-led statement is short enough to sit within the image without becoming a paragraph of corporate language. The visual emphasis differs from a page that begins with equipment or output figures: the organization frames the story through relationships first. That is a presentation choice, not independent evidence of the claim. Microsoft’s September 2026 case separately describes internal month-end finance calculations and reporting with Power BI, Power Apps and SAP context. Nothing about that case establishes how the corporate homepage is generated.
What you can learn
Choose a scene that gives an abstract company promise a human reference point, then lead to concrete evidence and relevant reporting. Keep the promise brief in the hero. Detailed policies, project information and accountability material deserve permanent destinations rather than being squeezed into the image caption or left behind a campaign carousel.
Pros
The short headline allows the photograph to retain its context.
A quiet header leaves room for a substantial institutional story.
Cons & considerations
Broad relationship claims need specific supporting material beyond the hero.
Video or changing imagery requires controls and reliable text contrast.
Platform source: Primary documented Power BI association. Documented association: September 2026 internal month-end finance calculations/reporting; not corporate-page rendering. Platform evidence is separate from the direct website screenshot and is not a complete current infrastructure audit.
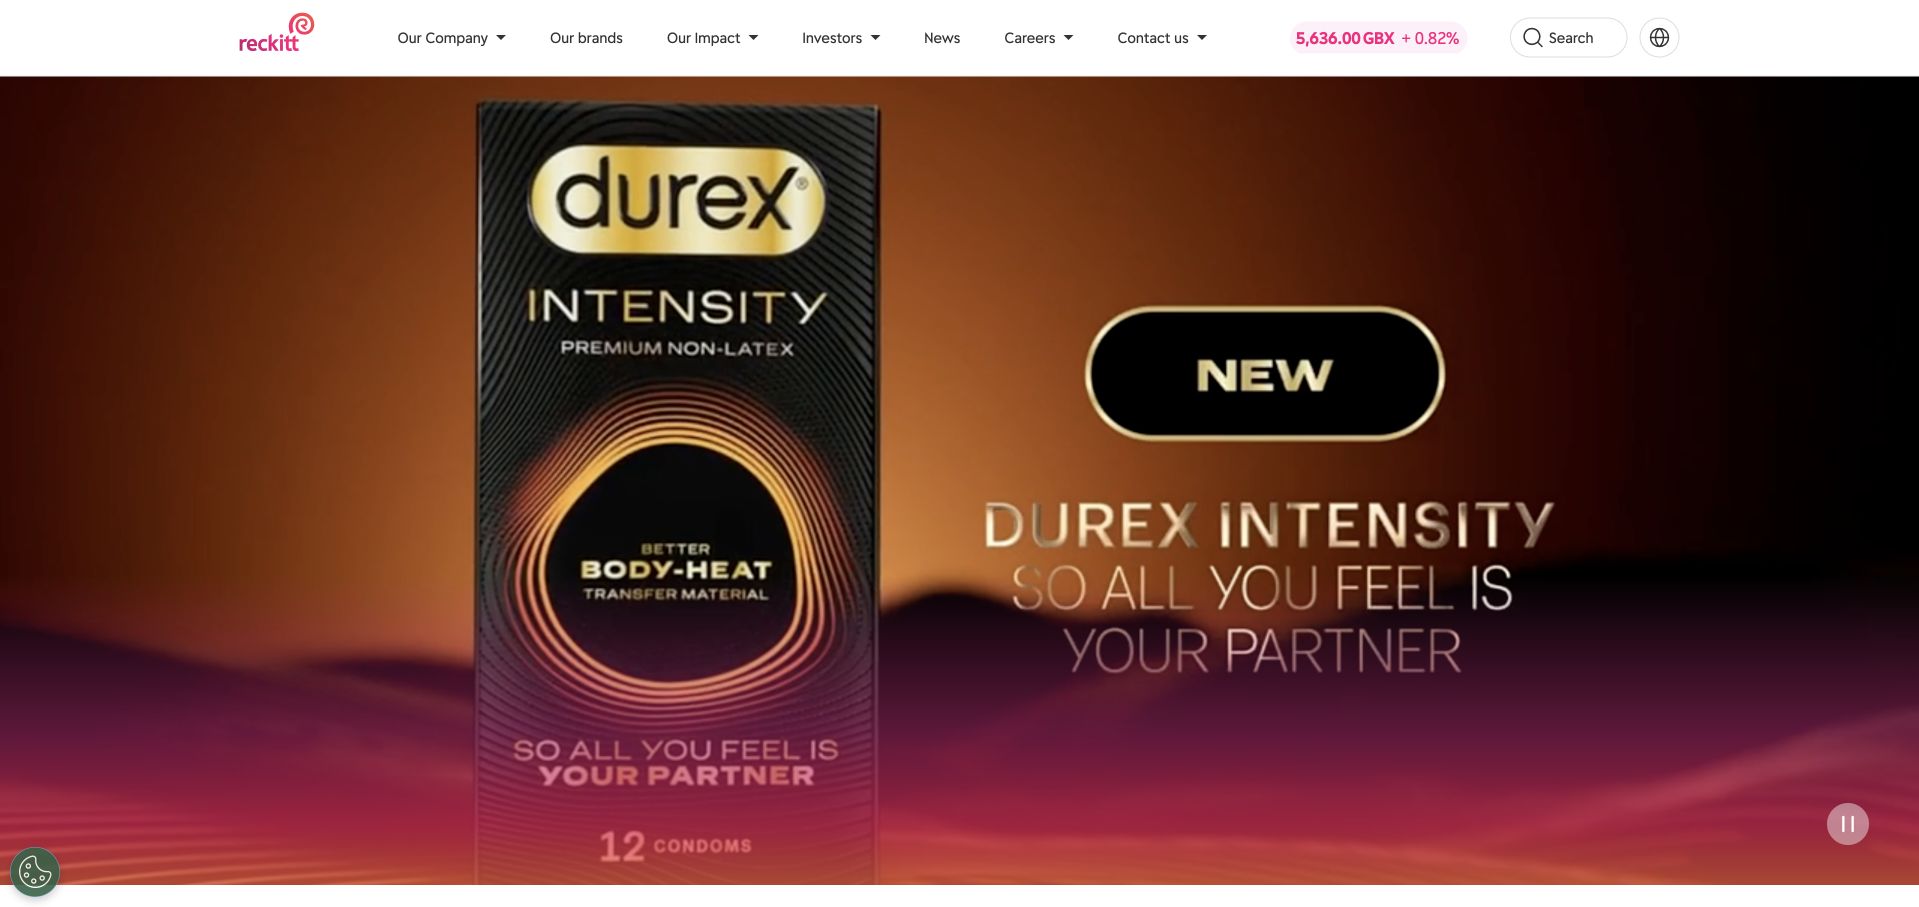
Reckitt’s corporate page combines a clean white navigation frame with strong magenta branding and a large product-led feature. The inspected scene shows Durex packaging as part of the wider portfolio presentation. That gives visitors a familiar object before asking them to understand the corporate organization. The visual treatment is bold, but the navigation remains a separate utility rather than disappearing into the campaign. The June 2025 Microsoft account describes marketing insights and Copilot for Power BI. Its analytical workload is not proof that the public portfolio page runs on Power BI or that the pictured products have any particular performance.
What you can learn
Let a recognizable product introduce a larger company story. Keep the parent identity visible and give readers a route into the wider portfolio. Preserve the hierarchy between recognition, institutional information and useful actions when the campaign changes.
Pros
Distinctive packaging supplies immediate recognition within the group identity.
The white navigation frame stays legible beside saturated campaign colors.
Cons & considerations
A single lead brand can overshadow the breadth of the portfolio.
Campaign statements need clear context and appropriate supporting information.
Platform source: Primary documented Power BI association. Documented association: June 2025 marketing insights and Copilot for Power BI; not proof of the marketing-site runtime. Platform evidence is separate from the direct website screenshot and is not a complete current infrastructure audit.
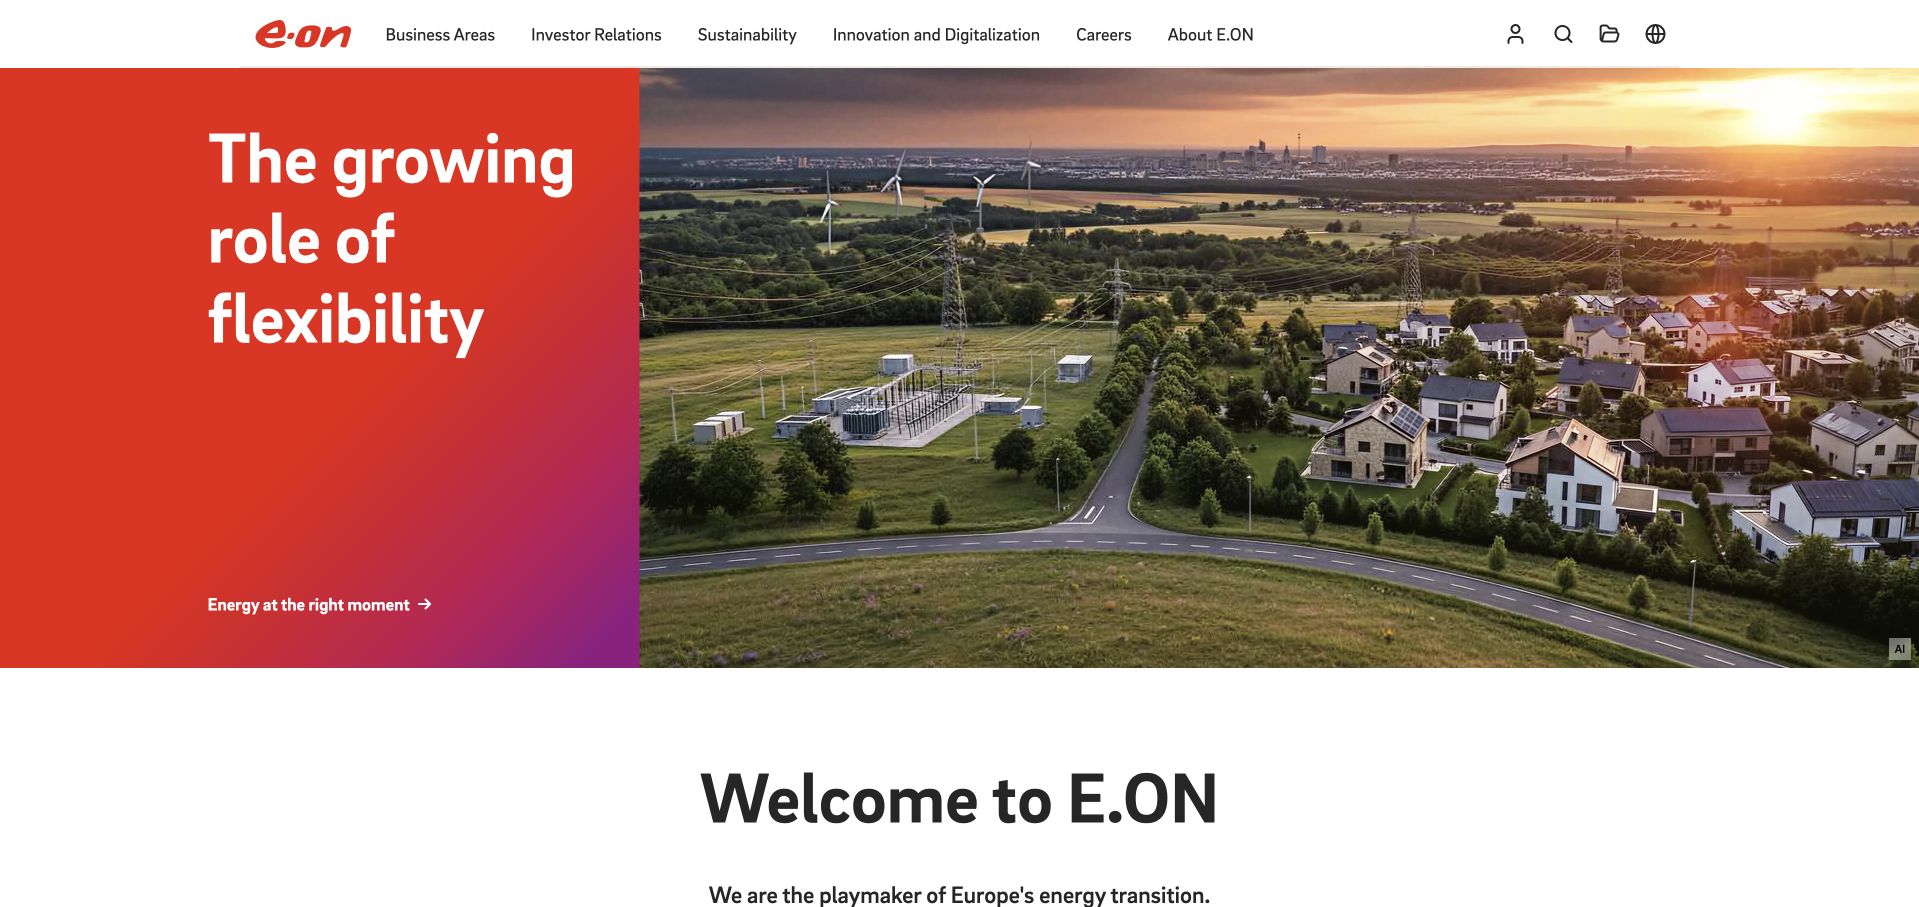
E.ON places a large red-gradient message panel beside an aerial energy landscape. The inspected feature concerns flexibility, with the text and image occupying visibly different jobs: one states the subject, the other supplies a physical setting. The red identity is used as a structural field rather than merely a small accent. Corporate navigation sits above the composition, leaving the feature free to tell one story. Microsoft’s January 2024 source describes employee reporting and collaboration through Power BI and Teams. It does not establish the current frontend technology of this global corporate surface or every E.ON subsidiary.
What you can learn
Separate the explanatory message from the supporting image when the subject is difficult to describe in a few words. Give the feature a specific topic and a clear continuation instead of opening with a generic sustainability slogan. Preserve stable routes for investors, customers and applicants outside the changing campaign area.
Pros
The split layout gives the headline a predictable reading area.
A physical landscape helps ground an abstract energy-system subject.
Cons & considerations
Gradient and image changes still need deliberate contrast testing.
Broad infrastructure themes require concrete examples and scope beyond the opening.
Visible tech stack
Earlier / documented evidence
Power BI
Platform source: Primary documented Power BI association. Documented association: January 2024 internal reporting and Teams collaboration; no cross-subsidiary frontend inference. Platform evidence is separate from the direct website screenshot and is not a complete current infrastructure audit.
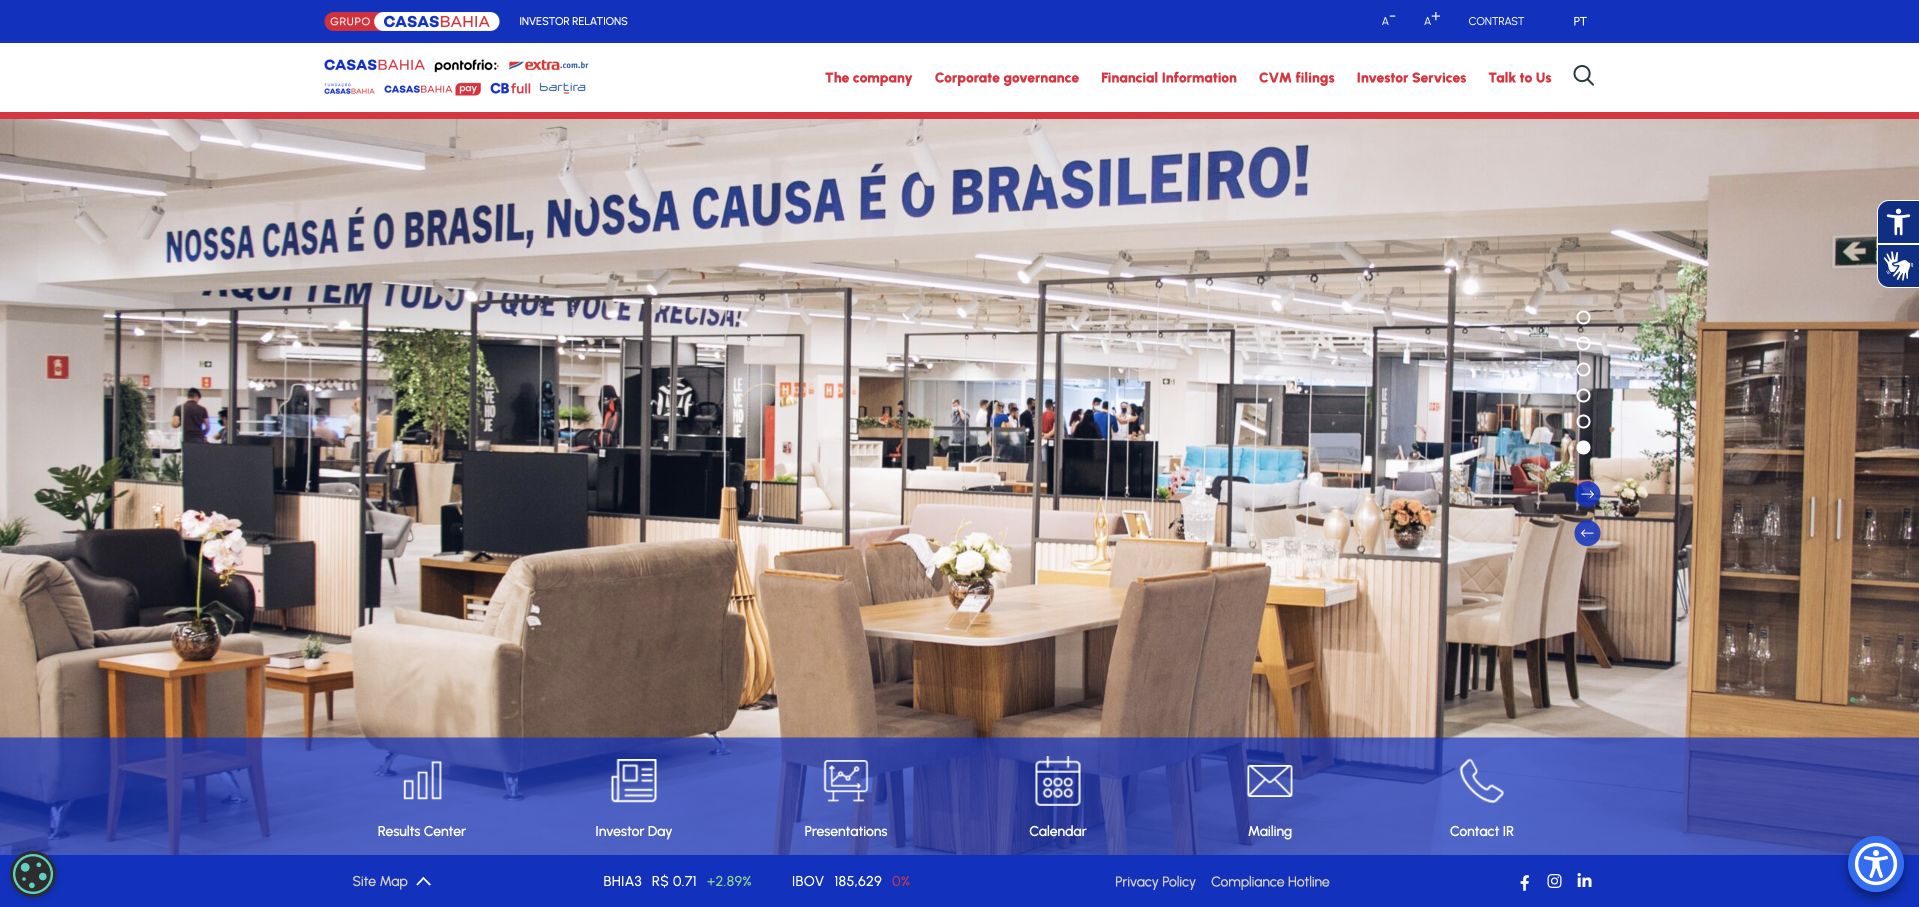
Grupo Casas Bahia’s investor site uses a store photograph and blue corporate accents above a dense set of financial utilities. The image connects the reporting destination to the retail business without turning the page into a shopping interface. Navigation and document-oriented links do the practical work, while the large photograph supplies context. Language choices are part of that utility structure and deserve attention in an internationally read investor site. Microsoft’s April 2024 story concerns Power BI Premium and Fabric reporting capacity around the retailer’s Black Friday work; the investor page is reviewed separately as a public information design.
What you can learn
Begin an investor destination with a recognizable business context, then prioritize documents, reporting periods and audience tasks. Make the difference between a store, a corporate overview and an investor portal explicit. A photograph can humanize the page, but it should not push essential filings or the latest reporting period beyond a long promotional opening.
Pros
Retail photography ties specialist financial information to the underlying business.
Utility-led navigation suits visitors looking for a particular document.
Cons & considerations
Dense financial navigation needs a clear mobile grouping strategy.
Language variants require consistent document labels and reporting-period information.
Visible tech stack
Earlier / documented evidence
Power BI
Platform source: Primary documented Power BI association. Documented association: April 2024 Power BI Premium and Fabric reporting capacity; investor page is a separate design reference. Platform evidence is separate from the direct website screenshot and is not a complete current infrastructure audit.
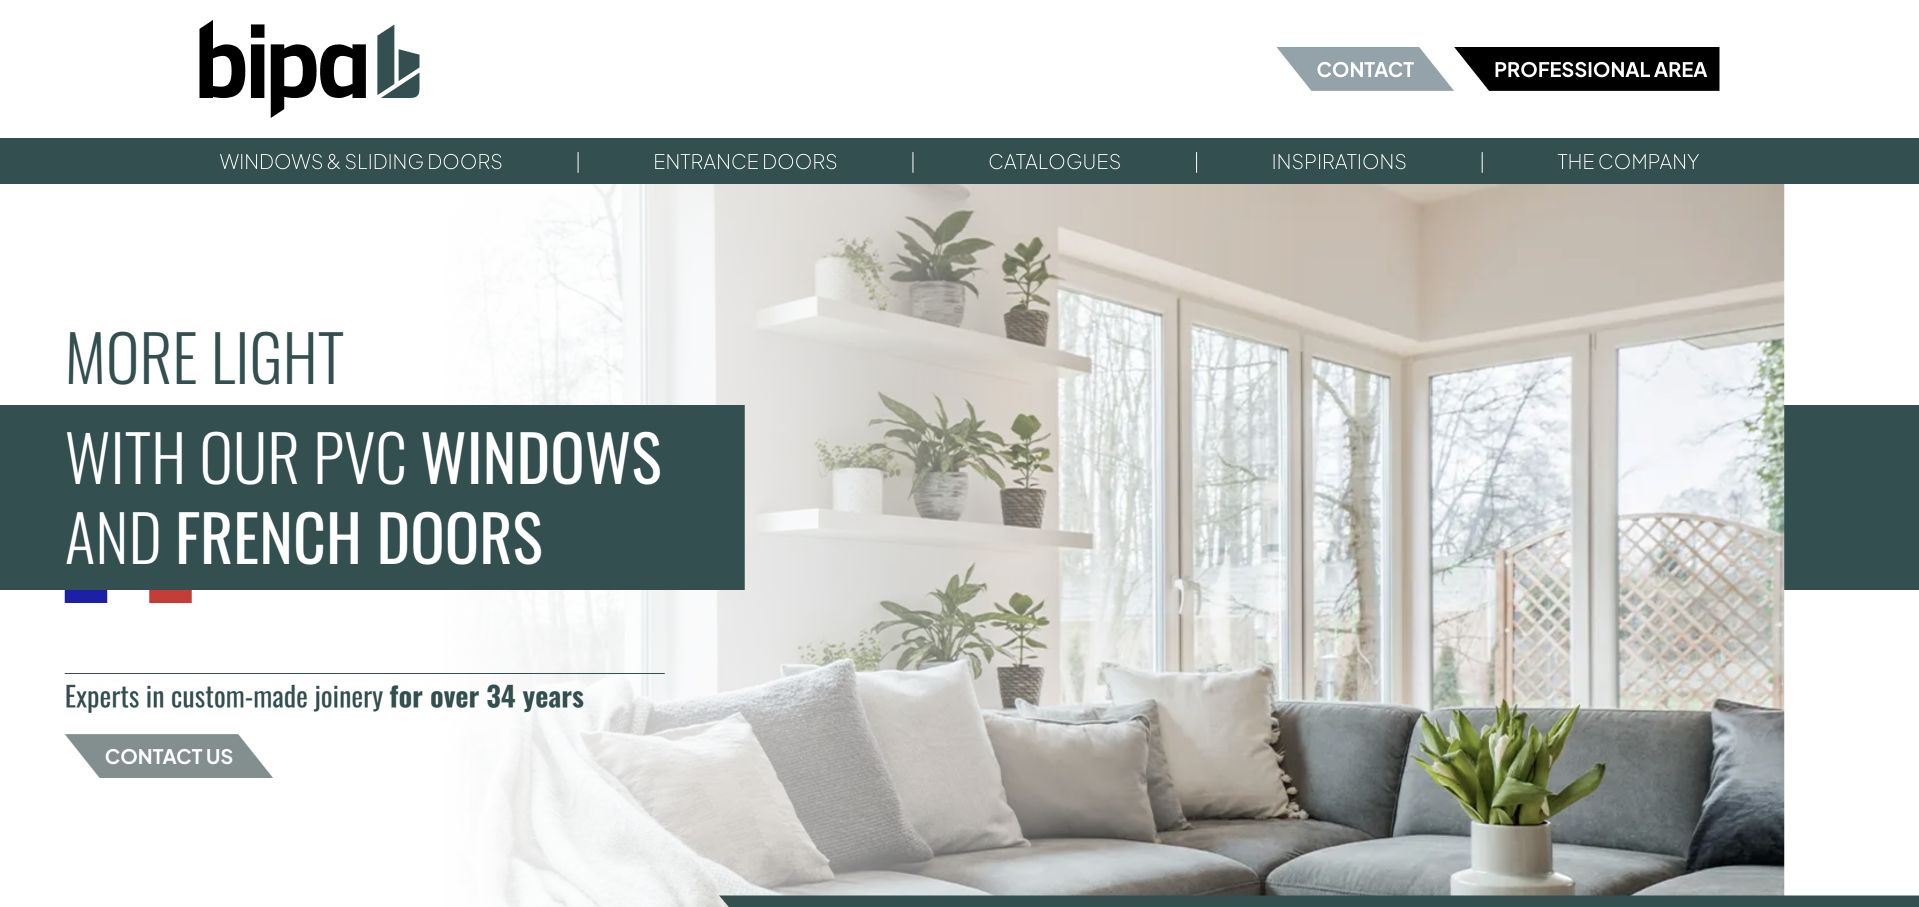
BIPA’s public site introduces its joinery business through a bright room and window scene. The green brand field and light-focused statement connect the product to an interior outcome rather than opening with manufacturing terminology. Professional-area and contact routes sit within the navigation, acknowledging that the site serves more than one audience. This is the French building-products business identified in Microsoft’s August 2026 customer account, not a similarly named retail chain. That source discusses sales and after-sales dashboards using Power BI. The public image demonstrates a design approach, while the documentary evidence supports only that bounded business workload.
What you can learn
Show the outcome a homeowner wants, then give specifications and professional information their own routes. Keep technical detail available for installers and trade visitors. Distinguish those journeys early instead of mixing every audience into one inquiry.
Pros
The room photograph makes the product’s practical purpose easy to understand.
A distinct professional route acknowledges a second audience without crowding the hero.
Cons & considerations
Lifestyle imagery must lead to useful product and installation information.
Aesthetic benefits should not replace supported performance specifications.
Platform source: Primary documented Power BI association. Documented association: August 2026 French joinery sales/after-sales dashboards; unrelated to similarly named retail chains. Platform evidence is separate from the direct website screenshot and is not a complete current infrastructure audit.
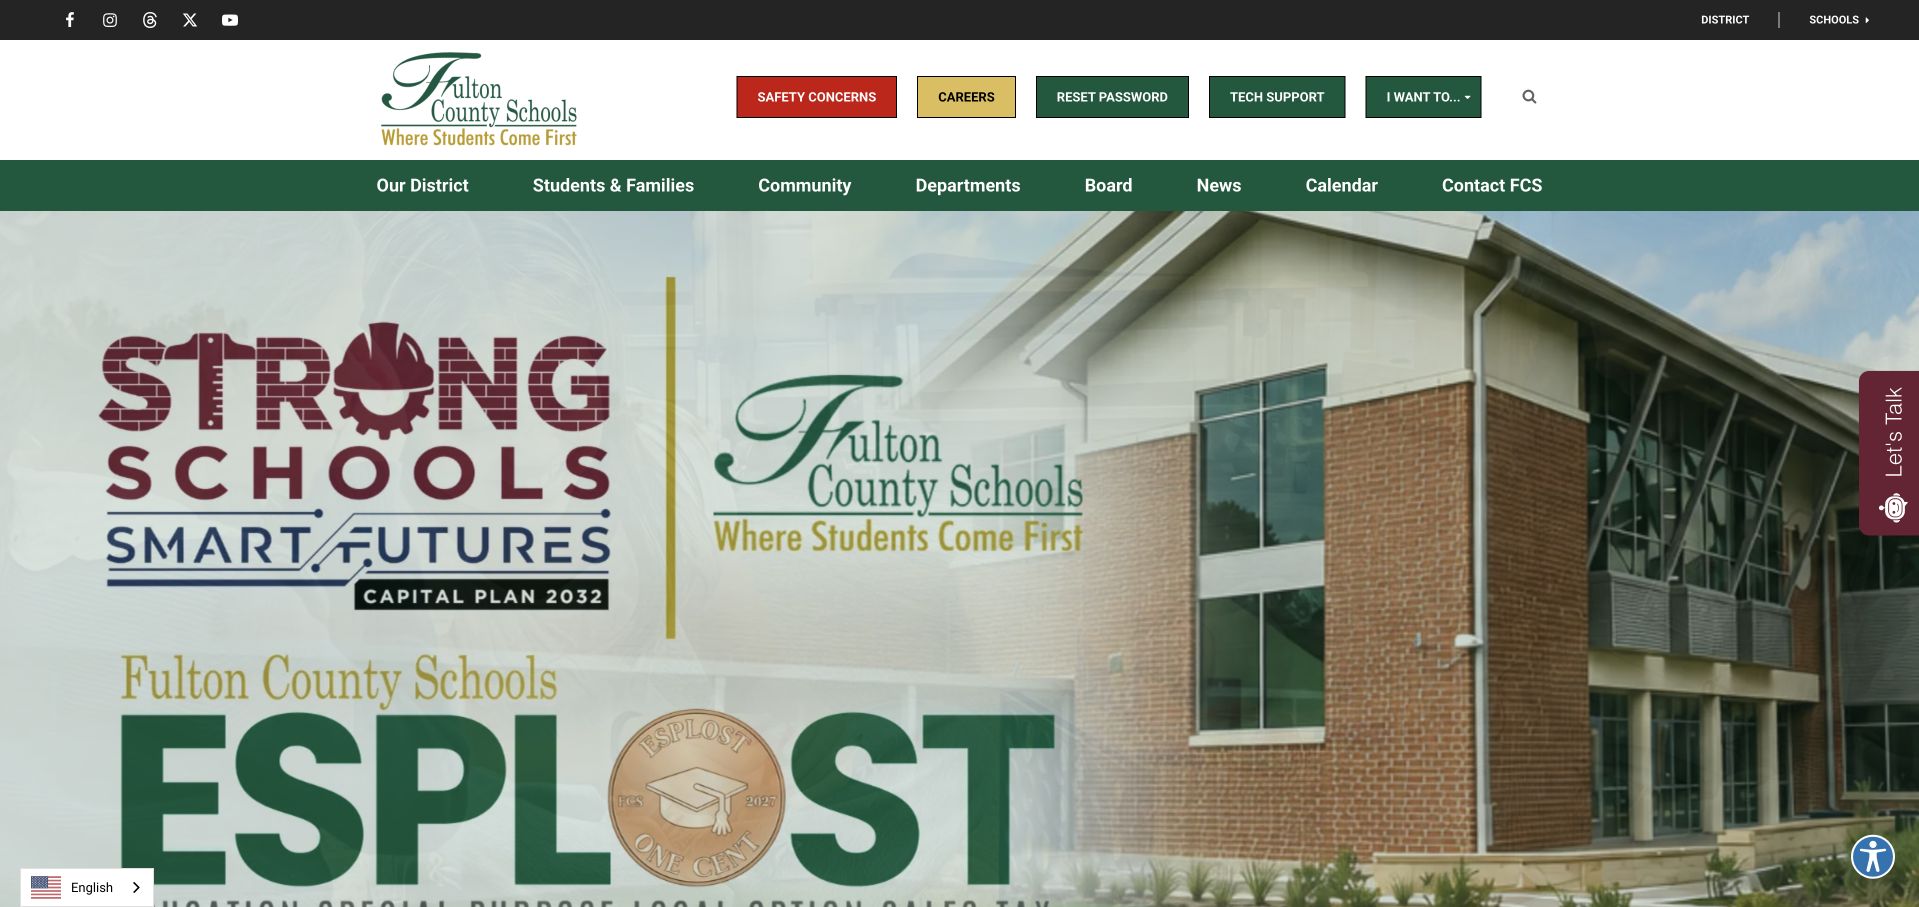
Fulton County Schools uses a green-and-cream identity around a campus photograph and a prominent planning announcement. The opening feels like a district portal rather than a single-school prospectus: audience navigation and utilities must serve families, students and staff who arrive with different tasks. The large announcement supplies a current subject, while the surrounding frame holds the recurring routes. An assistance widget is visible as an additional option rather than the sole way to navigate. Microsoft’s May 2024 case describes district reporting and public Power BI visualizations; that does not identify the implementation of the full website or every school’s content system.
What you can learn
Separate announcements from recurring school-year tasks. Use audience labels only when their destinations differ, and keep information accessible without chat. Someone ignoring the campaign should still reach a calendar, school or service directly.
Pros
The district identity remains consistent around a changing announcement.
Audience navigation supports several distinct groups of repeat visitors.
Cons & considerations
Large campaign panels can displace high-frequency practical tasks.
Help widgets must not cover controls or become a navigation requirement.
Visible tech stack
Earlier / documented evidence
Power BI
Platform source: Primary documented Power BI association. Documented association: May 2024 district reporting/public visualizations; not the whole district CMS. Platform evidence is separate from the direct website screenshot and is not a complete current infrastructure audit.
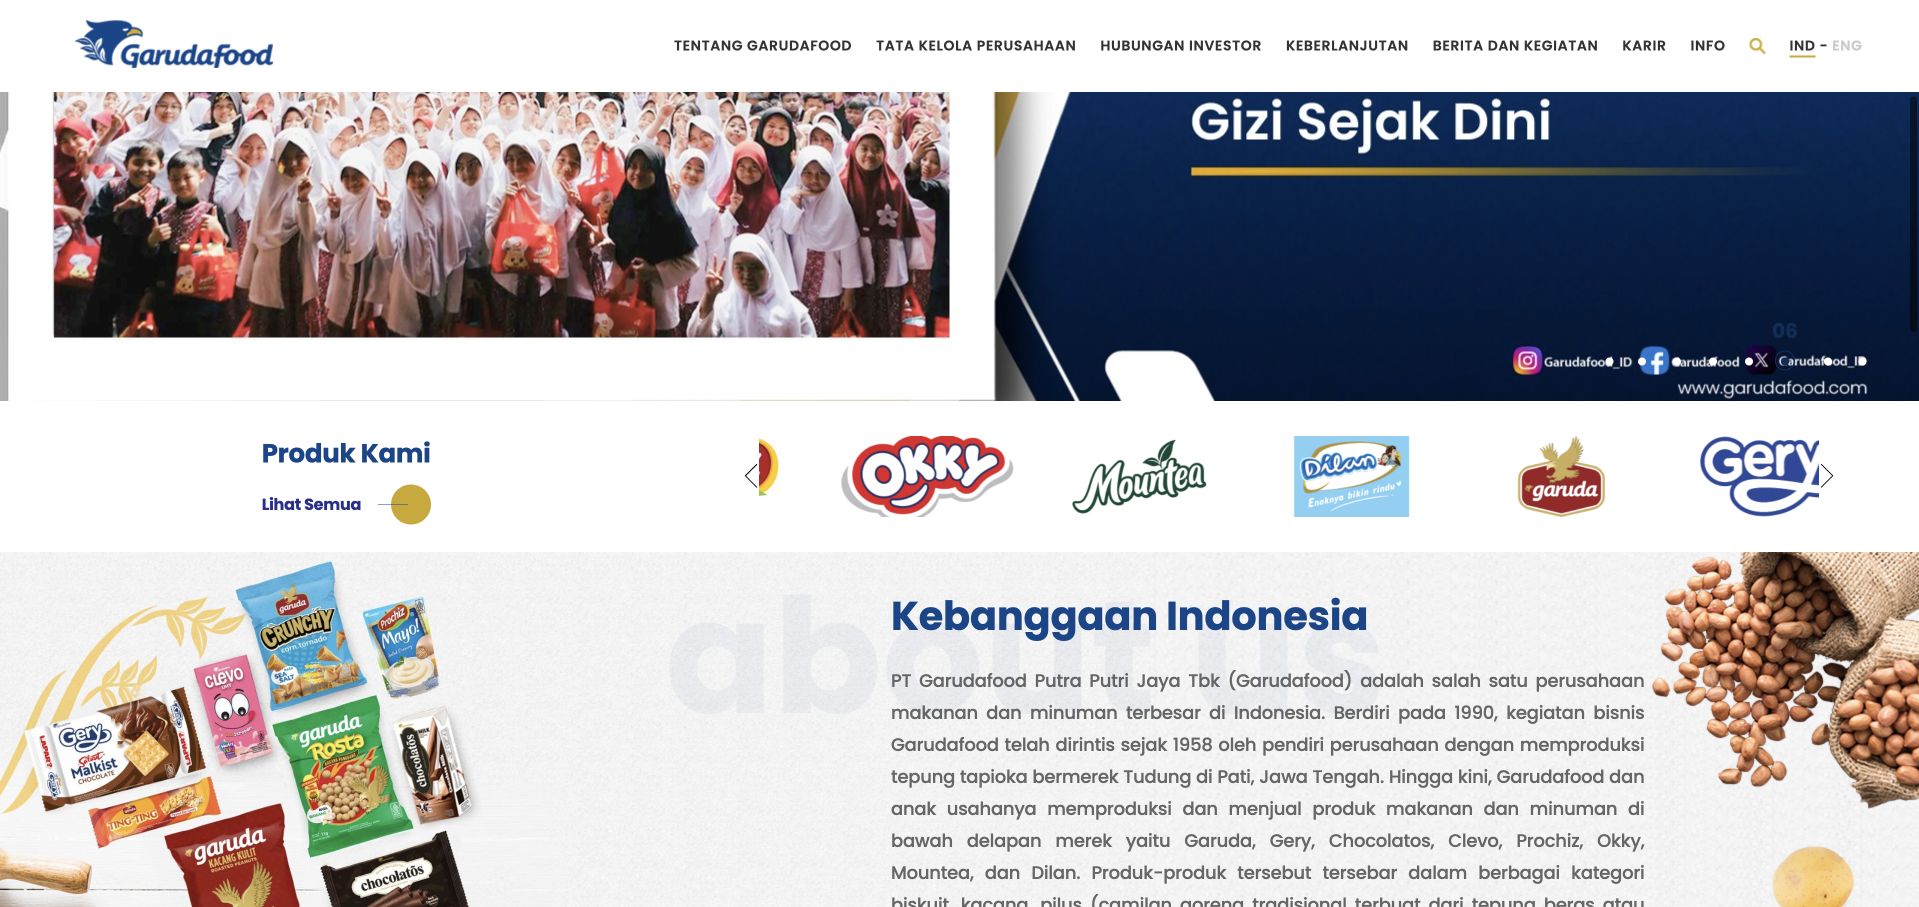
Garudafood’s public page places its corporate identity alongside a row of consumer-product brands and a concise company explanation. The inspected view shows those brands as a bridge into the wider organization rather than treating the site as an online grocery shelf. Navigation remains available above the product material, and the page provides room for corporate storytelling after the initial visual feature. This is a useful pattern for a manufacturer whose customers may know a package better than the parent name. Microsoft’s Fabric case describes an enterprise data foundation feeding Power BI dashboards; it is not a complete inventory of this corporate page’s stack.
What you can learn
Use product identities to orient visitors, then explain the parent company and each audience’s next step. Give logos accessible labels and useful destinations. Corporate, product and investor journeys can share an identity without becoming the same journey.
Pros
Recognizable product brands make the parent-company relationship more concrete.
The company explanation has its own space instead of competing with the lead imagery.
Cons & considerations
Logo rows need accessible labels and clear destinations.
Large introductory campaigns should not obscure corporate or investor utilities.
Platform source: Primary documented Power BI association. Documented association: Fabric-based enterprise data foundation feeds Power BI dashboards; corporate-page stack remains separate. Platform evidence is separate from the direct website screenshot and is not a complete current infrastructure audit.
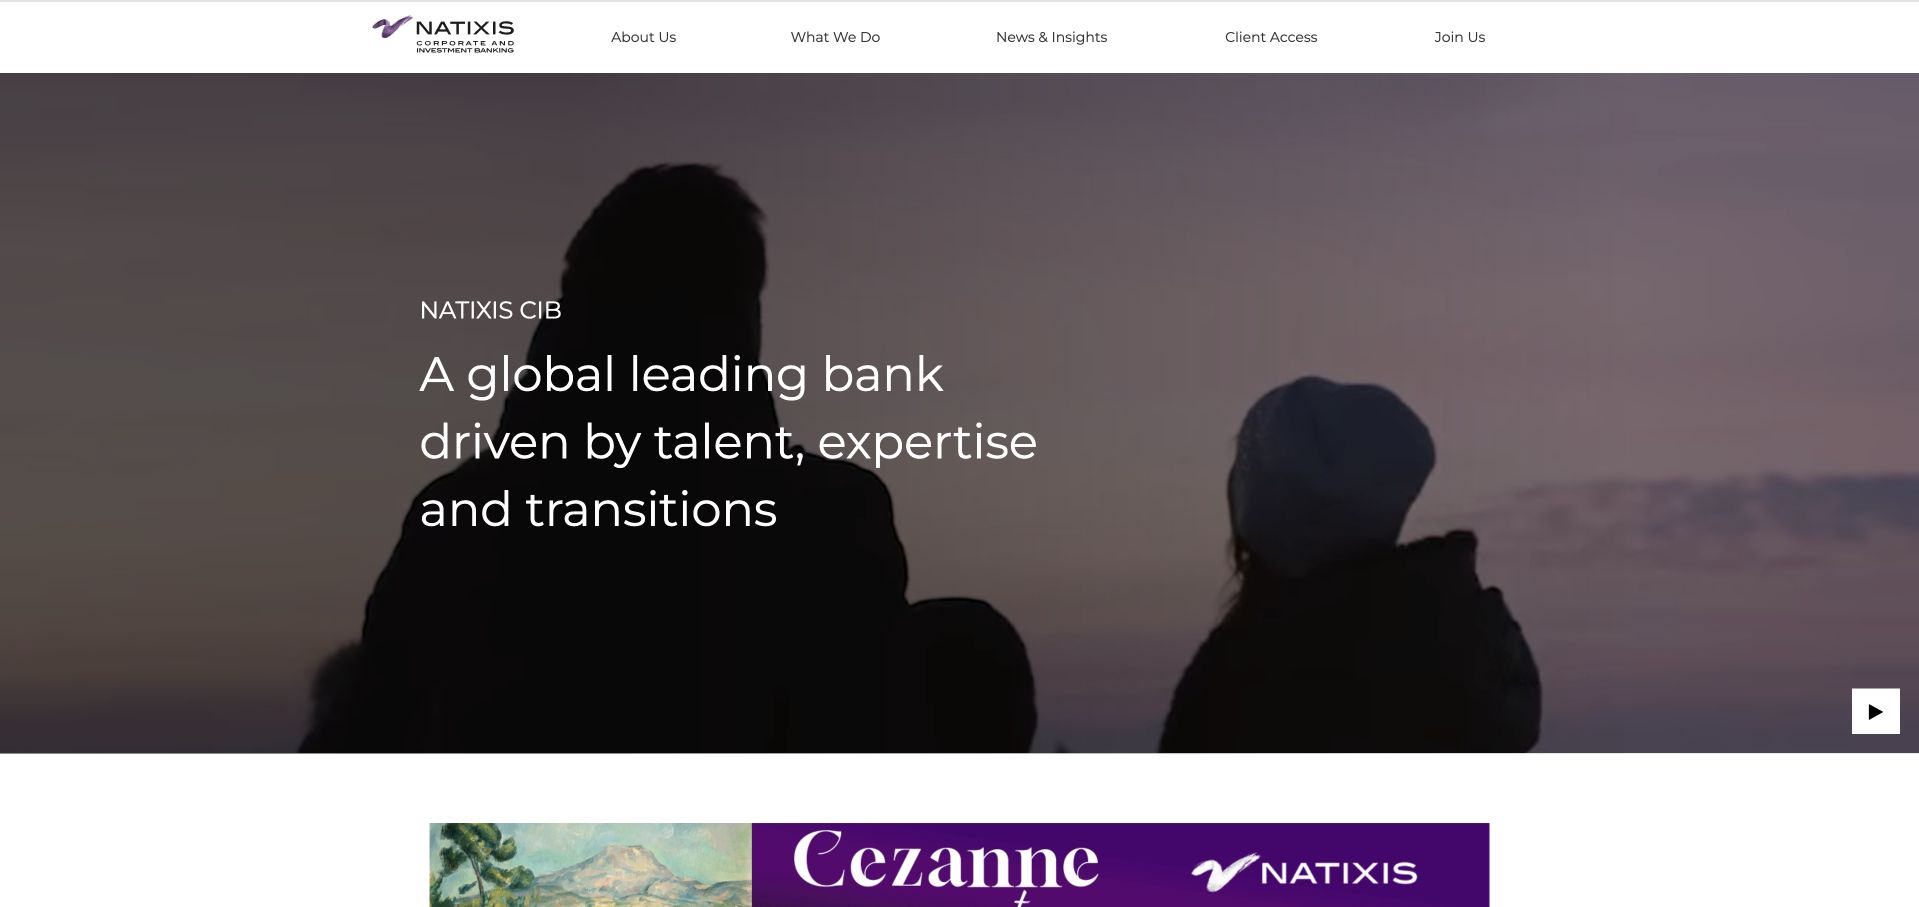
Natixis CIB uses a broad coastal scene beneath a white corporate header, with a short institutional message placed over the darker image. A separate exhibition or story banner adds a timely destination without requiring the main statement to explain every service. The visual language is restrained compared with a retail banking offer: it introduces the organization rather than presenting an account-opening flow. Service navigation therefore carries much of the practical responsibility. The June 2025 Microsoft source concerns invoice-reconciliation analytics in New York. That specific Power BI and Power Platform workload should not be generalized to all BPCE systems or the public website.
What you can learn
Give an institutional homepage a clear introductory role, then use permanent service navigation for detail. Distinguish exhibitions and publications from the main proposition. Preserve a readable still state so the organization remains understandable without watching the background sequence.
Pros
A short message remains readable within a large atmospheric image.
Current editorial material is visually distinct from the permanent navigation.
Cons & considerations
Institutional language needs concrete service explanations beyond the opening.
Background motion requires a readable still state and appropriate controls.
Visible tech stack
Earlier / documented evidence
Power BI
Platform source: Primary documented Power BI association. Documented association: June 2025 New York invoice-reconciliation analytics; no inference about all BPCE systems. Platform evidence is separate from the direct website screenshot and is not a complete current infrastructure audit.
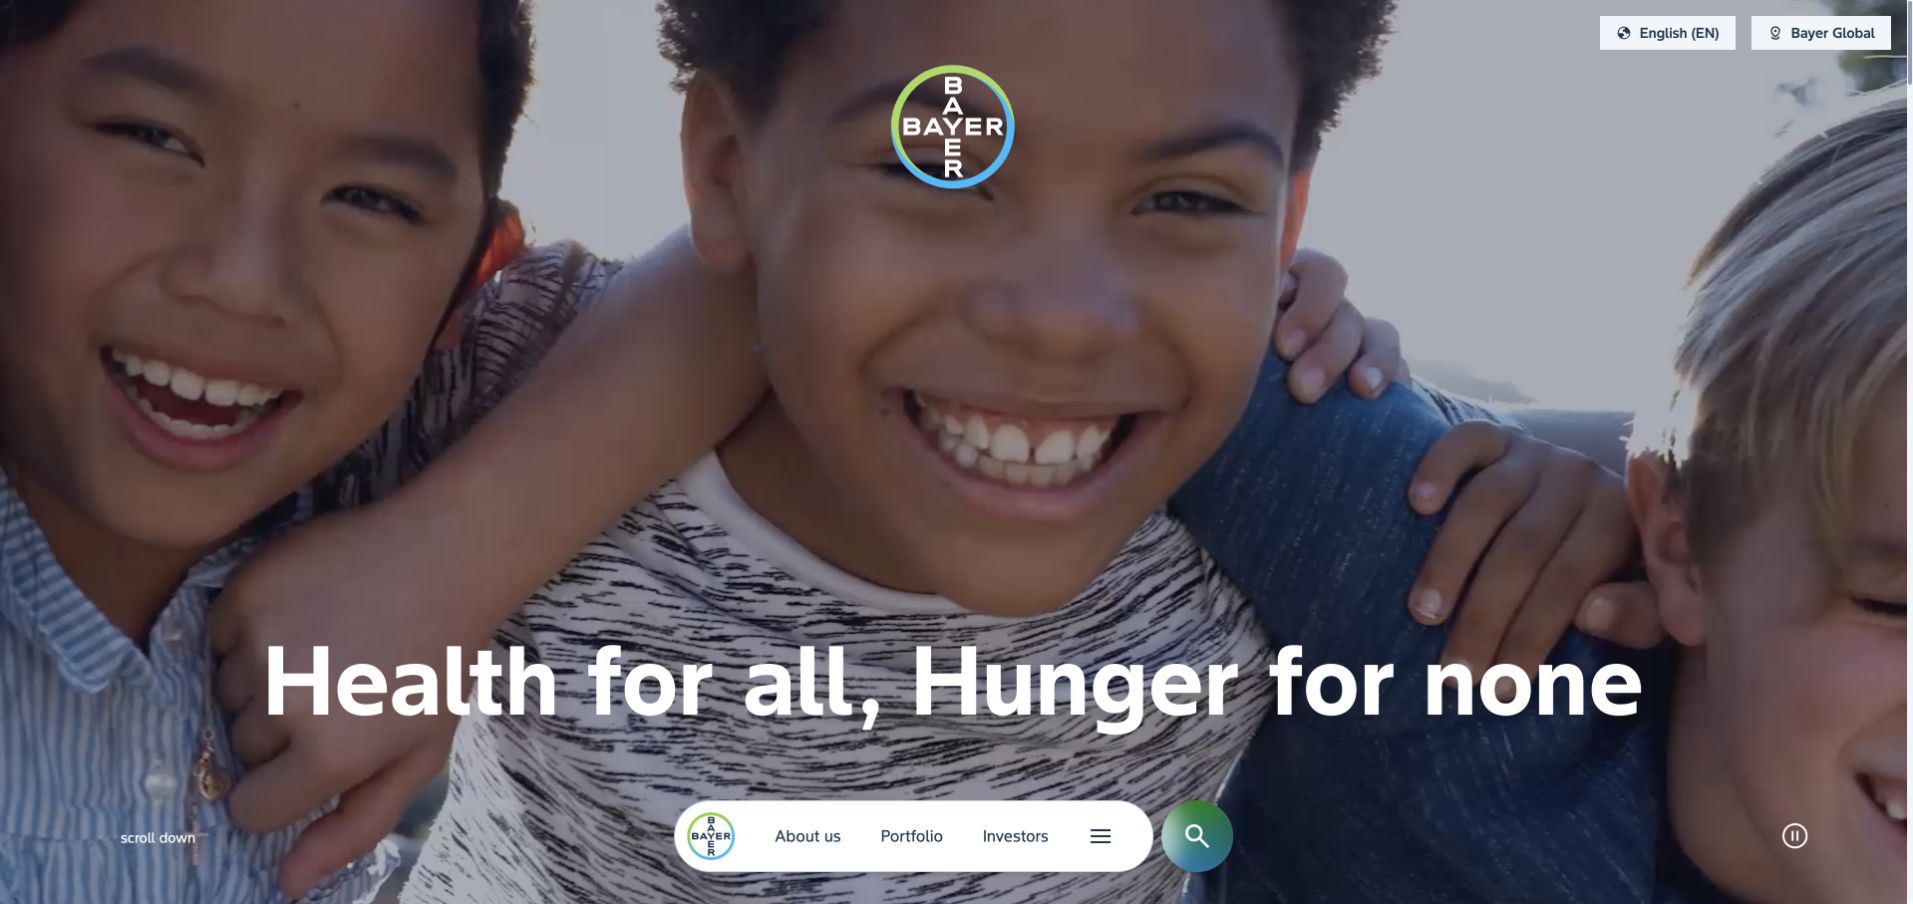
Bayer gives most of the opening to a photograph of children, with a short purpose statement placed against the scene. The company identity is compact, and the lower navigation treatment feels more like a floating set of routes than a conventional wall of corporate links. That creates a visually memorable first impression while leaving substantial explanatory work for the content that follows. The photograph is an introduction, not evidence of a health or agricultural outcome. Microsoft’s 2021 conference material describes finance reporting and Zebra BI visuals within Power BI; it is a historical internal association rather than current public-page detection.
What you can learn
Support a purpose-led opening with specific divisions, work and evidence. Keep those routes dependable even when navigation is visually unusual. Test image crops and text settings so the photograph never obstructs the statement.
Pros
A single human scene keeps the opening focused rather than fragmented.
The short purpose statement is easy to identify against the image.
Cons & considerations
Unconventional navigation still needs obvious keyboard and mobile behavior.
Purpose language must lead to specific, qualified information about the business.
Platform source: Primary documented Power BI association. Documented association: The 2021 conference describes CFO/finance reporting with Zebra BI visuals; historical internal Power BI association. Platform evidence is separate from the direct website screenshot and is not a complete current infrastructure audit.
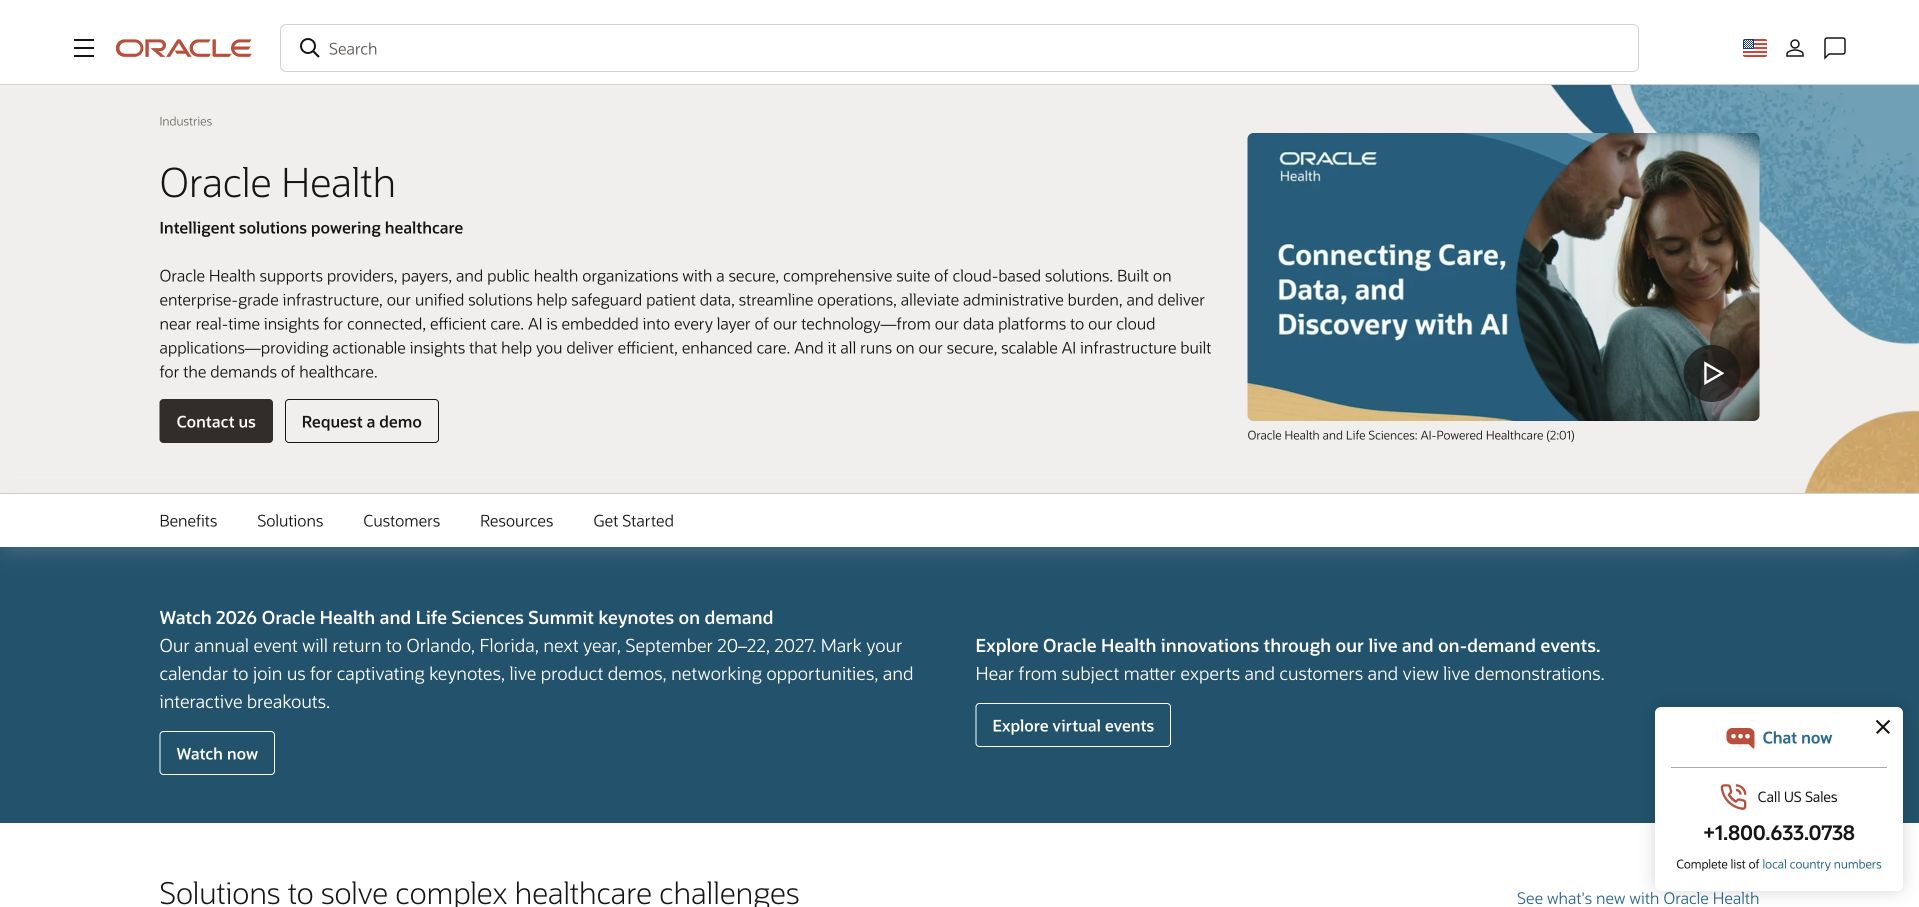
Oracle Health’s public page uses a compact title and description within Oracle’s broader beige, white and blue visual system. A specialist subnavigation creates a local map for healthcare content while the parent header remains available. The layout gives supporting media and solution material room below the introduction instead of asking a single hero image to explain the entire portfolio. It is also an example where corporate history matters: the cited 2021 Power BI conference names Cerner before Oracle acquired it. The current Oracle Health page is a design reference, not evidence that Oracle’s present healthcare products or marketing frontend use that historical implementation.
What you can learn
Give a specialist division a concise introduction and local navigation within the parent identity. Explain the date and scope of acquired-business evidence. An old technology association should not become a claim about every current product or page.
Pros
The local subnavigation gives a broad healthcare offering a usable structure.
A short introduction leaves space for progressively more detailed solution material.
Cons & considerations
Parent and division navigation can compete if their hierarchy is unclear.
Acquisition-era claims require dates and careful separation from current capabilities.
Visible tech stack
Earlier / documented evidence
Power BI
Platform source: Primary documented Power BI association. Documented association: The 2021 source names Cerner before its Oracle acquisition; a historical Cerner workload, not proof of current Oracle-wide infrastructure. Platform evidence is separate from the direct website screenshot and is not a complete current infrastructure audit.
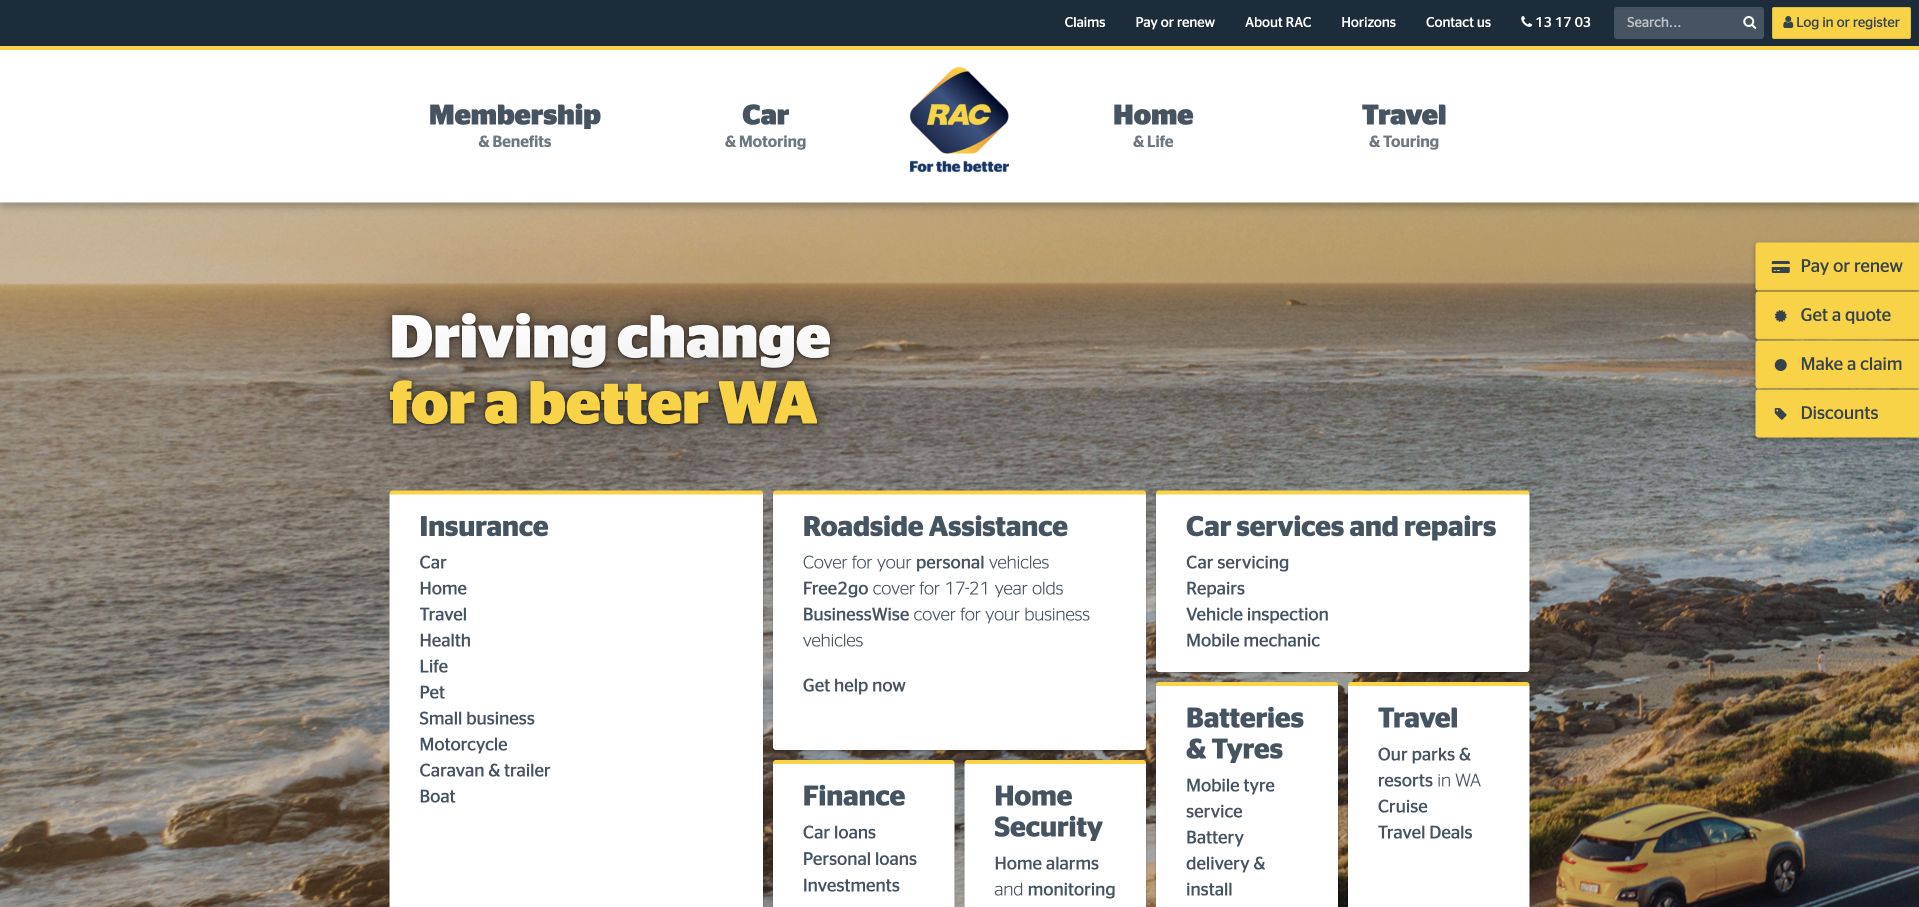
RAC WA combines a coastal photograph with a prominent set of white service tiles and a yellow action treatment. Insurance, roadside assistance and other practical destinations have a clearer interface role than the background landscape. That matters for a membership and services organization where many visitors arrive with an immediate task, not a desire to browse company stories. The regional identity is also important: this is Western Australia’s RAC, not every business sharing those letters. Microsoft’s 2021 conference account concerns pandemic-era Power BI reporting in that organization. It does not establish the technology behind today’s service cards or insurance journeys.
What you can learn
Use a place-based image to establish identity, but put common service tasks into explicit controls. Keep urgent assistance distinguishable from a general sales inquiry and make regional coverage understandable before someone commits to a journey. Familiar brand initials are not enough context for an international reader or a technology-adoption claim.
Pros
Product tiles make common tasks visible without reading the campaign copy.
The yellow action treatment provides contrast within the photographic opening.
Cons & considerations
Urgent help needs a clear route separate from promotional offers.
Several product families require thoughtful grouping on smaller screens.
Platform source: Primary documented Power BI association. Documented association: The 2021 source describes pandemic-era Western Australia reporting; not other RAC organizations. Platform evidence is separate from the direct website screenshot and is not a complete current infrastructure audit.
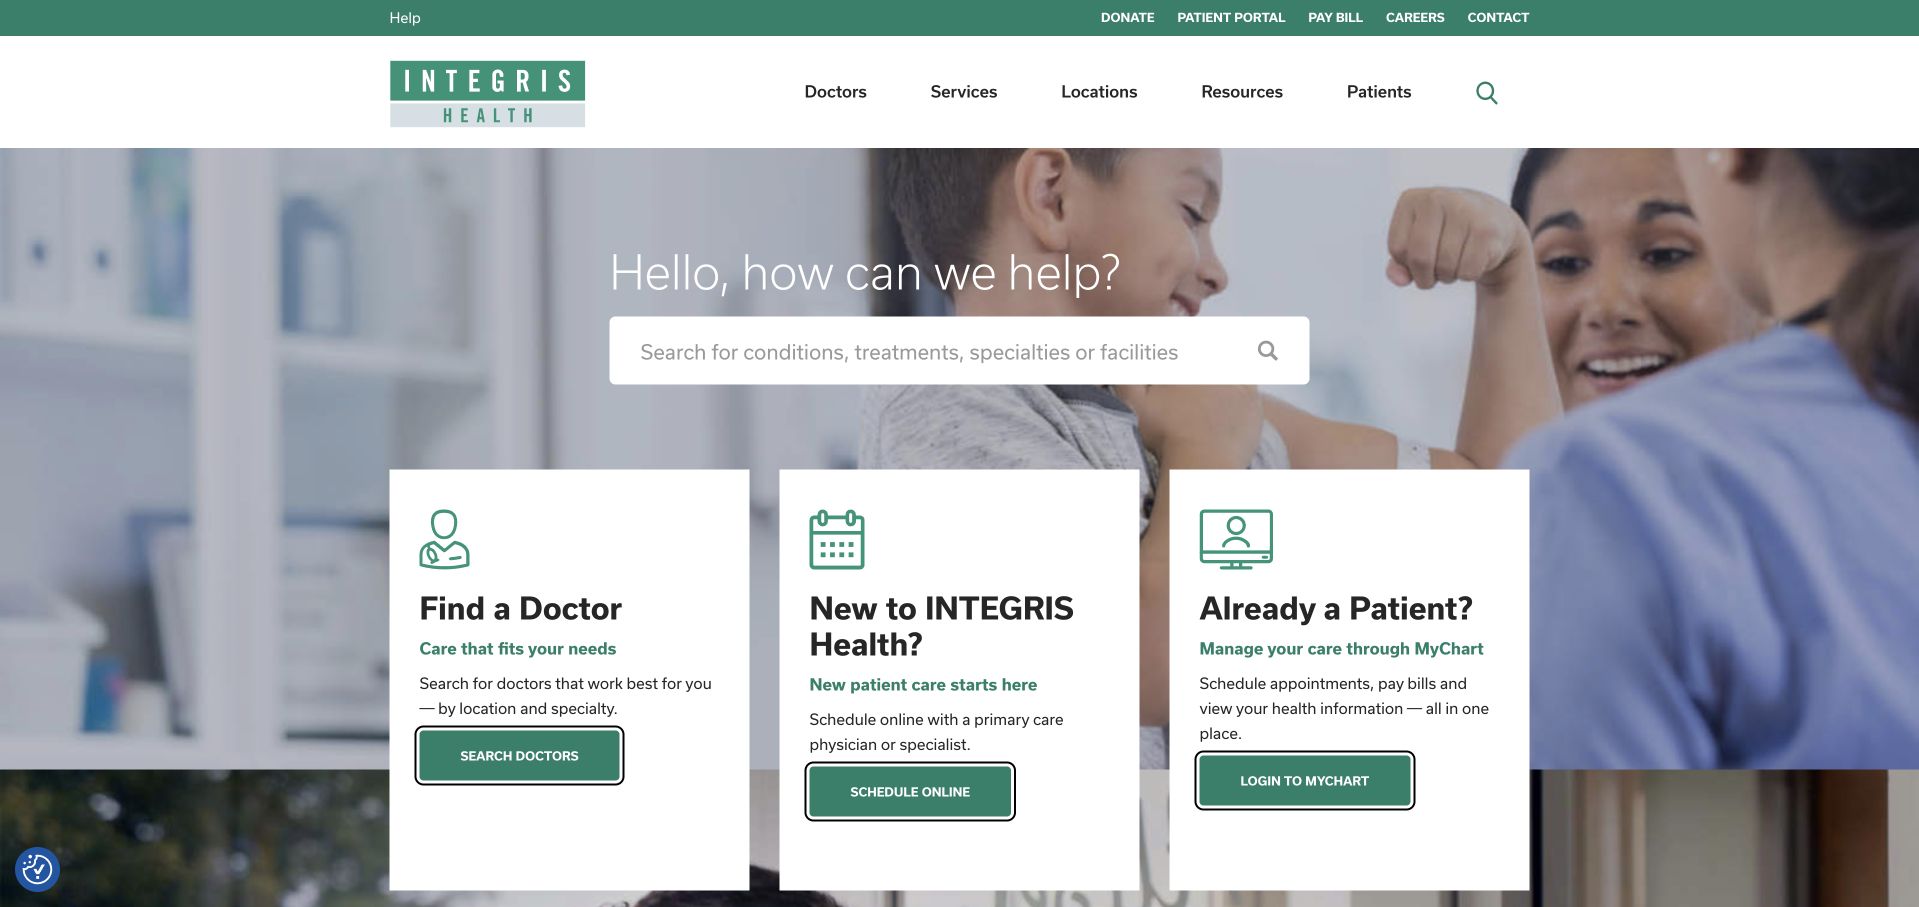
INTEGRIS Health uses a teal-and-white header above care-oriented navigation and patient-focused imagery. The opening differentiates practical journeys such as finding a doctor, seeking care and using an existing-patient route. That organization is more useful to study than a generic claim about compassionate service: the interface acknowledges that a returning patient and someone looking for a provider need different starting points. The 2021 Microsoft conference source describes Power BI embedded in an electronic health-record workflow. It is historical evidence about an internal clinical context, not proof of the public site’s CMS or an endorsement of any treatment or outcome.
What you can learn
Start a healthcare page with clearly named tasks and distinguish new-patient discovery from an existing patient’s tools. Keep emergency guidance and essential contact information separate from ordinary marketing actions. Use welcoming photography as support, while making navigation understandable without depending on the image or an interactive help widget.
Pros
Task-specific routes recognize different patient situations early.
The restrained teal system supports a consistent hierarchy of information.
Cons & considerations
Care-related wording needs precise destinations and appropriate urgent-care distinctions.
Additional assistance controls must not obstruct primary patient tasks.
Visible tech stack
Earlier / documented evidence
Power BI
Platform source: Primary documented Power BI association. Documented association: The 2021 conference describes Power BI embedded into an EHR; internal clinical workflows, not public-page technology. Platform evidence is separate from the direct website screenshot and is not a complete current infrastructure audit.
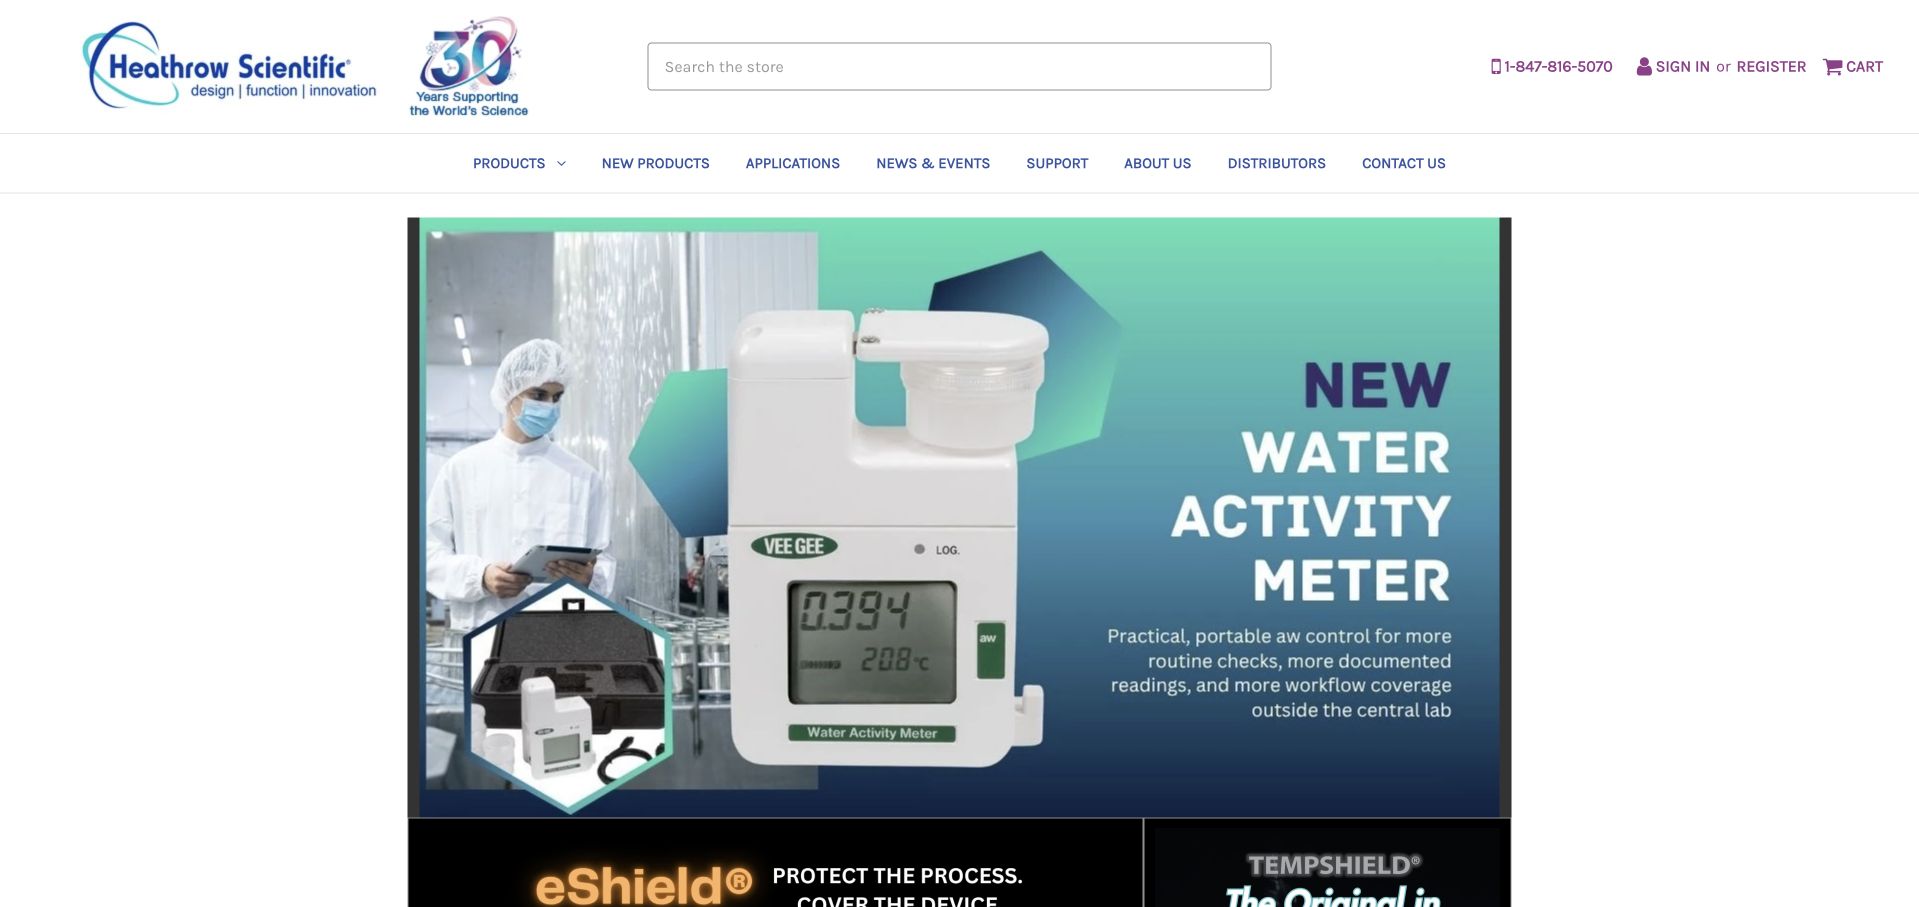
Heathrow Scientific opens as a laboratory-equipment catalog, with search and product navigation given a prominent role. A teal product feature introduces a water-activity instrument, while the surrounding header keeps catalog exploration and trade-oriented utilities available. The page’s specific product imagery supplies more information than a generic laboratory photograph would. It also prevents an easy identity mistake: this company is the laboratory-products manufacturer, not the airport. Microsoft’s customer account describes Dynamics 365 Business Central and Power BI visualization in the business. That association does not establish the storefront framework or verify the instrument’s technical performance.
What you can learn
Show the equipment a specialist customer is trying to understand, then provide a clear path to specifications, documentation and related products. Keep search available for returning buyers who already know a model or category. Separate a prominent product campaign from the permanent catalog so the feature can change without disrupting the procurement journey.
Pros
Specific equipment imagery makes the featured category immediately understandable.
Prominent search supports visitors who arrive with a known product in mind.
Cons & considerations
A product hero still needs accessible specifications and documentation.
Technical claims require evidence beyond the quality of the presentation.
Visible tech stack
Earlier / documented evidence
Power BI
Platform source: Primary documented Power BI association. Documented association: Laboratory equipment manufacturing analytics with Power BI; this is not Heathrow Airport. Platform evidence is separate from the direct website screenshot and is not a complete current infrastructure audit.
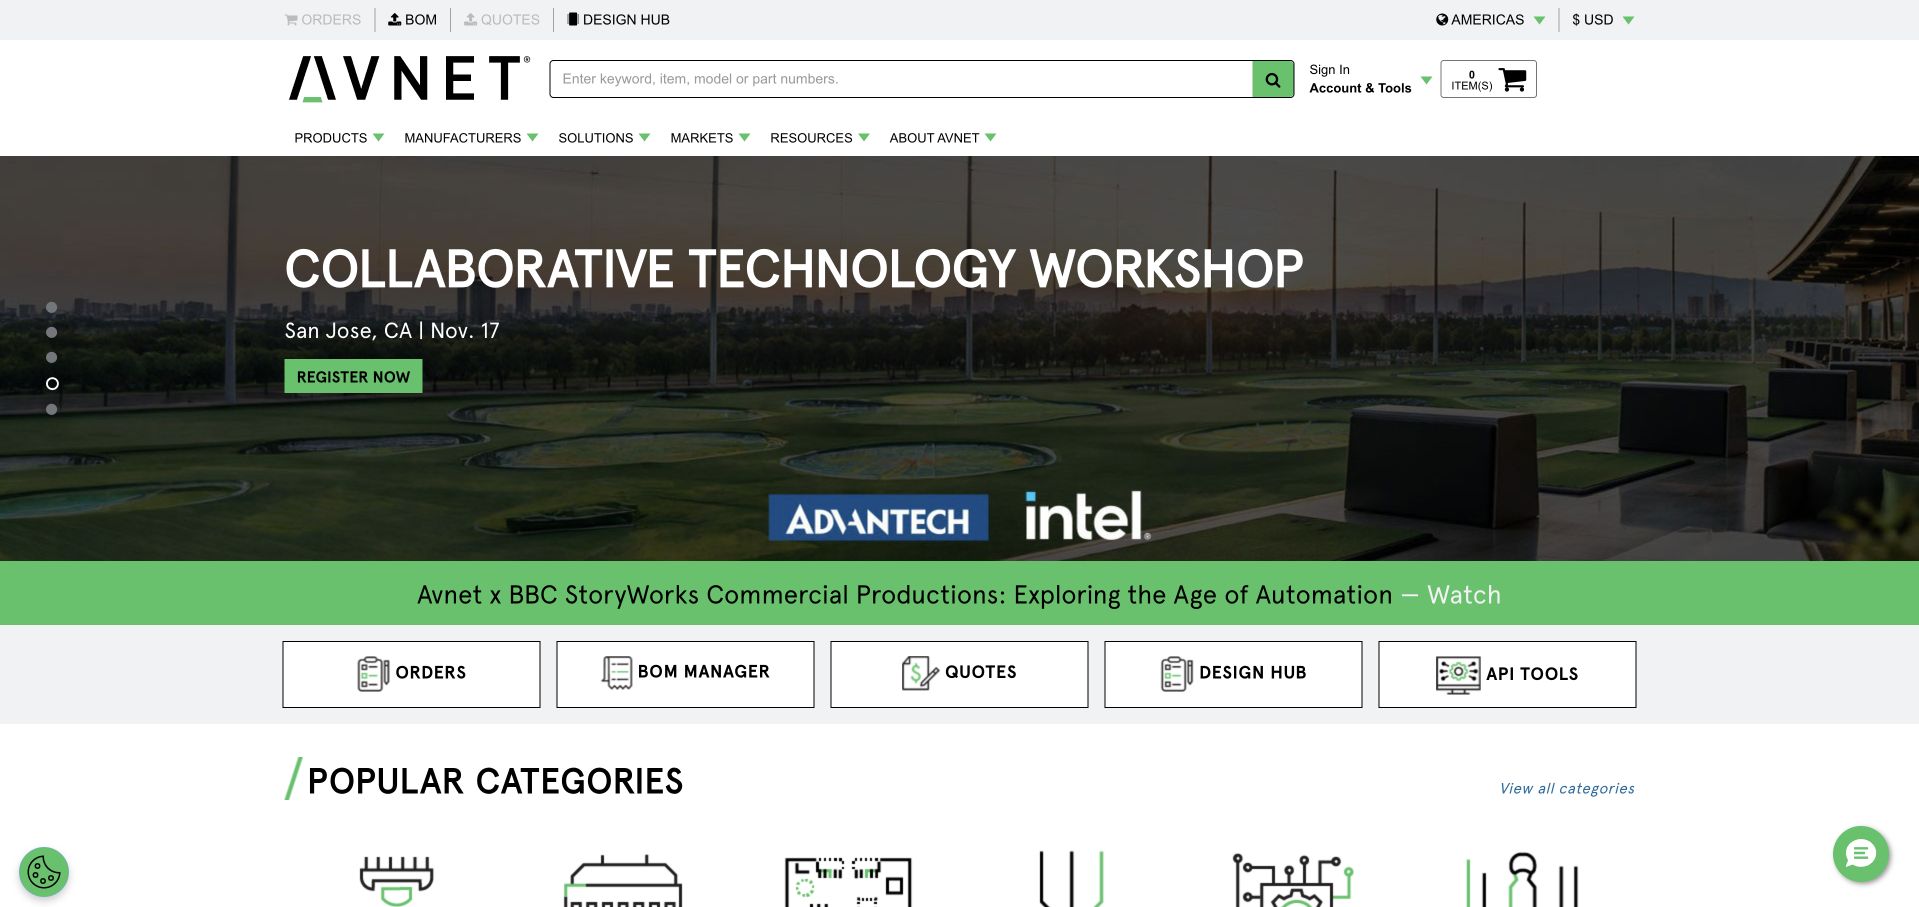
Avnet’s inspected Americas page combines an engineering-oriented campaign with a header built around practical tasks. Search, bill-of-materials tools, ordering, quotation and design resources appear as distinct destinations rather than being buried in a broad company introduction. The workshop-style image and green action treatment give the opening a recognizable engineering context, while the utility structure acknowledges repeat professional use. This is a regional public surface, not a view of private purchasing data. The cited 2021 Microsoft conference material describes Power BI within an internal Power Platform adoption story; it does not identify the implementation of the component storefront.
What you can learn
Map professional tasks before choosing one universal action. Design research, component-list uploads and order checks need different routes. Use campaigns to introduce a subject while keeping recurring utilities stable and plainly labeled.
Pros
Distinct task shortcuts support several stages of an engineering purchase.
The campaign image relates directly to the practical context of the catalog.
Cons & considerations
Numerous utilities need a clear priority order on mobile.
Regional availability and account requirements should be explained before a task begins.
Visible tech stack
Earlier / documented evidence
Power BI
Platform source: Primary documented Power BI association. Documented association: The 2021 conference names Power BI in Avnet operational Power Platform use; historical enterprise scope. Platform evidence is separate from the direct website screenshot and is not a complete current infrastructure audit.
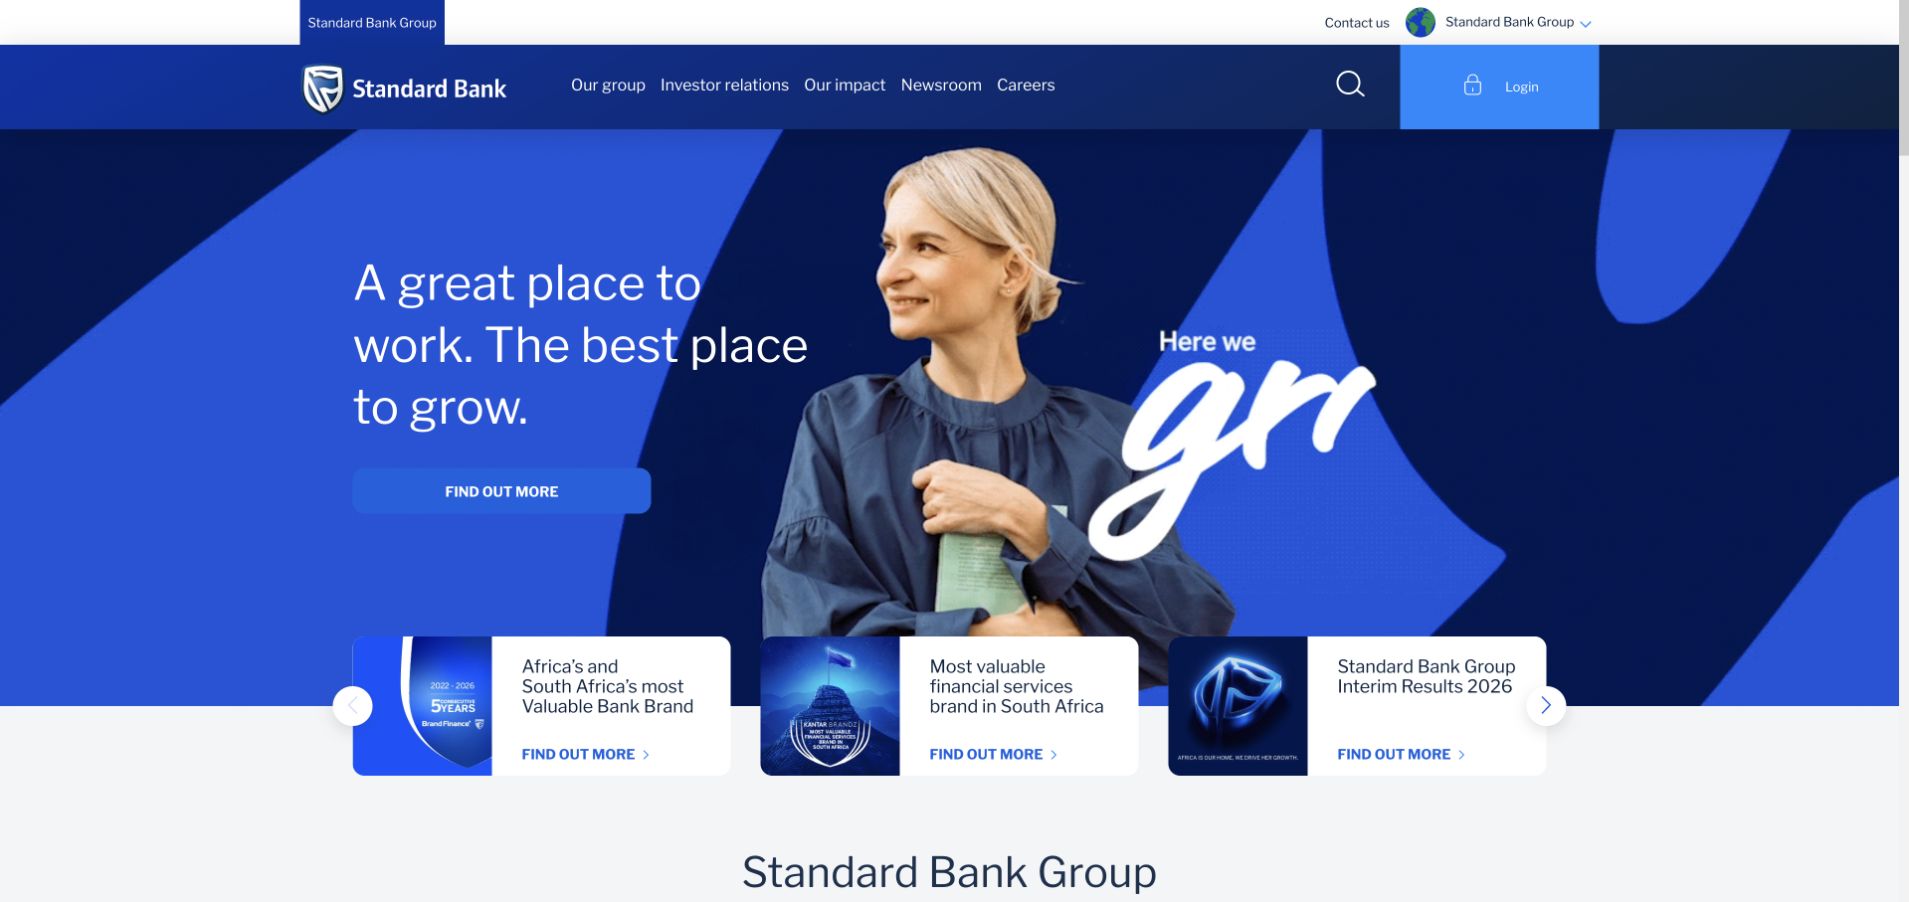
Standard Bank’s group page uses a blue geometric visual system around a portrait-led corporate feature. The strong shapes and restrained palette establish a recognizable identity, while a row of supporting information introduces more than one institutional destination. The opening is not a customer’s private banking dashboard or an account application; its role is to explain the wider group and its current stories. Microsoft’s 2021 conference material documents business analysis and automated machine-learning work through Power BI. That historical enterprise case is separate from the current public page and should not be treated as evidence of its rendering technology or financial-product suitability.
What you can learn
Use a consistent visual system to connect corporate stories, then make audience destinations explicit. A portrait can humanize a large financial organization without turning every message into a product offer. Keep investor information, careers and customer-service handoffs clear, especially when the corporate site is distinct from country-specific banking properties.
Pros
A limited blue palette keeps a strong geometric composition coherent.
Supporting destinations prevent the hero from becoming the only available story.
Cons & considerations
Corporate and country-specific consumer journeys need clear handoffs.
Visual confidence should not be confused with evidence for financial claims.
Platform source: Primary documented Power BI association. Documented association: The 2021 conference describes business analytics/AutoML; not proof of the public bank-site runtime. Platform evidence is separate from the direct website screenshot and is not a complete current infrastructure audit.
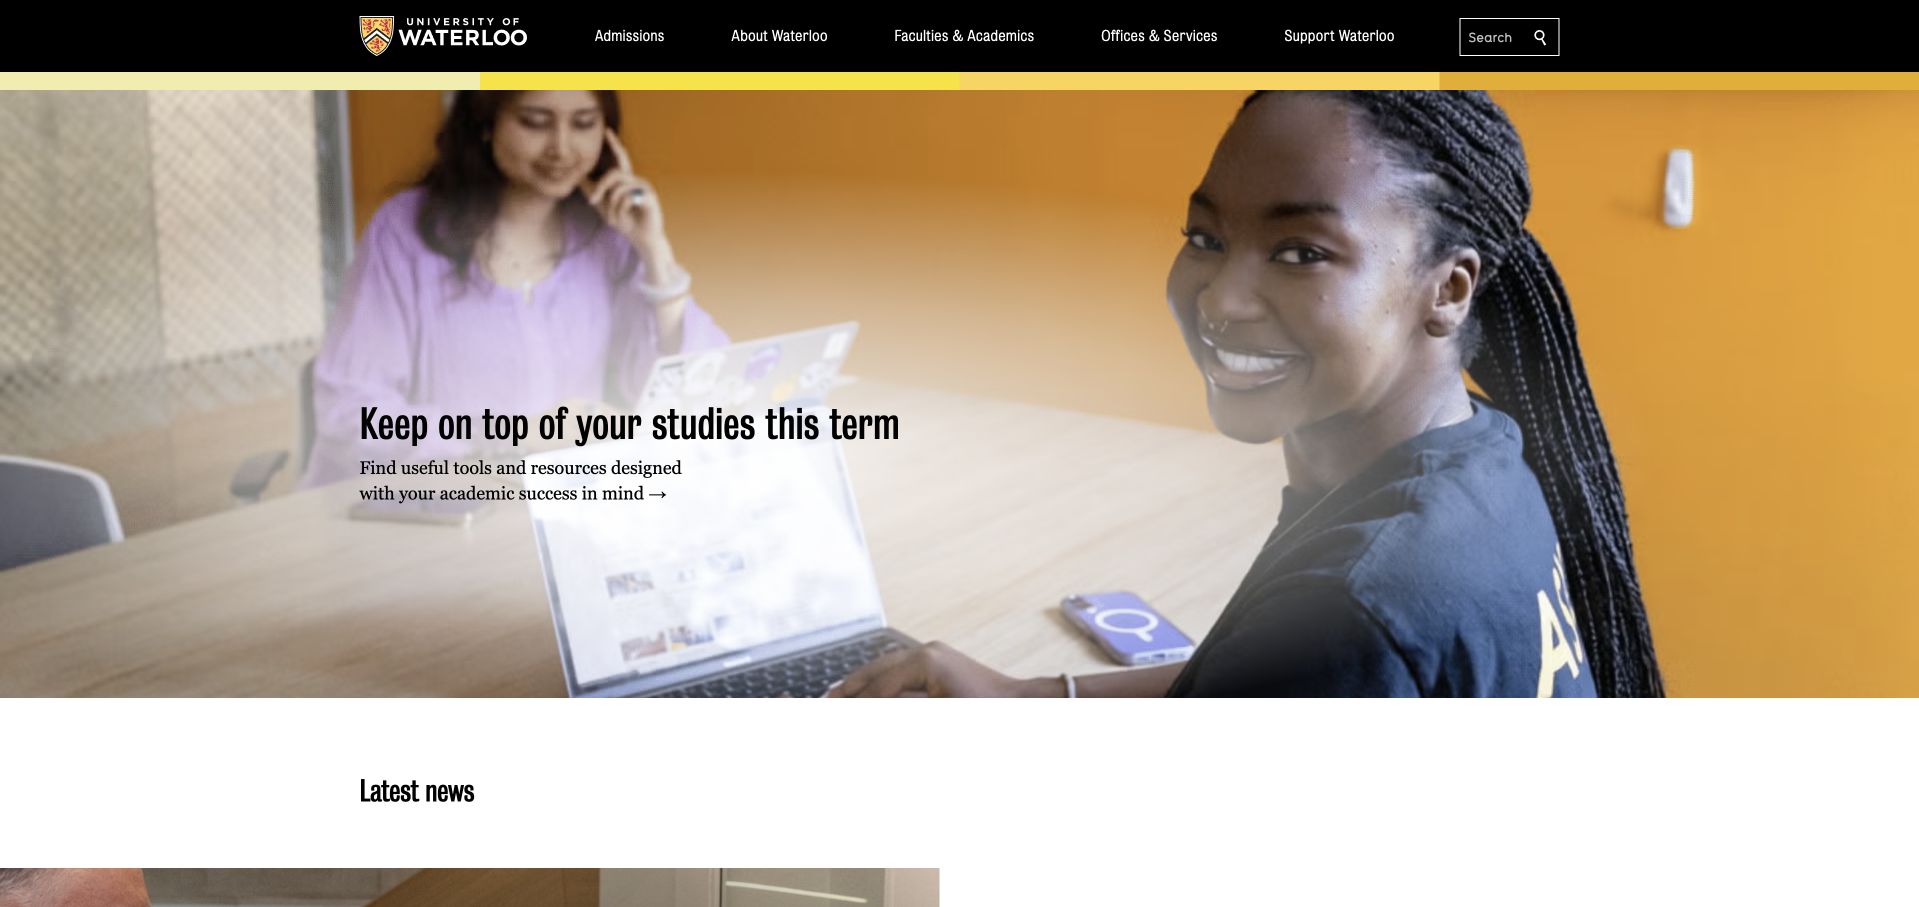
The University of Waterloo uses its black-and-gold identity above a large student-focused photograph and a timely study-related feature. The strong institutional header provides continuity even when the lead story changes. The image gives the current subject a human setting without trying to explain the entire university in one scene. A university homepage must also work for researchers, applicants, staff and alumni, so its permanent navigation carries responsibilities that the featured article cannot. Microsoft’s 2021 conference source concerns campus reporting and dataflows during COVID-19. It is historical evidence of a Power BI workload, not a current inventory of the public website.
What you can learn
Let a student story add relevance while preserving enduring audience routes. Make the article’s context clear and keep essential academic information outside temporary campaigns. A recognizable identity lets imagery change without making repeat visitors relearn the page.
Pros
The black-and-gold identity creates continuity around changing editorial content.
Student photography grounds a broad institutional destination in a specific experience.
Cons & considerations
A single lead story cannot represent every university audience.
Academic and administrative tasks need dependable routes outside the feature.
Platform source: Primary documented Power BI association. Documented association: The 2021 conference describes campus reporting/dataflows during COVID-19; historical institutional scope. Platform evidence is separate from the direct website screenshot and is not a complete current infrastructure audit.
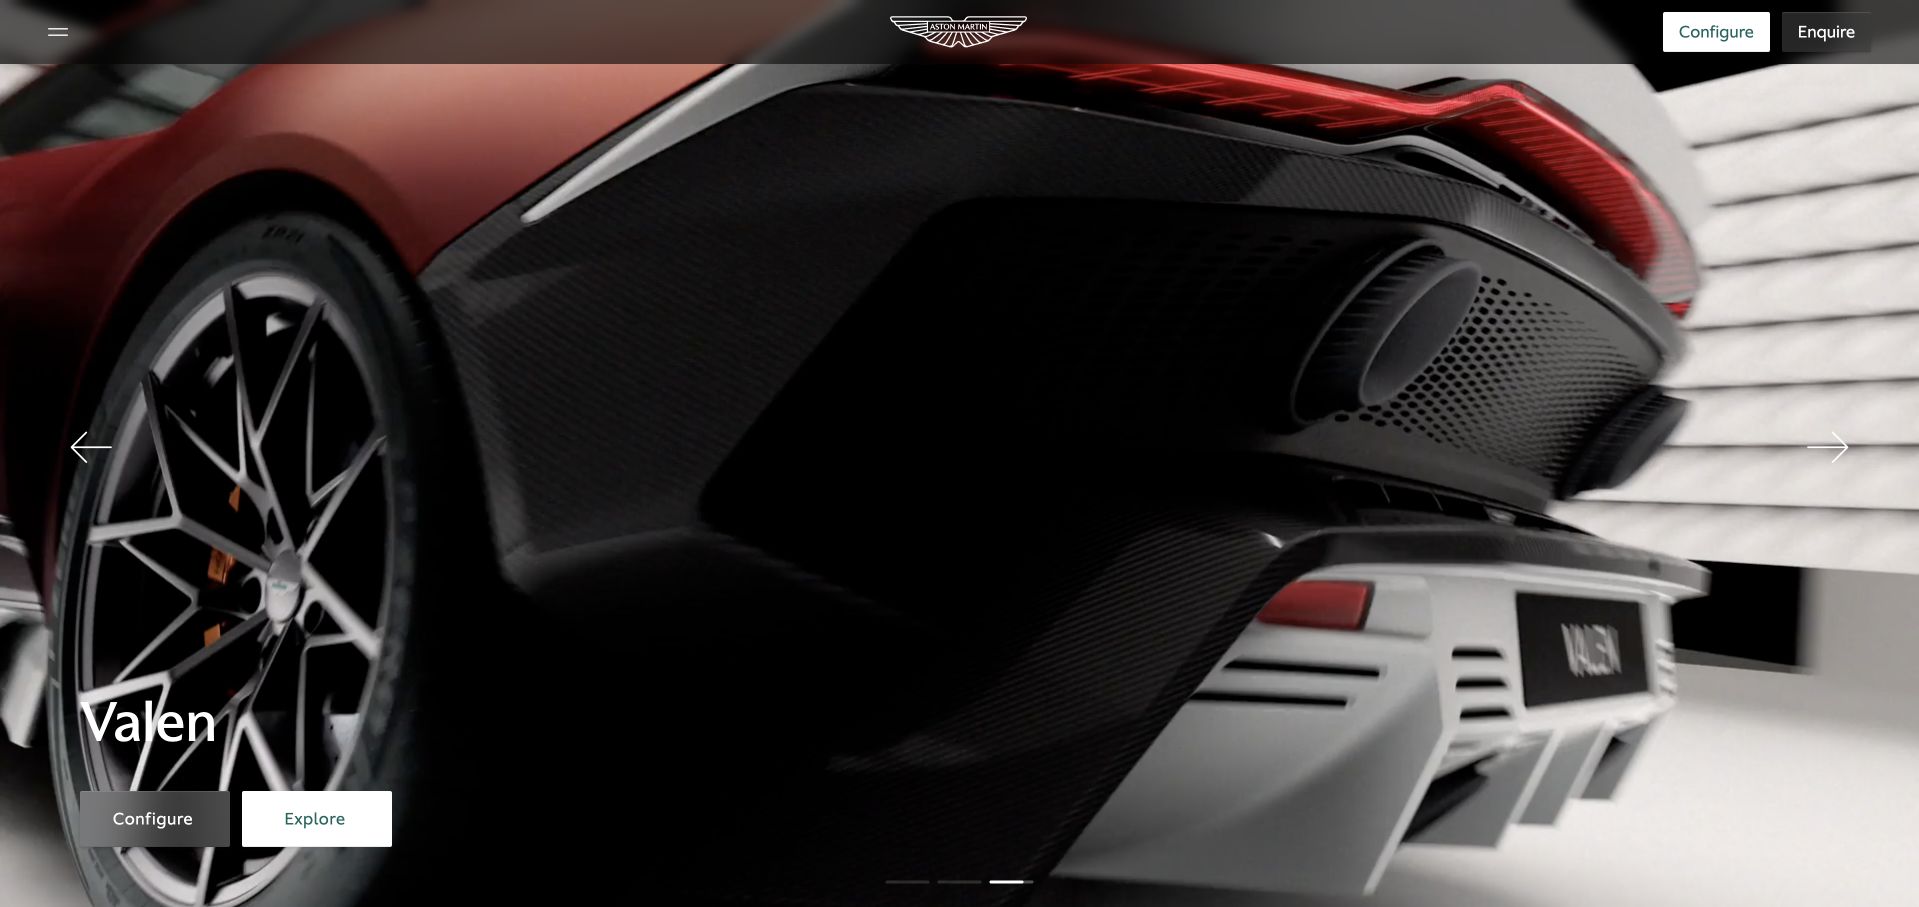
Aston Martin’s international page gives most of the opening to a close view of the car, with restrained navigation and a small set of product-oriented actions. The image treatment emphasizes form and atmosphere rather than a dense specification table. Configure and inquiry routes make the commercial next steps recognizable without filling the image with buttons. This approach depends on the product being visually meaningful, so it is not a universal template for less familiar services. Microsoft’s 2017 account describes enterprise decision-making with Power BI and Office 365. That dated association is not proof of the technology behind the current car presentation or configurator.
What you can learn
Let a visually meaningful product lead and make the next steps deliberate. Keep specifications, comparisons and ownership information available beyond the cinematic impression. Preserve usable controls, accessible descriptions and an informative fallback for slow media.
Pros
The restrained interface gives the product a clear visual priority.
Configuration and inquiry are recognizable, distinct commercial actions.
Cons & considerations
Large media needs performance care and an informative fallback.
Atmosphere should lead to accessible specifications rather than replace them.
Platform source: Primary documented Power BI association. Documented association: Microsoft’s 2017 account describes enterprise decision-making with Power BI and Office 365; historical scope, not proof of the current public frontend. Platform evidence is separate from the direct website screenshot and is not a complete current infrastructure audit.
Kegan has 15+ years of experience working with small businesses, Fortune 500 companies, and everything in between. No development job is too big or too small: he brings the same hands-on attention to a focused improvement, a complete website, or a custom application.
For Power BI projects, he can help with reporting requirements, data connections, metric definitions, embedded dashboards, access boundaries, validation, and maintainable handover. He works directly with clients on scope, design, implementation, testing, and handover, with an emphasis on clear communication and a system that remains practical to maintain after launch.
Show 3 other Power BI developersHide other Power BI developers
Three reporting briefs with different delivery needs
Internal organizational reporting
Define the employees, roles and recurring decisions the report supports. Establish a clear entry point, data ownership and a way to report discrepancies. A small, trusted operational report is a better initial milestone than a large collection with inconsistent definitions. Evaluate the appropriate organizational embedding or sharing route against the actual access requirements.
Treat analytics as a feature of the application, with explicit account boundaries and support behavior. Microsoft distinguishes customer embedding from organizational embedding. Choose against the actual audience and authentication model; verify current commercial requirements for the intended deployment instead of assuming a particular license from an old customer case.
Use public sharing only for material explicitly approved for unrestricted publication. A public report is not a private customer portal with a less complicated login. Review the source data and publication decision before generating a link, and give the published page a date, methodology and named correction process.
Plan definitions, access tests and the report’s operating life
Write the decision and reconciliation brief first
Choose one recurring question and describe the action a reader should be able to take after reviewing the report. For a sales report, specify whether the unit is an order, a line item or a payment. Explain how cancellations, refunds, delayed entries and currency differences are handled. Include a short worked example with expected totals. This gives reviewers something more useful than a visual preference when deciding whether the report is correct.
Record the period and comparison explicitly. A month-to-date total compared with a complete prior month can be misleading even when both numbers are technically accurate. Agree on the relevant timezone and the way incomplete periods are labeled. Put freshness information where the reader can find it. If an upstream source fails, the interface should distinguish an old but valid report from a current result.
Keep the initial scope narrow enough to reconcile. Name the business owner of each definition and the person responsible for investigating differences. Separate acceptance of the measures from approval of the visual styling. A project can then improve the layout without silently changing the meaning of the figures, or change a definition through a reviewed process without disguising it as a cosmetic update.
Test the sharing model with deliberately different users
Create an audience map before embedding a report. Distinguish internal employees, external customers, administrators and people who should have no access. Choose the supported route for that audience and confirm its current requirements. Do not assume that because a report opens in an administrator’s browser it will behave correctly for a customer or a person without a reporting account.
Review data isolation at the appropriate layer. Microsoft documents row-level, object-level and model or workspace isolation approaches in embedded scenarios. The right choice depends on the actual application and data boundaries. Treat a visible filter as a convenience unless it is part of an intentionally designed security mechanism. Test with accounts that should see different records, and include download or export behavior in the acceptance review.
Keep unrestricted publication separate. Microsoft warns that Publish to web allows unauthenticated internet access, including underlying model detail. It is not the fallback when a private embedding setup is difficult. Require a deliberate public-data approval for that route. For private experiences, document how authorization failures, expired sessions and account changes should appear, and keep privileged credentials out of the public browser bundle.
Review the report with representative data rather than a perfectly tidy demonstration. Include a long label, an empty period, an unusually large result and an account with limited permissions. Test whether the meaning survives a narrow layout and whether a keyboard user can reach the important controls. Use color as support, not the sole signal for a critical state. Place explanatory text near the decision it supports instead of hiding every definition in a separate manual.
Agree on acceptable loading behavior and test the common filter combinations. If a report is slow, identify whether the issue lies in the source, the model, the refresh process or the interface. Keep diagnostics available to maintainers without leaking sensitive details to public error messages. Avoid promising real-time figures when the source and refresh process cannot support that expectation.
The handoff should include the audience map, definitions, source dependencies, access tests, publication approvals and recovery instructions. Name the owner who can pause an unreliable output and the person who approves changes. Preserve a small set of known examples for future regression checks. A maintainable report is one that another person can explain and recover, not merely one that looked correct in the launch meeting.
A useful handover demonstration
Ask the actual team to carry out its routine job: publish a realistic update, correct a mistake, preview a narrow screen, and identify who owns an integration failure. For a library or frontend framework, also ask who maintains the content source and deployment. A polished screenshot does not answer those operational questions.
Beyond the screenshot
Power BI project brief checklist
Name the report’s audience and the decision it supports.
Define row meaning, measures and exclusions with worked examples.
Agree on periods, timezone and incomplete-period labeling.
Identify data owners and a reconciliation process.
Choose the appropriate organizational, customer or public delivery route.
Verify current requirements for the intended deployment.
Test users with different permitted data scopes.
Review download and export behavior as well as on-screen filtering.
Keep unrestricted Publish to web separate from private reporting.
Show freshness and explain empty, stale and failed states.
Test keyboard access and realistic narrow-screen layouts.
Document change approval, incident ownership and recovery.
Test with real content, a keyboard, a small screen, slow or failed requests, and the people who will maintain the system. These are planning checks, not an accessibility, security, performance, or search-ranking certification.
Sources & editorial method
How this Power BI collection was reviewed
Twenty independently inspected public pages are paired with checked Microsoft workload evidence. Dates and subsidiary boundaries are retained, including historical conference associations. This is an editorial design collection and original project-planning guidance, not a complete infrastructure audit or financial, clinical or product endorsement.
Every image is an unmodified capture from the actual website, with its source and capture date. Some captures are reused from our shared catalog; their dates remain the original capture dates. None comes from a vendor gallery or a generated reconstruction. Moving imagery and live content can change.
Technology attribution uses public page assets or metadata, official platform documentation, or a cited first-party project case study. Documentary and framework-relationship evidence is identified where used; it is not a complete current backend inventory. A CMS image CDN alone does not establish a full CMS deployment. A library’s presence does not prove which individual controls use it, and a platform label does not establish AI authorship.
The composition notes, lessons, pros and tradeoffs are original editorial observations. We have not measured conversion, traffic, security, performance or accessibility conformance. Website owners retain their brands and imagery; these examples are not our client portfolio. Written, Edited and Curated are independent records, not dates advanced by a build. See our editorial standards or suggest a correction.
Questions worth asking
Power BI website development FAQs
Does Power BI adoption identify a company’s website technology?
No. The sources describe bounded reporting workloads. A public marketing page can use a different CMS, framework and delivery stack. Some cases also concern a subsidiary or a historical implementation rather than the whole current organization.
Is Publish to web suitable for private customer reports?
No. Microsoft explicitly warns that it is unauthenticated public sharing. Private customer reporting needs an intentionally designed access model, not an unlisted public URL.
Are report filters enough to separate customers?
Do not assume so. Design and test the appropriate data-isolation approach for the actual application. The visible filter state alone is not evidence that a user cannot access records outside their account.
Should a new report reproduce every existing spreadsheet?
Begin with a bounded decision and a reconciled set of measures. Inventory older outputs, but replace or retire them through an explicit review rather than translating every sheet without understanding its users.
What belongs in the maintenance handoff?
Include definitions, audience boundaries, source dependencies, access tests, refresh expectations and recovery steps. Name the people who approve changes and investigate discrepancies so the report remains understandable after the original implementation team leaves.
Begin with one useful, reconciled report and a deliberate sharing model. Expand when the definitions, permissions and maintenance responsibilities are clear.