Best BigQuery Websites of 2026 (20 Real-World Examples)
Public website design references from organizations with documented BigQuery data workloads.
Study 20 recognizable public experiences alongside carefully scoped analytics cases. BigQuery is an analytical data platform—not a CMS, a frontend framework or a reason to replace a transactional website database.
The first five examples are Spotify, Etsy, The Home Depot, AT&T and Best Buy. Their public pages illustrate subscription marketing, company storytelling, corporate publishing and consumer-service routing. Separately checked Google Cloud material documents particular BigQuery workloads inside those organizations. The screenshot and the architecture source answer different questions.
Use the collection for two kinds of thinking: what makes a public interface understandable, and what an analytical project must define before implementation. A company using BigQuery for reporting, inventory analysis or contact-center work does not establish that its pictured marketing page runs on it, that every group company shares the same stack or that the cited architecture remains unchanged.
Before the examples
What makes good BigQuery website development in 2026?
Define the analytical question before choosing the platform
Start with a decision, report or dataset that needs improvement, not a warehouse logo. Explain the inputs, the result and the people who will use it. Keep checkout writes, account changes and other transactional duties separate from the analytical design; a reporting project is not automatically a migration of the website’s operational database.
Treat spend as part of query design
Google documents different controls for on-demand and capacity-based compute. Choose a model against representative work, not a slogan about serverless savings. Establish an owner for query behavior and spending review. Cost estimates, limits and alerting should be designed into the project rather than added after an unexpectedly expensive exploratory query.
The person or service running a query and the data it may read are separate design questions. Map required actions to the relevant resources and review the actual IAM permissions. Avoid using a broad administrator grant as a shortcut merely because it makes a prototype work; document the intended operating boundary before production.
These are exactly 20 public design references paired with documented organizational workloads, not 20 marketing websites proven to be built with BigQuery. Read each evidence scope before generalizing from a brand name.
We start with five recognizable brands or organizations: Spotify, Etsy, The Home Depot, AT&T, Best Buy. Each attribution applies to the named website property, not every product or website belonging to its organization. This is a curated reading sequence, not a measured ranking.
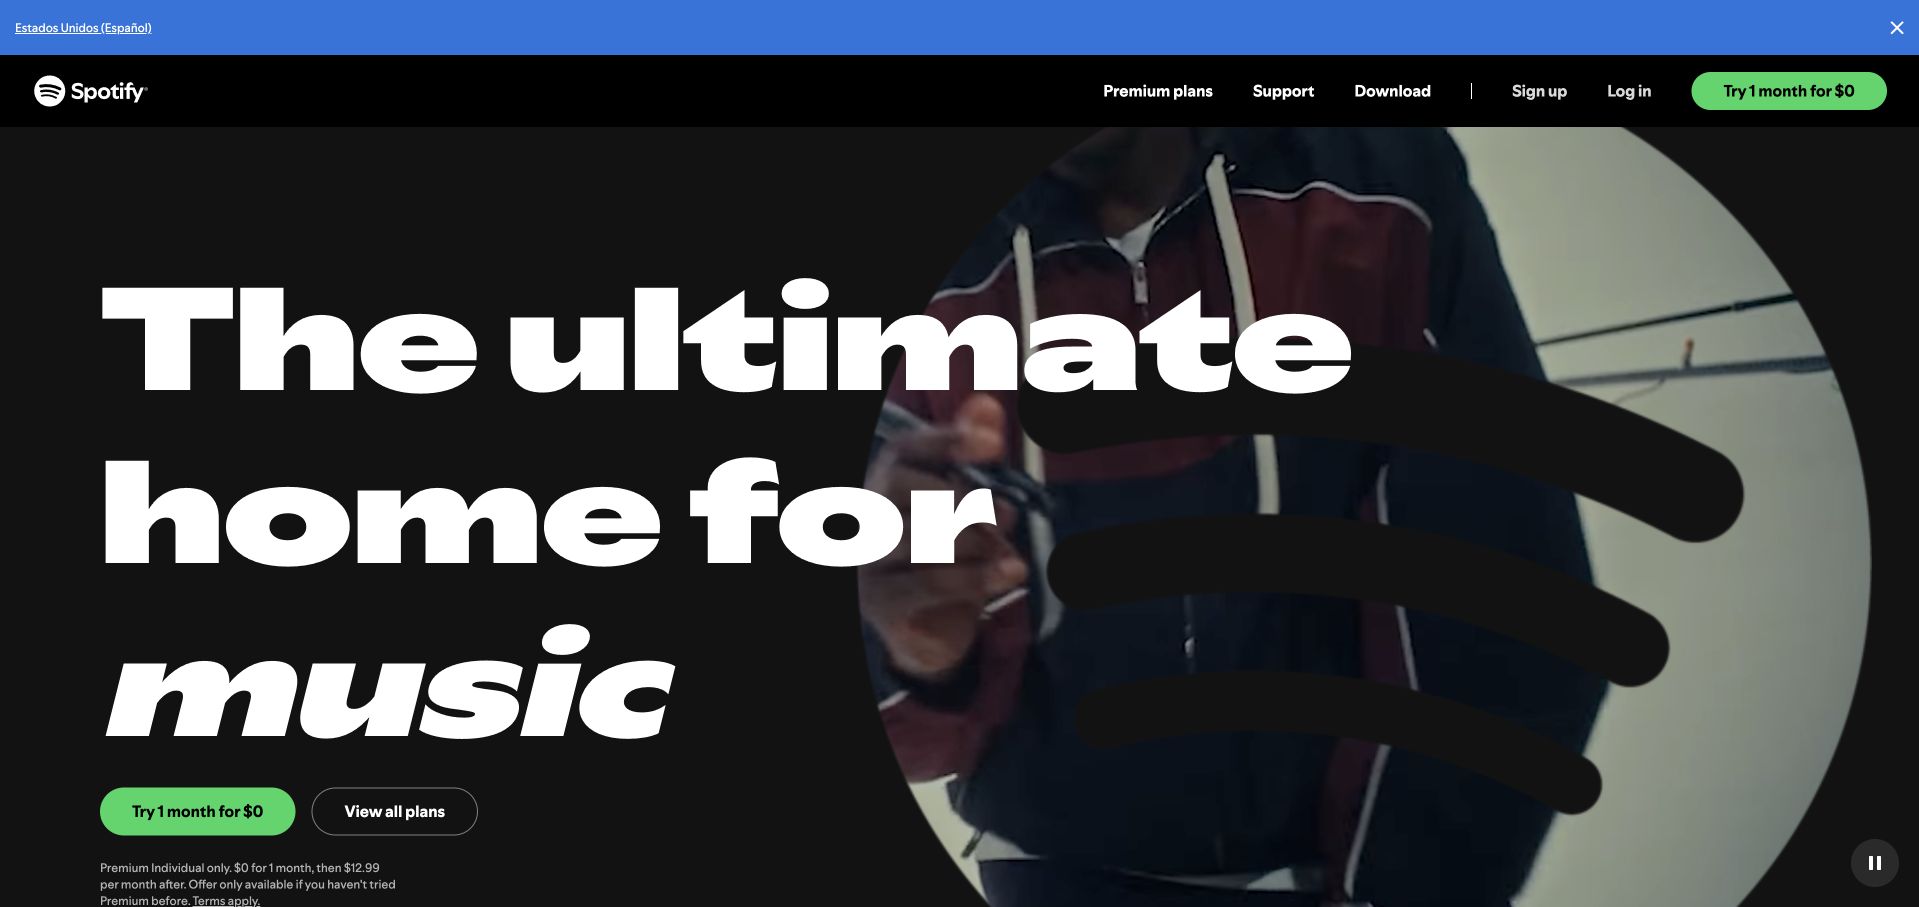
Spotify’s selected Premium page uses an oversized white headline, a dark moving image and a bright green trial action. Plan navigation and account routes stay in a compact black header. The visual focus is the subscription experience, not an explanation of data infrastructure. Google Cloud’s Spotify customer material separately documents a petabyte-scale BigQuery warehouse and a cloud migration relationship. That supports an organizational analytics association; it does not establish the runtime of this Premium page, every recommendation system or Spotify’s complete current backend. The distinction matters when studying an attractive consumer interface alongside a technical customer story.
What you can learn
Borrow the decisive consumer hierarchy while keeping infrastructure evidence separate. A subscription page can be visually simple even when the organization operates substantial analytical systems behind other workloads.
Pros
The contrasting green action is easy to identify within the dark subscription introduction.
Plan and account routes remain distinct from the promotional first-screen action.
Cons & considerations
Large moving media needs a readable static fallback and clear pause controls.
A Premium marketing page reveals little about the scope of the separately documented warehouse.
Platform source: Primary documented BigQuery association. Google Cloud documents Spotify’s BigQuery data warehouse. Platform evidence is separate from the direct website screenshot and is not a complete current infrastructure audit.
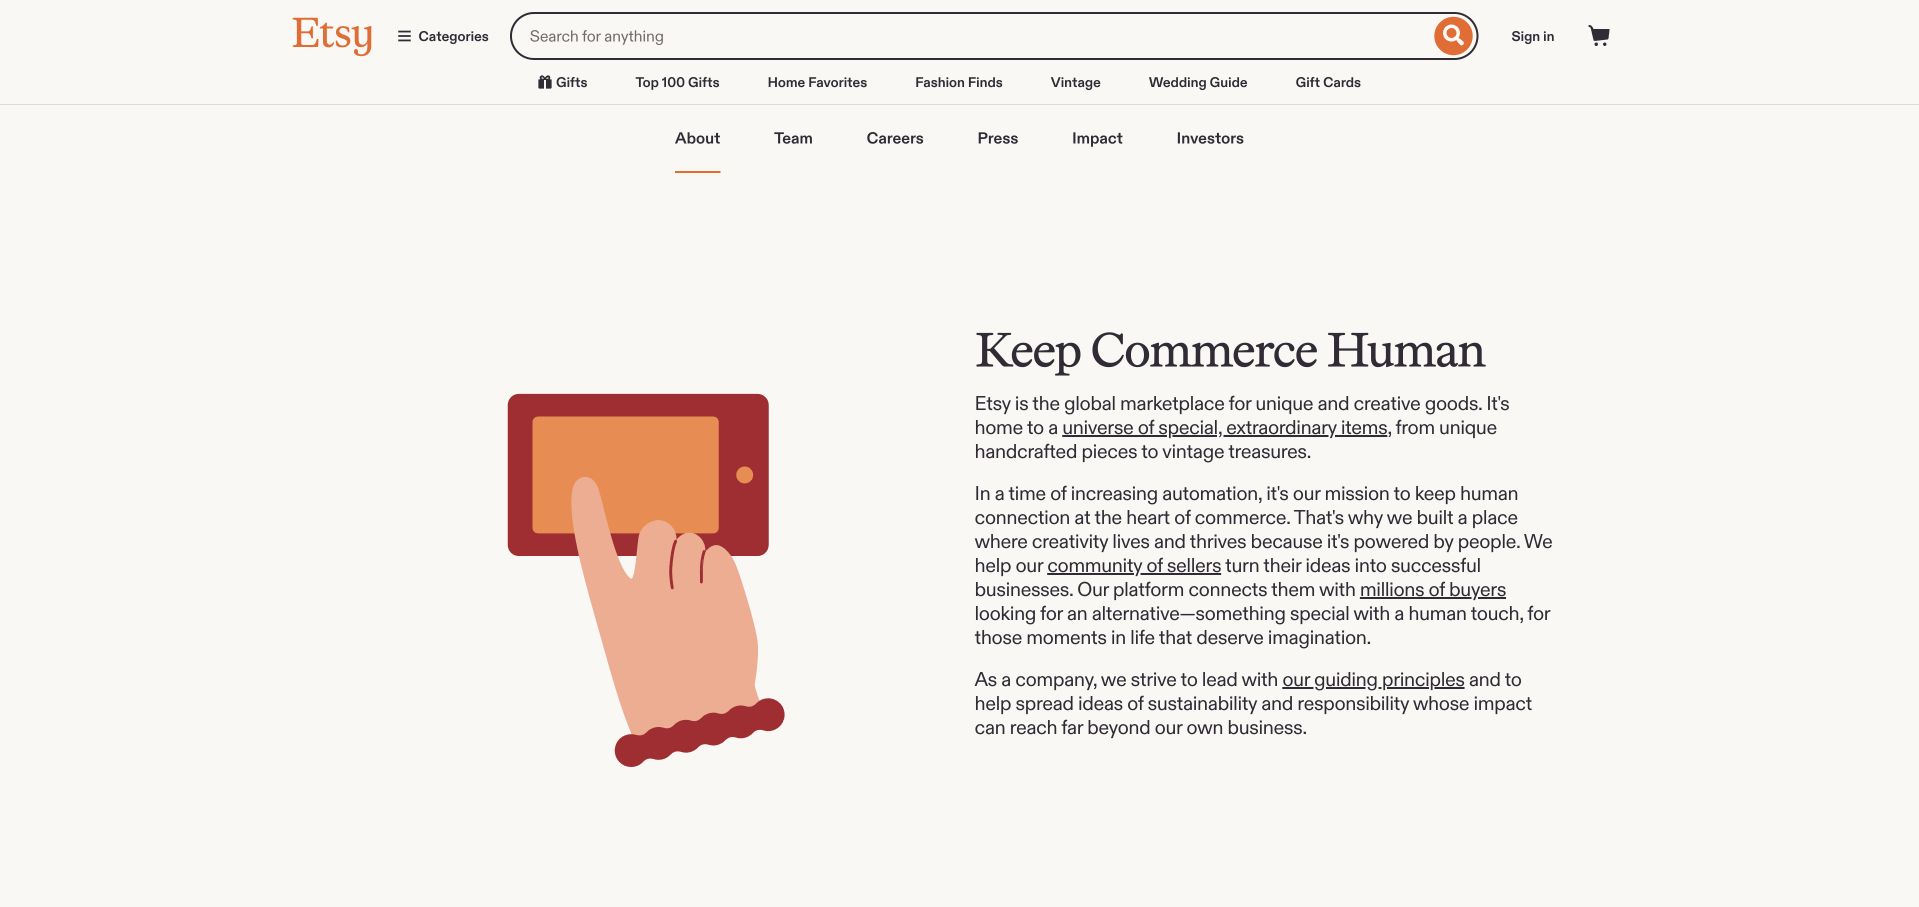
Etsy’s selected About page retains marketplace search and category navigation, then introduces its company mission through a simple illustration and a restrained text column. The cream background and generous spacing make the explanation feel different from a product grid without losing the brand. Google Cloud’s Etsy case describes BigQuery within inventory-data and discovery work alongside other services. It is evidence about that organizational workload, not a source audit of the pictured About page or proof that every marketplace function uses the same system. The useful design comparison is a human-centered public explanation paired with a carefully bounded technical case.
What you can learn
Keep a company’s mission readable within the wider product identity. When discussing its technology, identify the documented workload rather than treating a recognizable search bar as evidence of the data platform behind it.
Pros
The restrained text-and-illustration pairing makes the company story easy to scan.
Marketplace navigation preserves context for users moving between shopping and company information.
Cons & considerations
Retaining full shopping navigation can distract visitors who only want corporate information.
The public illustration cannot substantiate the inventory and discovery architecture described in the case.
Platform source: Primary documented BigQuery association. Google Cloud documents Etsy’s BigQuery inventory analytics. Platform evidence is separate from the direct website screenshot and is not a complete current infrastructure audit.
The Home Depot’s selected corporate page uses its orange identity, a substantial editorial image and a headline strip for a current seasonal story. Company, newsroom, investor and community routes sit below the prominent masthead. This is not the retail product-search homepage. Google Cloud’s customer case documents an enterprise BigQuery warehouse supporting analytical work such as forecasting, inventory and performance information. The case concerns that data environment, not the technology serving the pictured corporate newsroom or a complete current retail stack. The page is useful for studying how a recognizable retail identity can carry a separate company-publishing experience without copying the storefront’s task structure.
What you can learn
Match the analysis to the page actually pictured. Corporate storytelling and enterprise analytics can belong to the same organization while remaining different systems with different audiences and evidence requirements.
Pros
The orange masthead preserves brand recognition across a distinct corporate content destination.
Company and investor routes distinguish the page from an ordinary product-shopping interface.
Cons & considerations
Seasonal news imagery can dominate information that a corporate visitor needs more consistently.
An enterprise warehouse case does not identify the newsroom’s frontend or publishing system.
Platform source: Primary documented BigQuery association. Google Cloud documents Home Depot’s BigQuery analytics. Platform evidence is separate from the direct website screenshot and is not a complete current infrastructure audit.
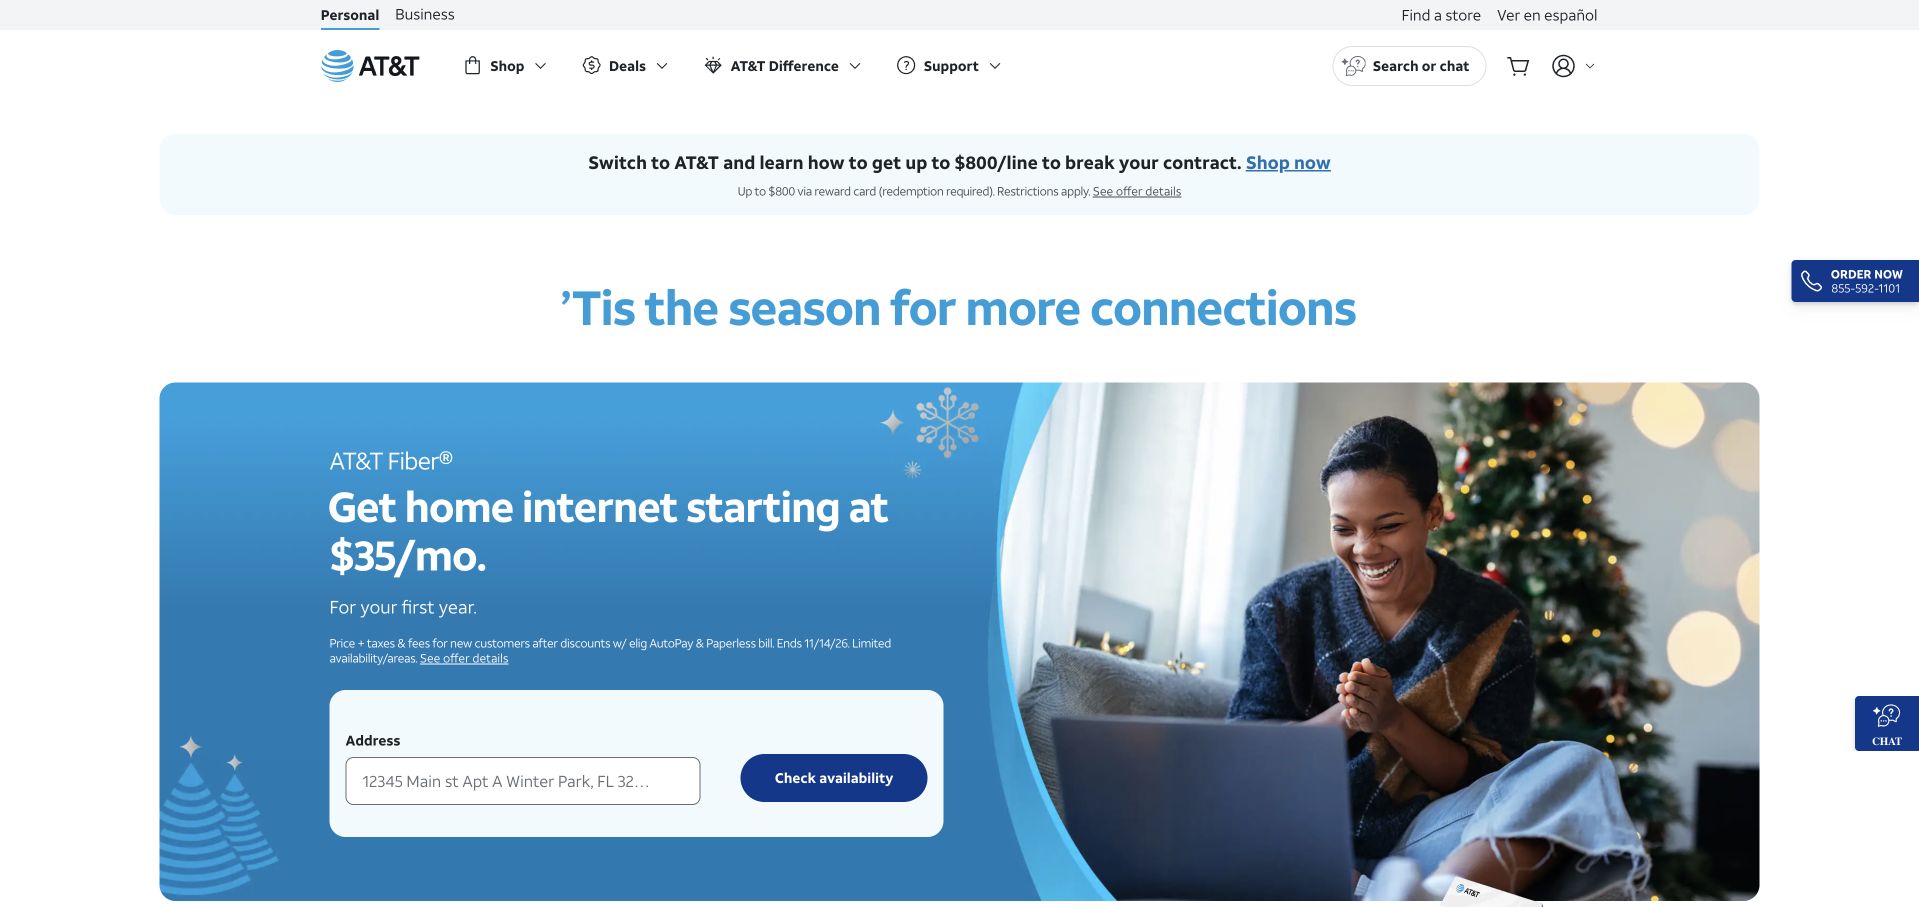
AT&T’s selected page combines a pale seasonal introduction with a blue home-internet offer panel. An address field and availability action make the immediate task concrete, while personal and business navigation remain separate. The page is a consumer-services storefront, not a contact-center dashboard. Google Cloud’s AT&T case describes BigQuery supporting intent analysis and routing within customer-service operations alongside conversational systems. That is a bounded organizational use case; it does not prove which technology serves the address checker or the current public page. The distinction keeps a useful interface observation from becoming an unsupported claim about the company’s entire web architecture.
What you can learn
Give a consumer a clear next task, then explain what the input returns. Technical customer-service evidence should remain attached to its documented operational scope rather than inferred from a similar-looking public interaction.
Pros
The address field gives the featured service offer a specific next step.
Personal and business routes help separate audiences within a large service catalog.
Cons & considerations
Several offer and utility bars compete for attention above the main interaction.
Contact-center routing evidence does not establish the implementation of public availability checking.
Platform source: Primary documented BigQuery association. Google Cloud documents AT&T’s BigQuery contact-center routing. Platform evidence is separate from the direct website screenshot and is not a complete current infrastructure audit.
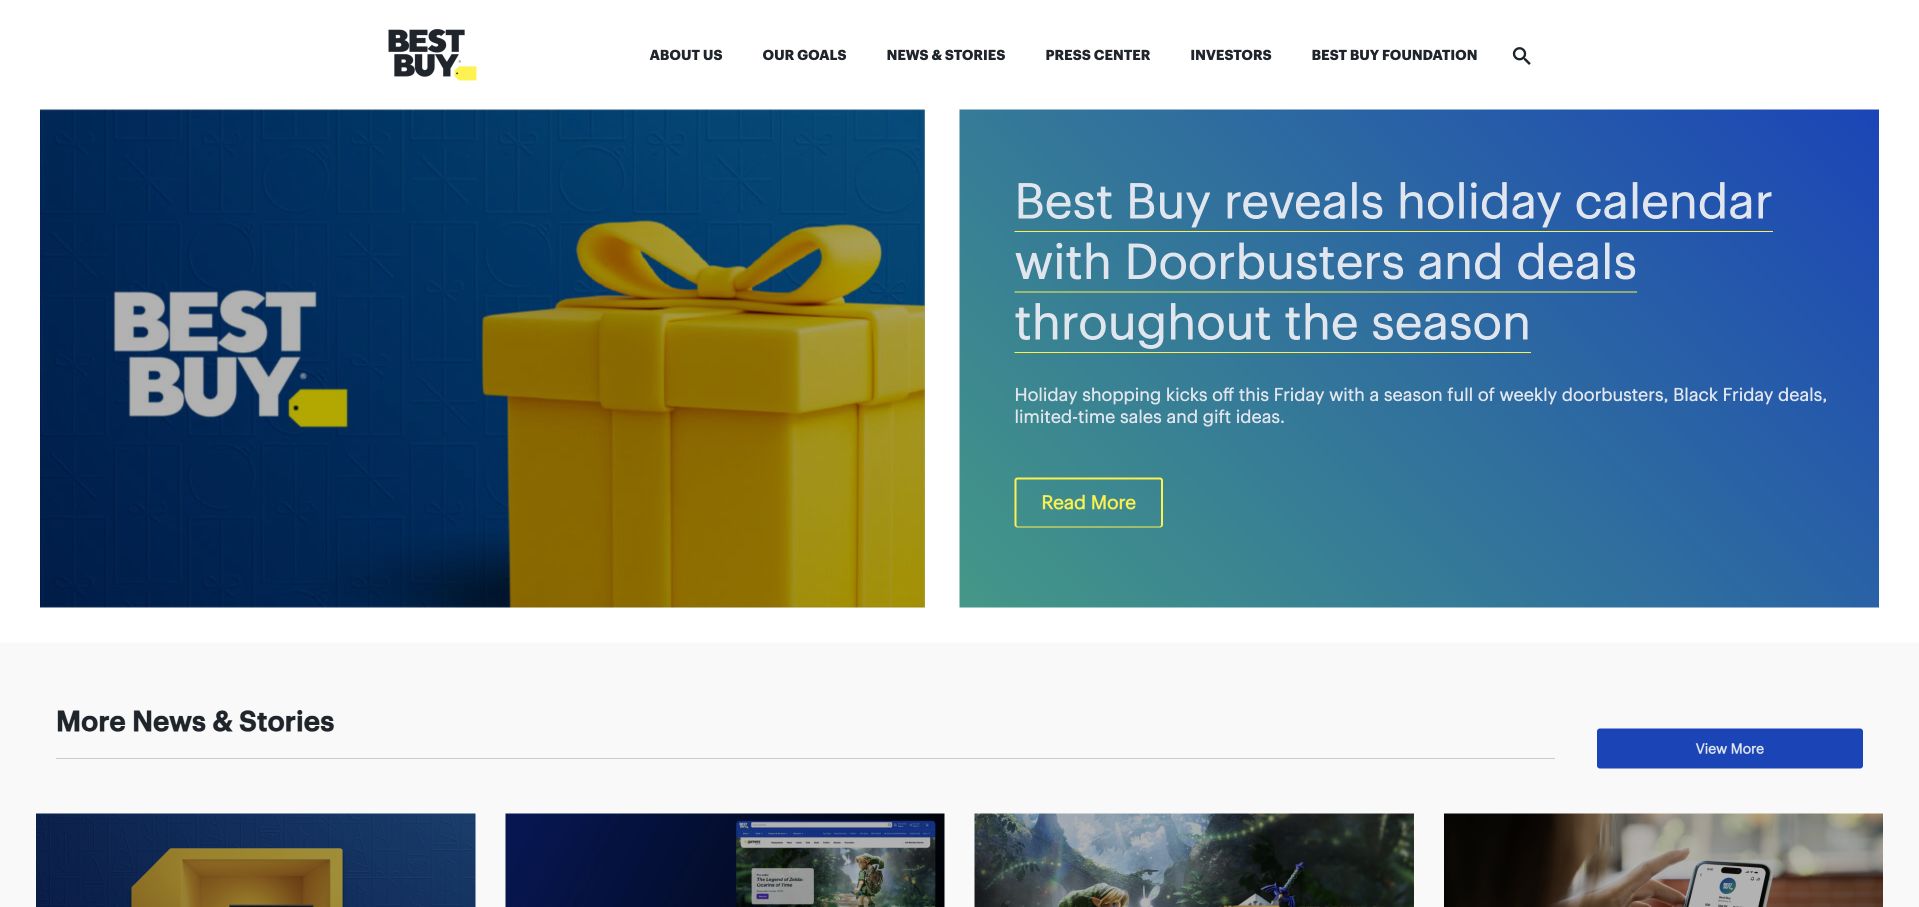
Best Buy’s selected corporate page places a large blue editorial feature below a simple white header. A product-themed image and a readable headline panel introduce seasonal news, followed by a row of smaller stories. Company, press, investor and foundation routes identify the page’s corporate role. Google Cloud’s BigQuery case describes conversational access to enterprise datasets for business teams. It supports an internal analytics association, not a claim about the publishing stack of this newsroom or the systems behind Best Buy’s separate retail checkout. The design lesson is the hierarchy of one lead story and a clearly subordinate news grid.
What you can learn
A corporate newsroom can use familiar retail branding while giving stories a different structure from products. Keep the technical association tied to enterprise data access, and evaluate the editorial interface on its own merits.
Pros
The split feature protects headline readability while retaining a recognizable product image.
Secondary story cards provide alternatives without competing at the same visual scale.
Cons & considerations
A seasonal lead story may postpone durable company information for some visitors.
The pictured newsroom cannot demonstrate the conversational analytics workflow described by Google Cloud.
Platform source: Primary documented BigQuery association. Google Cloud documents Best Buy’s BigQuery conversational analytics. Platform evidence is separate from the direct website screenshot and is not a complete current infrastructure audit.
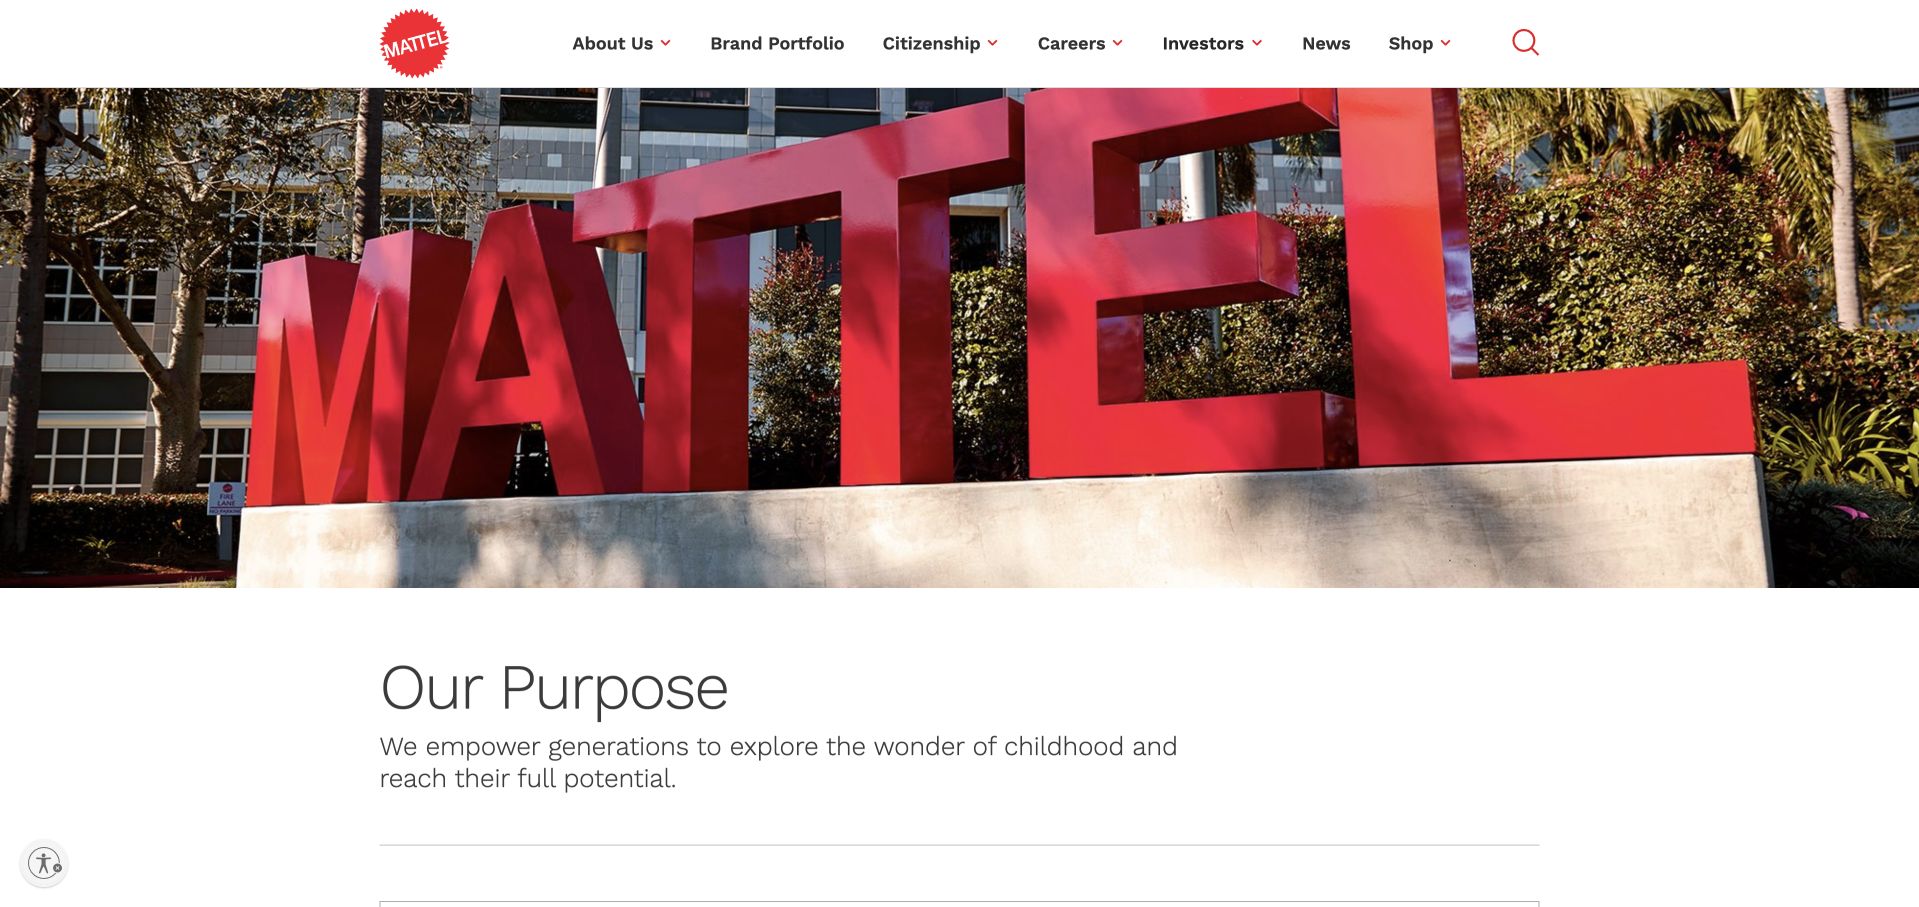
Mattel’s corporate homepage opens with a large photograph of its red physical wordmark, followed by a restrained purpose statement. Navigation separates the brand portfolio, citizenship, careers, investors and news. The page is a corporate destination rather than an individual toy storefront. Google’s BigQuery product page includes Mattel testimony about customer-feedback analysis using data and AI. That is a narrow documented business use, not proof that the pictured corporate page is built with BigQuery or that every Mattel brand shares one current technical stack. The design is useful for its confident introduction of a parent identity before presenting the wider portfolio.
What you can learn
A parent-brand homepage should establish its role before offering brand or audience routes. Keep a vendor testimonial scoped to the work it describes rather than stretching it into a claim about every public website owned by the organization.
Pros
The physical wordmark image gives the parent brand an immediate, recognizable presence.
Portfolio and corporate-audience routes remain clearly separated in the restrained header.
Cons & considerations
A large brand image provides little immediate detail about the portfolio’s individual products.
A short customer-feedback testimonial cannot establish a complete current architecture or corporate-page runtime.
Platform source: Primary documented BigQuery association. Google’s BigQuery page documents Mattel customer-feedback analytics. Platform evidence is separate from the direct website screenshot and is not a complete current infrastructure audit.
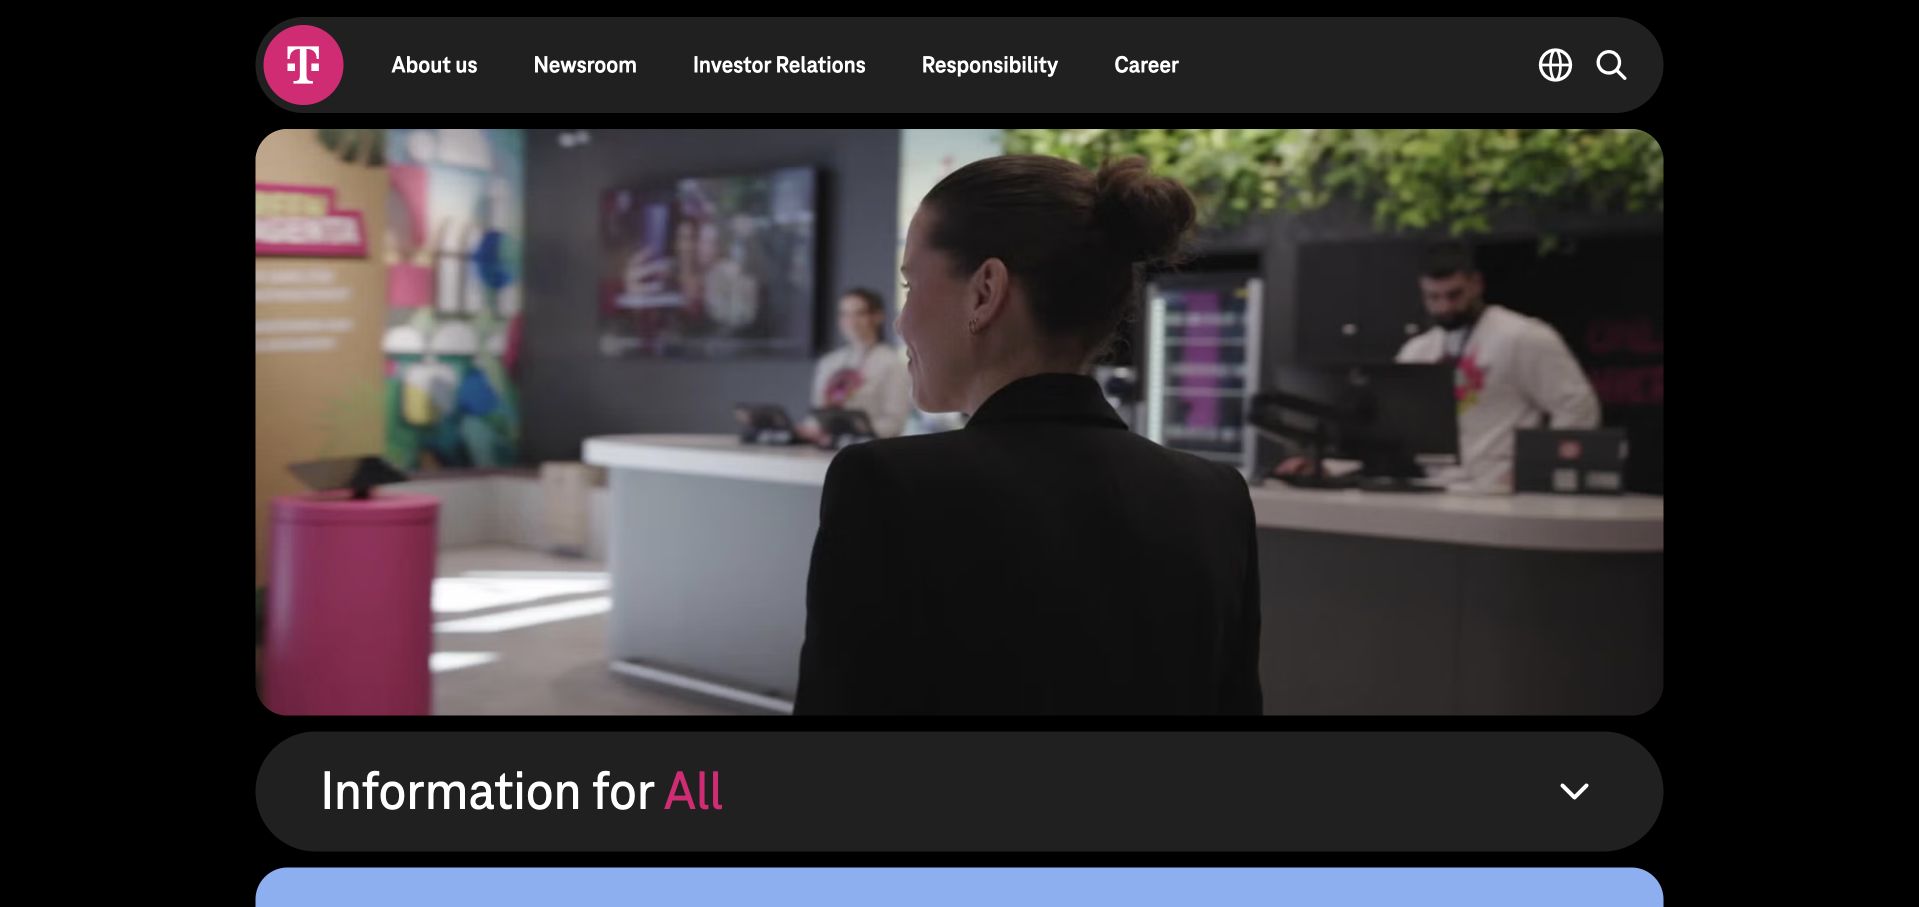
Deutsche Telekom’s selected corporate page uses a black background, rounded content panels and its recognizable magenta identity. A human retail scene appears beneath a compact navigation bar, followed by an expandable information section. This is the corporate site, not a reproduction of a local consumer shop. A November 2024 Google Cloud article describes a hub-and-spoke data architecture using BigQuery with related storage and governance services. That dated account supports the described data-platform association, not a fresh audit of this public page or every group company’s systems. The useful design detail is the controlled grouping of broad corporate content into distinct panels.
What you can learn
Use a recognizable parent identity to organize several audiences without pretending the corporate site is the whole service. Preserve the date and workload scope of an architecture article when presenting it as supporting evidence.
Pros
Rounded panels provide clear grouping within the otherwise dark corporate layout.
The magenta mark preserves recognition without requiring the whole page to use a bright background.
Cons & considerations
Dark layouts and small utility labels need careful contrast and focus-state testing.
A 2024 lakehouse account is not proof of every current system or the corporate frontend.
Visible tech stack
Earlier / documented evidence
BigQuery
Platform source: Primary documented BigQuery association. Google Cloud documents Deutsche Telekom’s BigQuery data platform. Platform evidence is separate from the direct website screenshot and is not a complete current infrastructure audit.
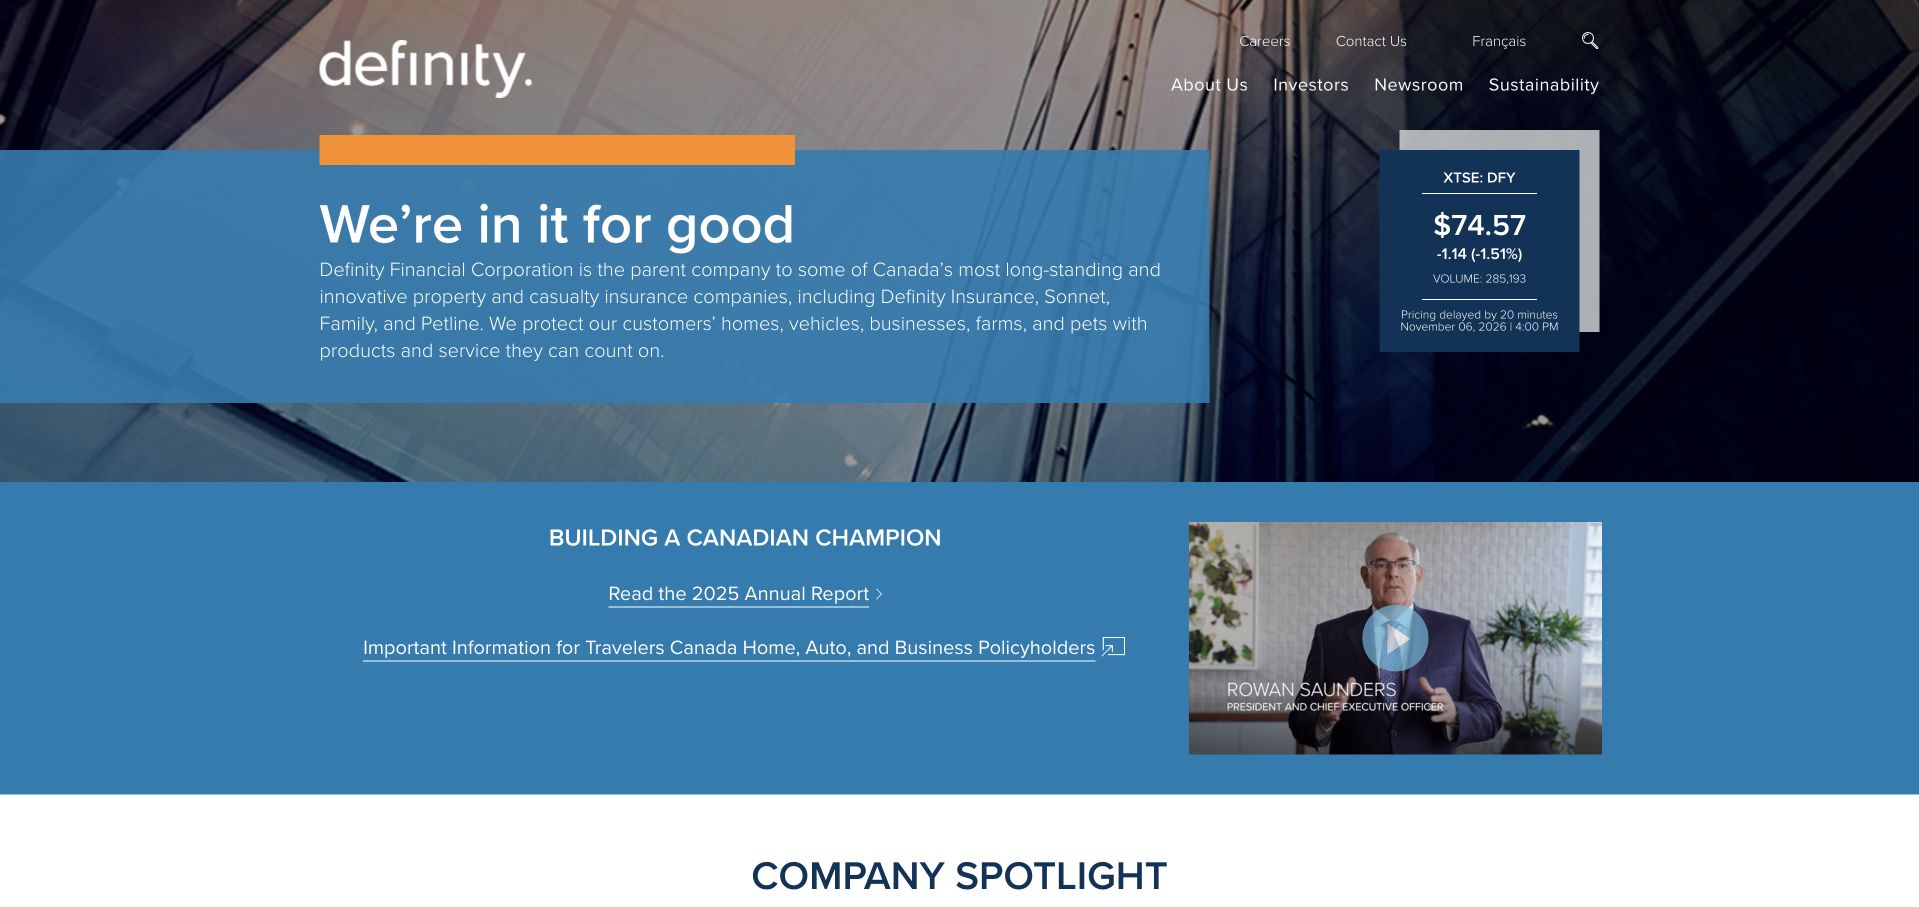
Definity’s selected corporate homepage uses blue information panels over an architectural image, with company and investor navigation above. A market-information card and annual-report content make the intended corporate audience apparent. It is not an individual insurance quote flow. A March 2025 Google Cloud article describes Definity’s Strategic Data Platform using BigQuery and related services within a modernization program. That supports the dated analytics association but does not identify the publishing system of this public page or establish every current underwriting and customer system. The design is useful for placing a concise company explanation beside clearly separated investor context.
What you can learn
Give corporate and investor information their own readable hierarchy. A technical migration story should retain its date, organizational scope and named workload, especially when the pictured page serves a different audience from the operational platform.
Pros
The main text panel gives the company introduction a stable contrast background.
Investor and report content make the corporate purpose clearer than a generic consumer-service hero would.
Cons & considerations
Several blue panels can become visually similar unless their labels and hierarchy remain strong.
The modernization case does not establish the backend of the pictured corporate information page.
Platform source: Primary documented BigQuery association. Google Cloud documents Definity’s BigQuery data modernization. Platform evidence is separate from the direct website screenshot and is not a complete current infrastructure audit.
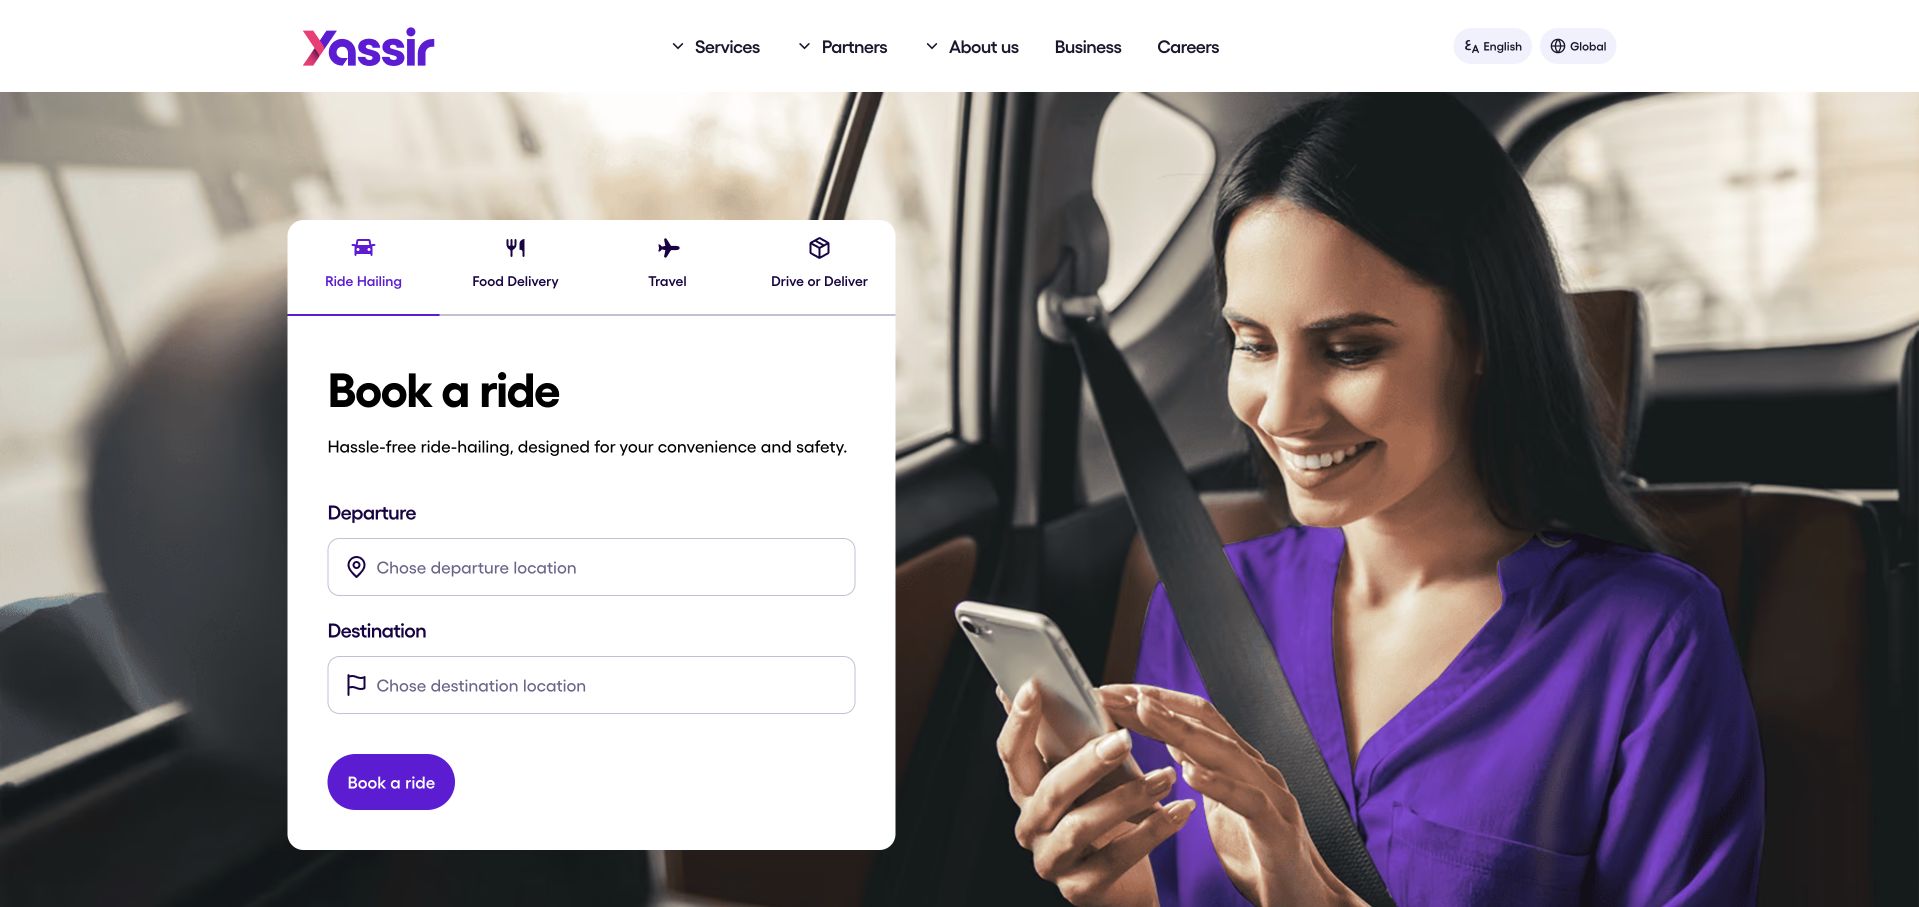
Yassir’s selected homepage places a compact multi-service panel over a person-led travel image. Ride, delivery, travel and partner-related choices appear as visible tabs, with departure and destination fields in the current ride view. Purple accents connect the controls to the brand. A February 2025 Google Cloud article describes Yassir’s consolidation of analytical processing around BigQuery and related AI services. That is evidence about a data-platform migration, not proof of the technology running the pictured booking interface or every app function. The useful design lesson is the clear task focus within a business offering several different services.
What you can learn
Let a multi-service brand expose a few recognizable intentions, then give the selected task a complete interface. Keep migration evidence separate from public interaction behavior and avoid treating visual similarity as architecture verification.
Pros
The selected ride panel gives the broad service brand a concrete first interaction.
Tabs distinguish several intentions without showing every form at the same time.
Cons & considerations
Tabbed forms need clear selected states and careful keyboard behavior across responsive layouts.
A data-platform consolidation case does not describe the runtime of the public ride-request panel.
Platform source: Primary documented BigQuery association. Google Cloud documents Yassir’s BigQuery migration. Platform evidence is separate from the direct website screenshot and is not a complete current infrastructure audit.
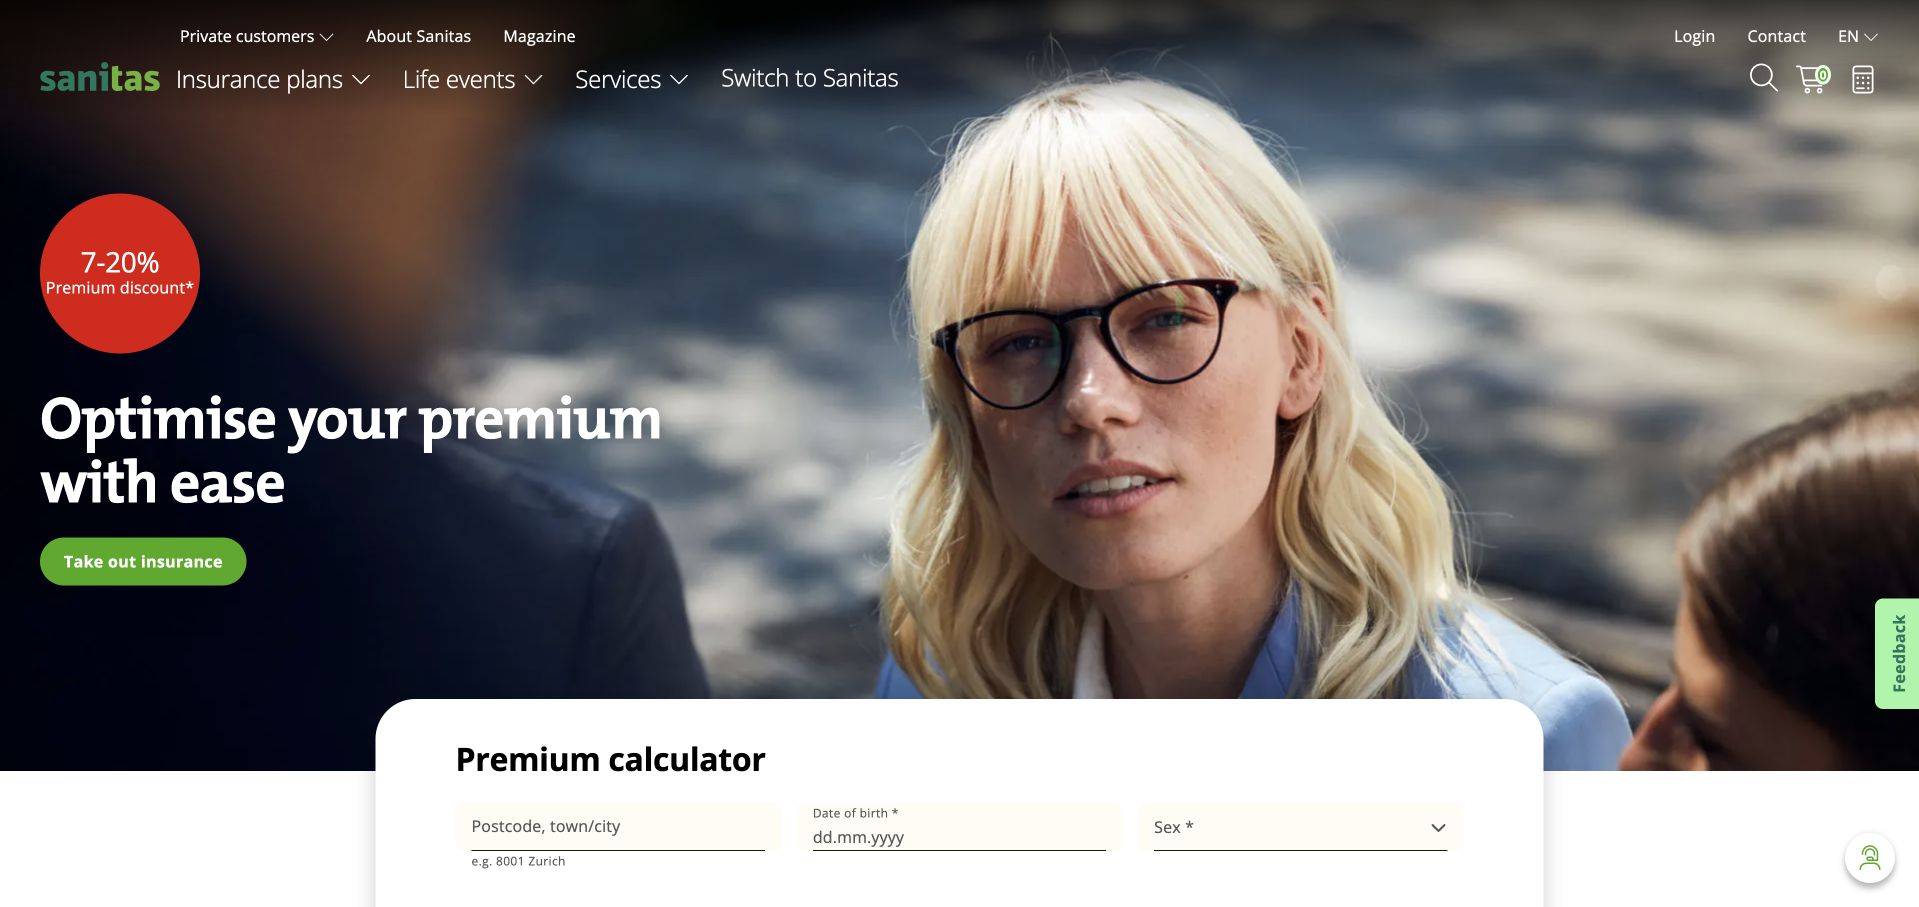
Sanitas uses a large portrait, a dark photographic opening and a green insurance action. A premium-calculation panel begins immediately below, giving the visitor a more specific task than the broad introductory heading alone. Navigation separates insurance plans, life events, services and switching information. Google Cloud’s Sanitas case describes a BigQuery-based lakehouse and related analytics work. That association concerns the insurer’s data environment, not the implementation of the pictured calculator or proof that every public insurance page shares the same backend. The design is useful for the progression from an approachable human image to a clearly labeled consumer interaction.
What you can learn
Connect a service introduction to a specific next task without implying a personalized result before the required process occurs. Describe the data-platform case at its documented scope rather than inferring technical details from the calculator’s appearance.
Pros
The calculator entry appears close to the introduction rather than behind a generic contact route.
Life-event and service navigation provide alternatives to immediately beginning a calculation.
Cons & considerations
A bright discount marker can compete with the explanation and important qualifications.
Lakehouse evidence does not establish the public calculation engine or an individual’s insurance suitability.
Platform source: Primary documented BigQuery association. Google Cloud documents Sanitas’ BigQuery lakehouse. Platform evidence is separate from the direct website screenshot and is not a complete current infrastructure audit.
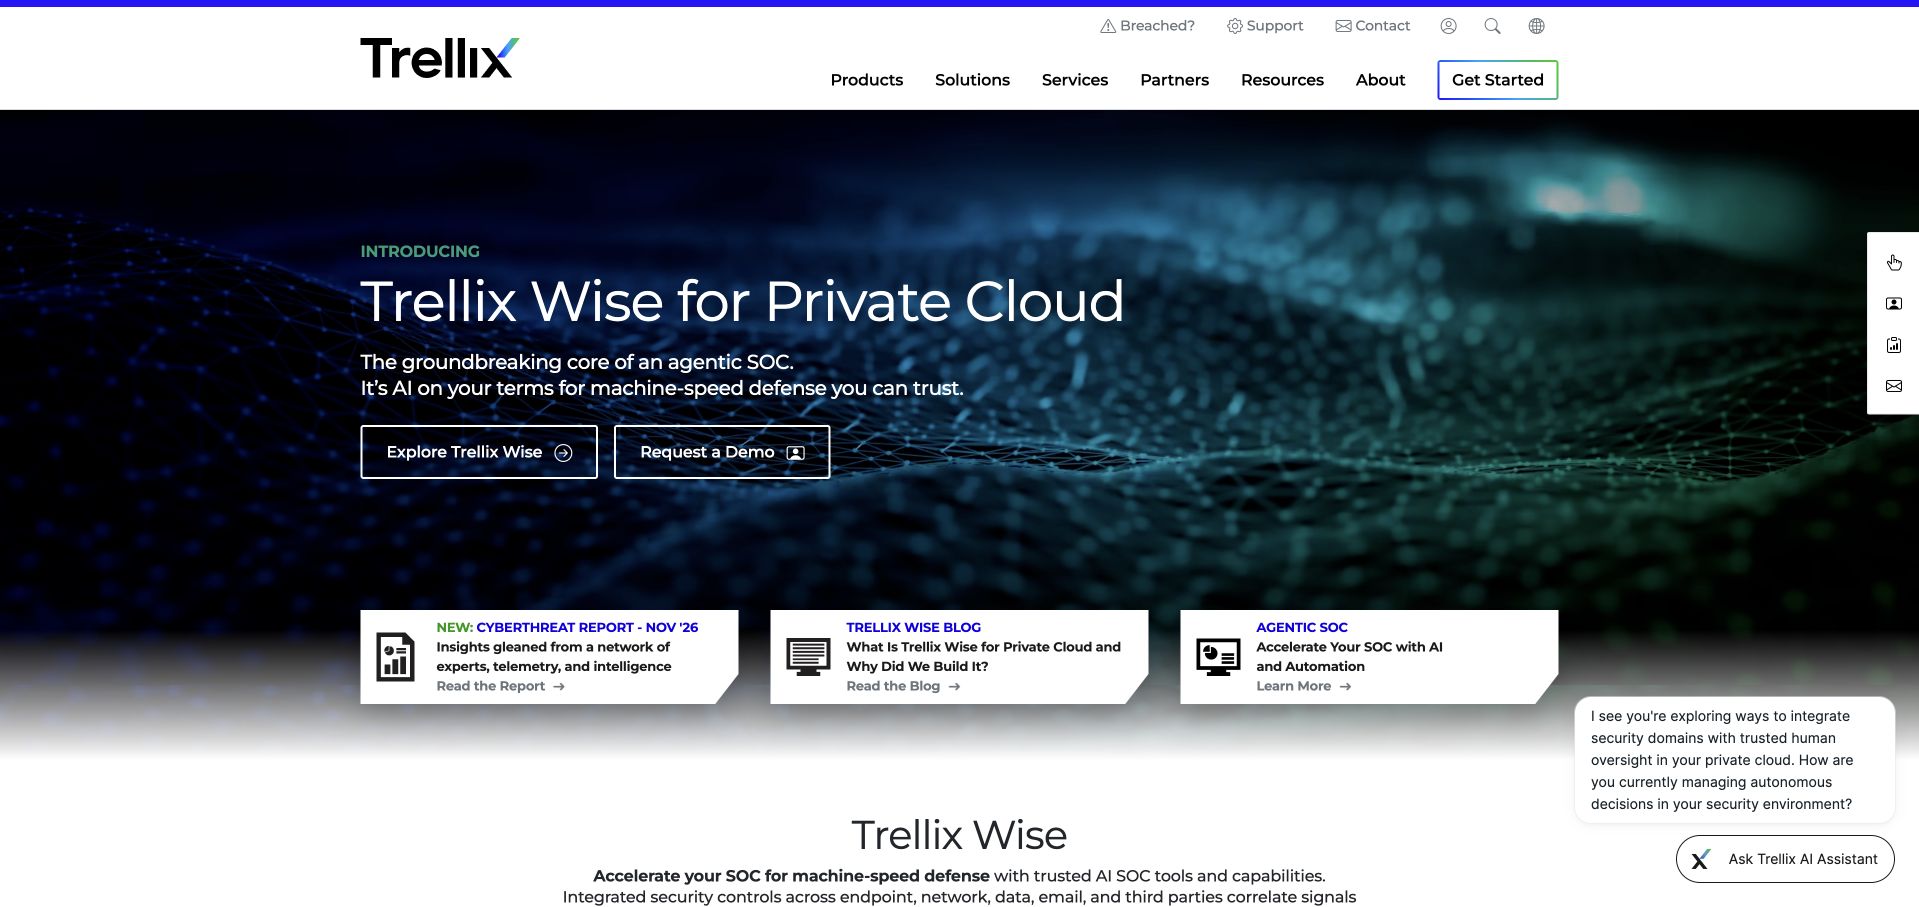
Trellix’s selected homepage features a dark product introduction with two clear actions, followed by a compact row of supporting content cards. A white header separates products, solutions, services, partners and resources. The visual is a product-marketing surface, not a customer-data console. Google Cloud’s Trellix case describes BigQuery combining information from business systems to support a customer view and quote-to-cash context. It does not establish the technology serving this homepage or prove that the company’s security products use BigQuery for every workload. The useful interface pattern is a bounded launch feature connected to stable product and resource navigation.
What you can learn
Keep launch content specific while preserving permanent routes to the wider offer. When an infrastructure case concerns business operations, do not silently relabel it as evidence of the product’s runtime or the public marketing page’s architecture.
Pros
The white header remains legible and distinct from the darker product feature.
Supporting cards introduce additional resources without replacing the main launch action.
Cons & considerations
Several floating assistance and resource controls can crowd the edges of the page.
A business-system customer-data case does not identify the public frontend or every security-product workload.
Visible tech stack
Earlier / documented evidence
BigQuery
Platform source: Primary documented BigQuery association. Google Cloud documents Trellix’s BigQuery customer-data lake. Platform evidence is separate from the direct website screenshot and is not a complete current infrastructure audit.
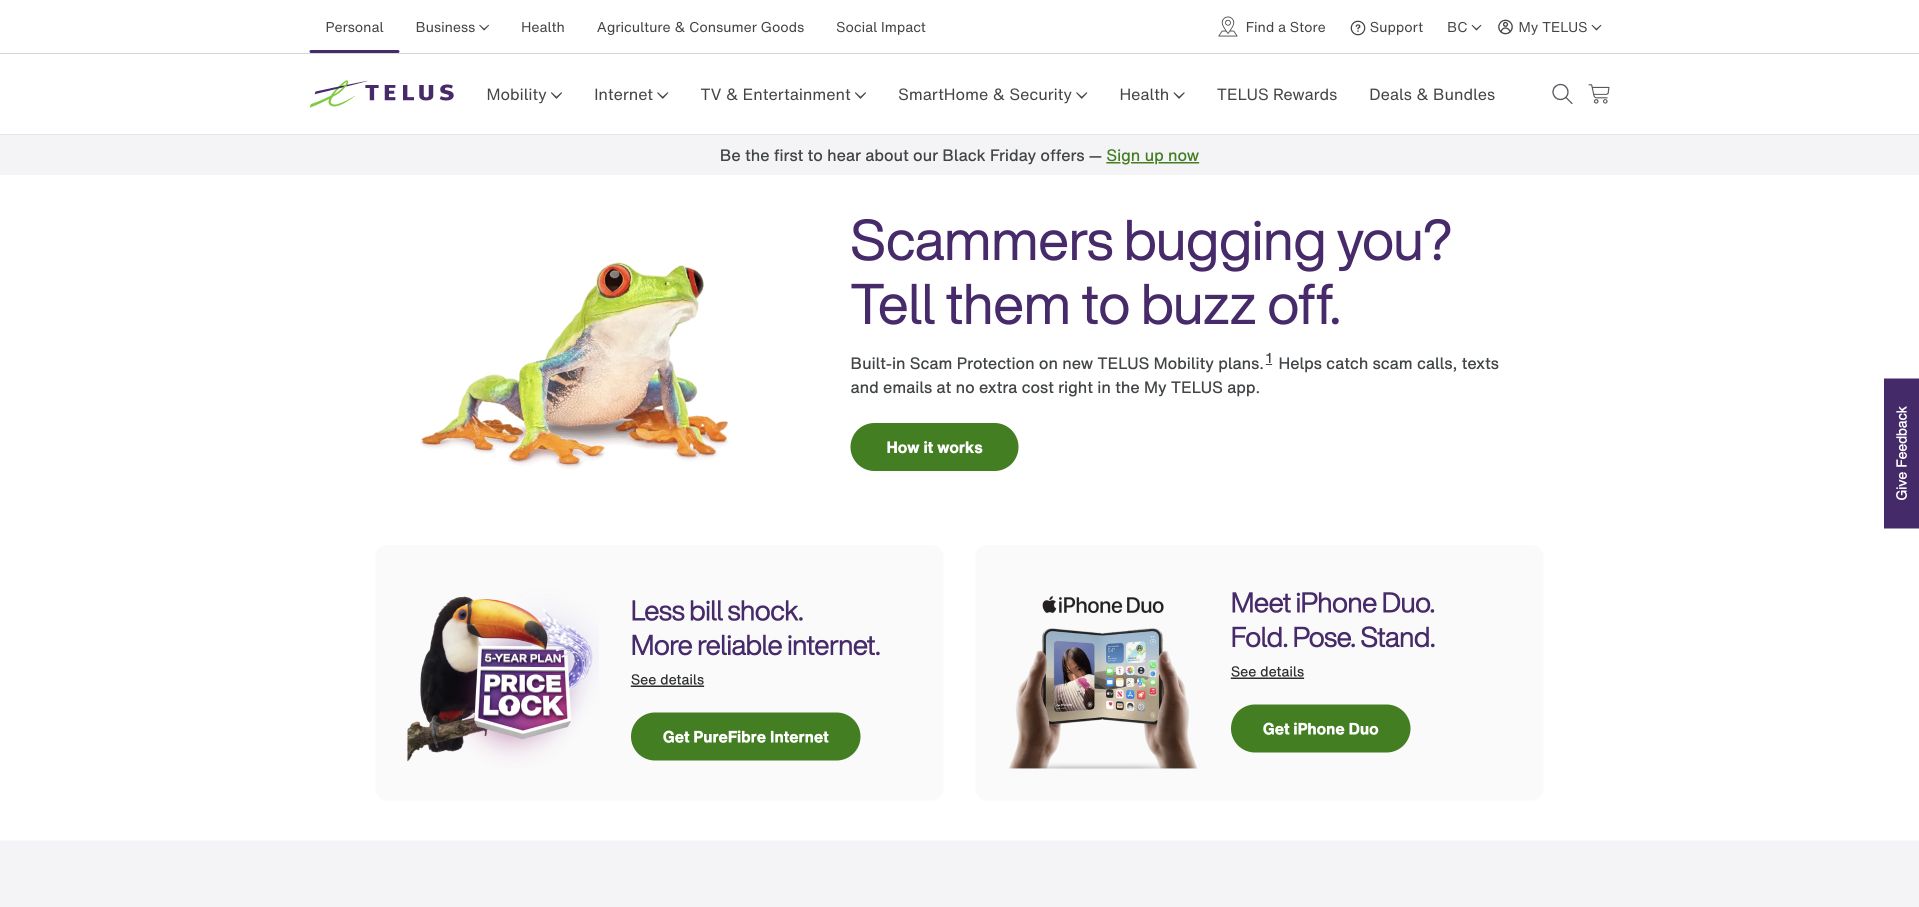
TELUS uses a mostly white opening, a playful frog illustration and a short consumer-security message. Green actions and a row of product cards keep the next steps concrete. The header separates personal, business and other group activities before the more detailed service navigation. Google Cloud’s TELUS case describes BigQuery as part of a unified enterprise data ecosystem supporting analytics and AI-related work. That is an organizational association, not a runtime audit of this consumer homepage, its product cards or the full group. The design is useful for how it combines a recognizable brand character with ordinary, clearly differentiated service destinations.
What you can learn
A character can add recognition while practical cards handle routing. Keep enterprise data evidence tied to the documented platform, and do not infer the implementation of consumer offers from the fact that the same company uses an analytics warehouse.
Pros
The restrained white layout gives the illustration and main action clear visual roles.
The product-card row introduces concrete alternatives beneath the featured consumer message.
Cons & considerations
Multiple audience and service navigation layers can become dense on smaller screens.
Enterprise data-platform evidence cannot establish the implementation of individual product or offer interactions.
Visible tech stack
Earlier / documented evidence
BigQuery
Platform source: Primary documented BigQuery association. Google Cloud documents TELUS’ BigQuery enterprise data platform. Platform evidence is separate from the direct website screenshot and is not a complete current infrastructure audit.
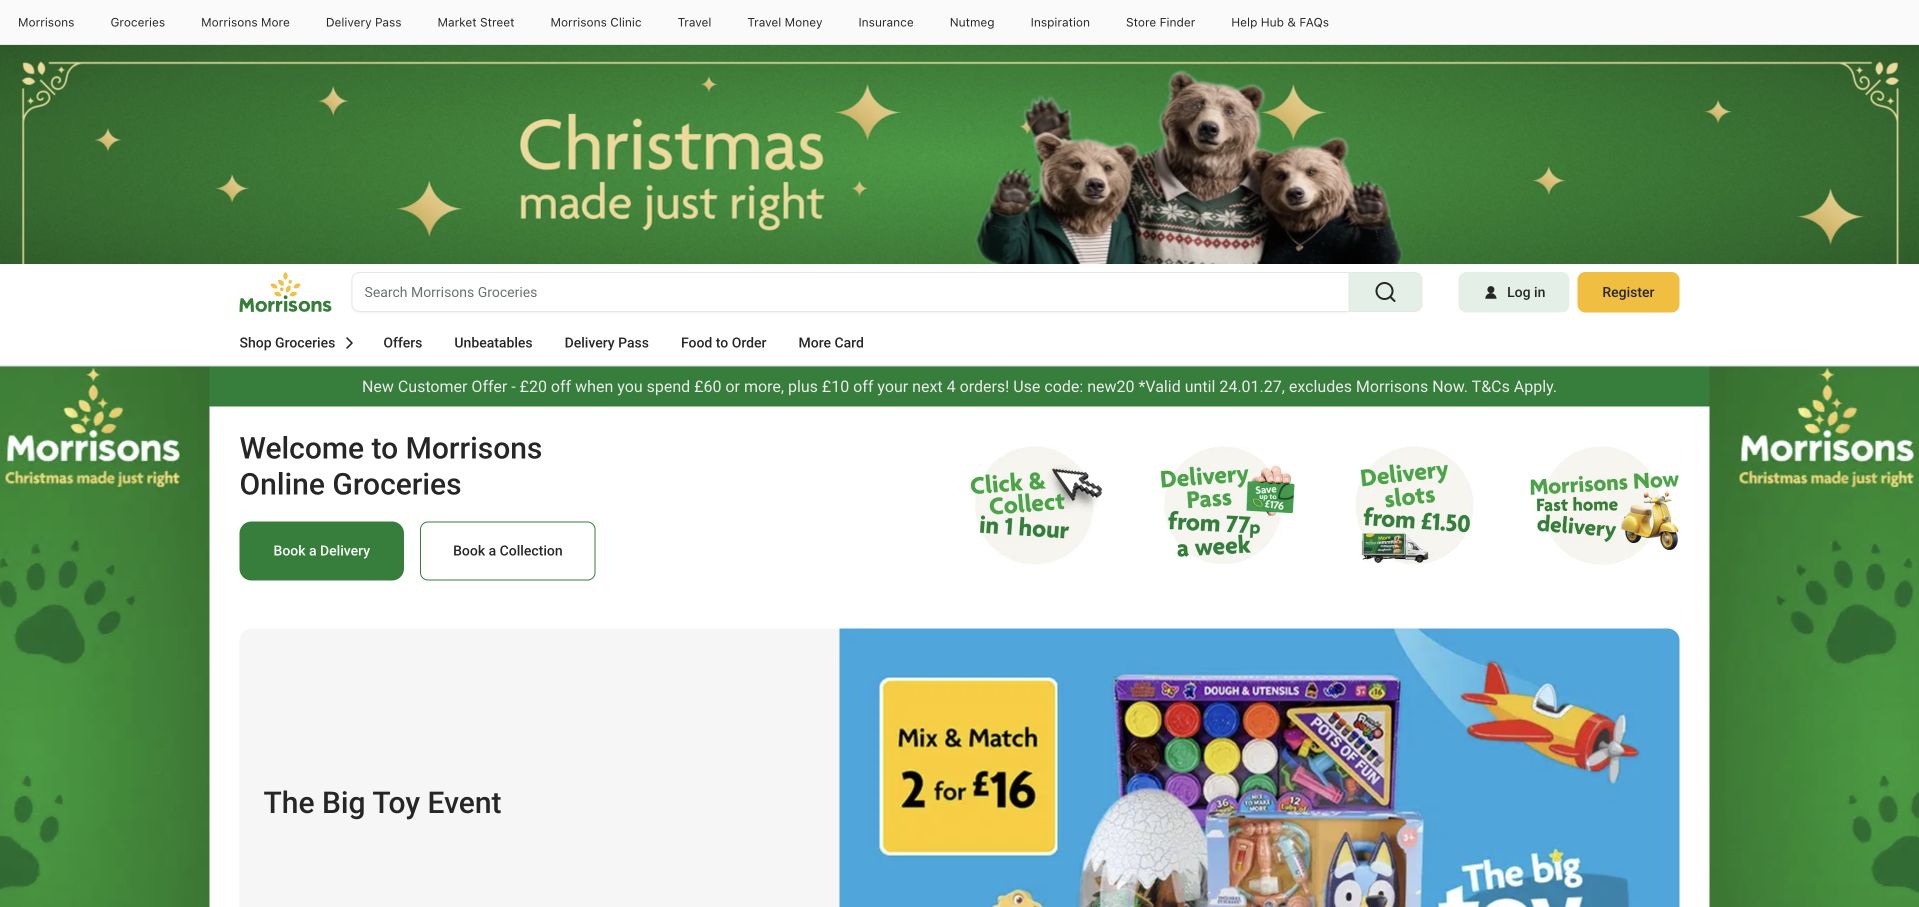
Morrisons' selected homepage uses a green seasonal frame around a central grocery-shopping surface. Search, login, registration and delivery-related choices remain visible above the product promotion. The opening makes the distinction between browsing offers and choosing a shopping route important, because several messages share the same screen. Google Cloud’s Morrisons case describes BigQuery and Looker for operational reporting and data access. That supports the stated analytics association, not a claim about the storefront’s rendering stack, checkout or every current retail system. The useful design question is how to maintain task clarity when a retailer has a substantial promotional calendar.
What you can learn
Keep grocery search and delivery choices stable as campaigns change around them. Treat analytical reporting evidence as a separate workload and evaluate the public shopping interface through its labels, hierarchy and task flow rather than an inferred backend.
Pros
Search and shopping-route controls remain visible within a strongly seasonal visual treatment.
The contained central surface separates practical grocery tasks from surrounding promotional decoration.
Cons & considerations
Numerous offers and seasonal elements compete with the basic decision of how to shop.
A reporting-platform case does not identify checkout implementation or the current storefront frontend.
Platform source: Primary documented BigQuery association. Google Cloud documents Morrisons’ BigQuery reporting. Platform evidence is separate from the direct website screenshot and is not a complete current infrastructure audit.
Gina Tricot’s selected store uses a wide fashion film below a restrained white shopping header. Category labels, search, account and bag controls remain conventional, while a thin promotional strip introduces current offers. The image carries the editorial atmosphere rather than a large explanatory paragraph. Google Cloud’s customer case describes BigQuery and Looker supporting a centralized enterprise data platform that draws together several business sources. It does not prove the runtime of this storefront or make every product and merchandising decision a BigQuery feature. The useful design lesson is the contrast between expressive campaign imagery and familiar shopping navigation.
What you can learn
Let campaign media express the brand while keeping shopping controls predictable. Keep a warehouse case scoped to business analytics and avoid treating it as evidence that a visible film, recommendation or promotion is implemented by that technology.
Pros
The conventional header keeps search and shopping categories recognizable beside expressive imagery.
Promotional information is given a separate strip rather than placed across every image element.
Cons & considerations
A large fashion film needs accessible controls and a useful static alternative.
Enterprise analytics evidence does not establish the storefront runtime or individual merchandising logic.
Platform source: Primary documented BigQuery association. Google Cloud documents Gina Tricot’s BigQuery data warehouse. Platform evidence is separate from the direct website screenshot and is not a complete current infrastructure audit.
Q Burger’s selected homepage uses a rounded food-campaign image, a yellow field and a compact white navigation bar. The prominent dish photograph and large campaign typography make the current promotion the opening focus. The page is a consumer restaurant brand surface, not a business-intelligence interface. Google Cloud’s Q Burger case describes a centralized BigQuery warehouse bringing together restaurant business data, including operational sources, with reporting downstream. That supports a business-analytics association; it does not identify the public homepage’s CMS or prove that every restaurant interaction uses BigQuery. The design is useful for its direct, recognizable product presentation.
What you can learn
A restaurant campaign can lead visually while stable navigation handles practical tasks. Keep the warehouse relationship attached to the documented operational data flow rather than implying that a promotional image or menu interface demonstrates the technical architecture.
Pros
The food image gives the campaign a concrete subject rather than relying on abstract brand graphics.
Rounded panels and a consistent yellow field produce a recognizable visual system.
Cons & considerations
Large campaign lettering needs equivalent readable content beyond text embedded in imagery.
A restaurant-data warehouse case does not establish the homepage publishing system or menu implementation.
Platform source: Primary documented BigQuery association. Google Cloud documents Q Burger’s BigQuery business analytics. Platform evidence is separate from the direct website screenshot and is not a complete current infrastructure audit.
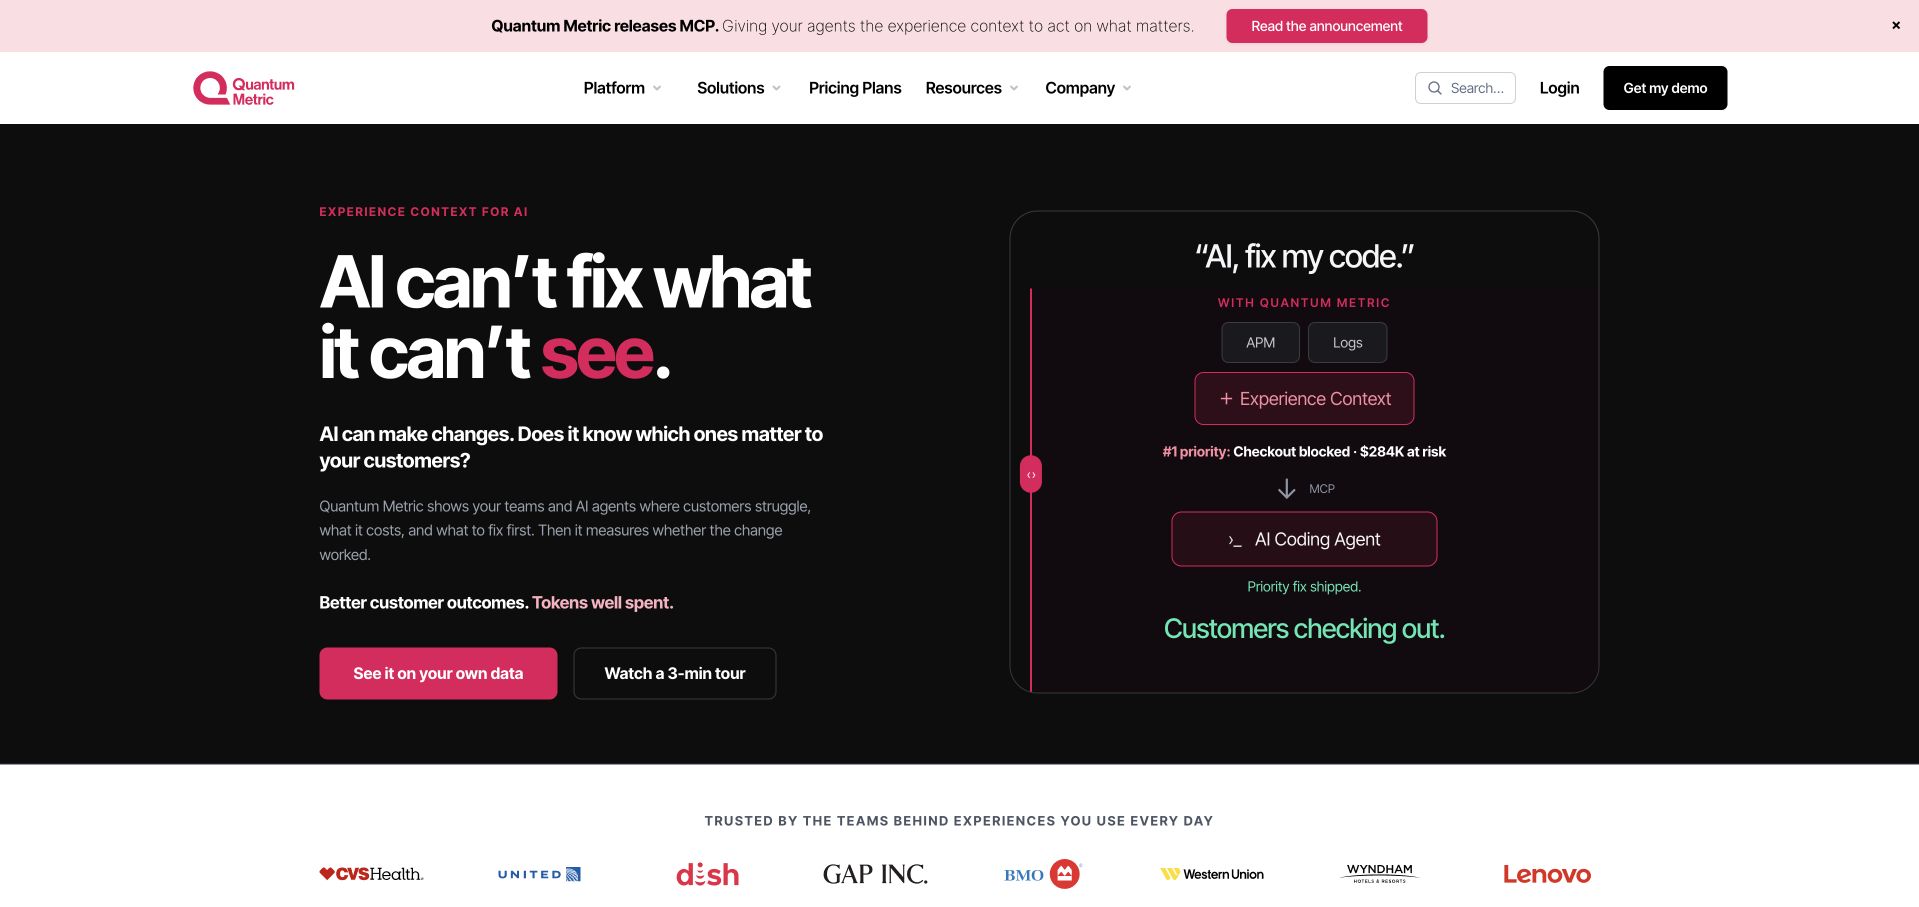
Quantum Metric’s selected homepage uses a black-and-pink opening, a concise AI-context headline and a small interface-style diagram. Two actions distinguish exploring data from watching a short tour, with customer marks below. Google Cloud’s case documents BigQuery analyzing captured digital-interaction data within Quantum Metric’s analytics product, including funnel-related work. That supports the product-data association described in the case, not the current homepage’s rendering stack or every newer AI feature mentioned in its marketing. The useful design pattern is the pairing of a short positioning statement with a concrete explanatory artifact, rather than a large abstract illustration alone.
What you can learn
Tie a product message to an understandable example, but separate current feature marketing from the scope of an older infrastructure case. A documented analytics workload should not silently become proof of every new capability.
Pros
The small diagram gives the short headline a more concrete product context.
Exploration and video-tour actions offer different levels of commitment.
Cons & considerations
Dark interface fragments require readable labels and a sensible narrow-screen arrangement.
The checked BigQuery case does not independently validate every current AI claim or homepage technology.
Platform source: Primary documented BigQuery association. Google Cloud documents Quantum Metric’s BigQuery analytics. Platform evidence is separate from the direct website screenshot and is not a complete current infrastructure audit.
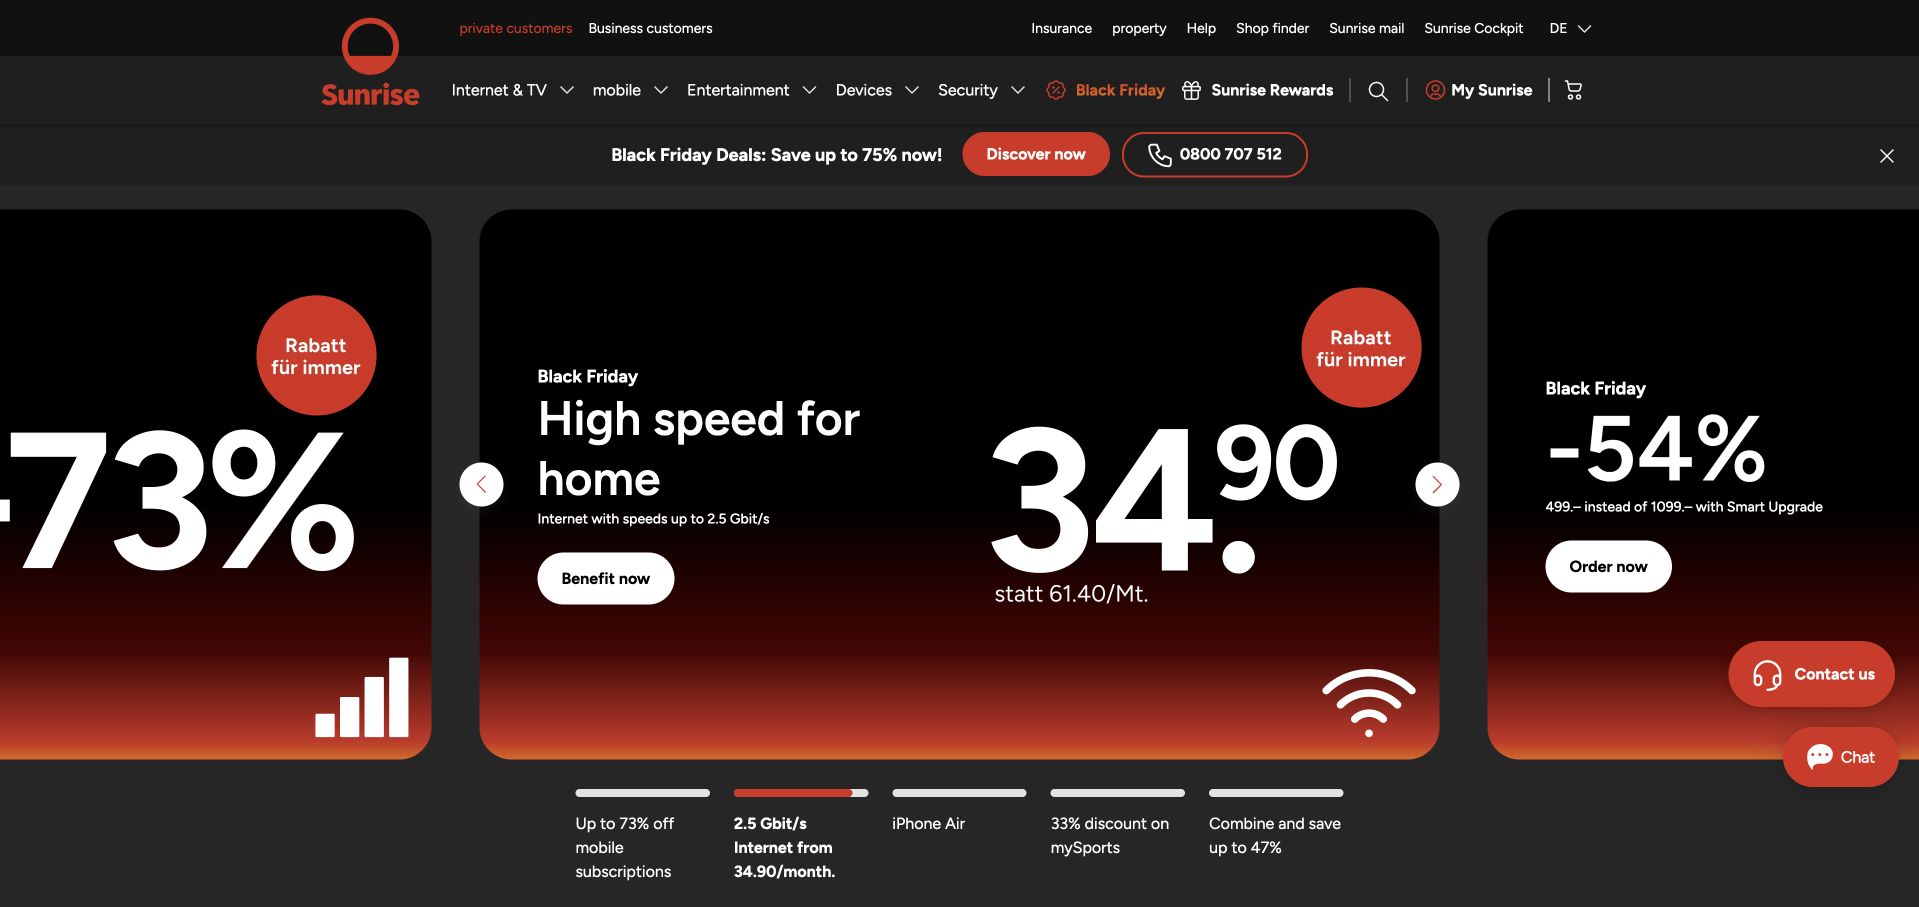
Sunrise’s selected consumer homepage uses black panels, red gradients and oversized offer figures. Internet, mobile and entertainment navigation stays above the carousel, while contact and chat controls sit at the edge. The composition makes current promotions dominant, which is useful for studying a high-frequency retail-service homepage but creates substantial competition for attention. Google Cloud’s Sunrise case describes consolidation of enterprise data on BigQuery, including a foundation for reporting and personalization work. That is a documented organizational platform association, not proof of the public carousel’s runtime or every consumer-offer system. The pictured German-language page is the actual public destination observed.
What you can learn
Make changing offers readable without letting them replace stable service navigation. Preserve the language and regional context of the actual page, and scope technology evidence to the enterprise platform rather than inferring the implementation of each visible promotion.
Pros
Consistent black-and-red offer panels make the promotional system immediately recognizable.
Permanent service categories remain separate from the changing featured offers.
Cons & considerations
Very large prices and discounts can visually overwhelm qualifications and comparison detail.
An enterprise platform case does not establish the frontend or rules behind individual offers.
Platform source: Primary documented BigQuery association. Google Cloud documents Sunrise’s BigQuery enterprise platform. Platform evidence is separate from the direct website screenshot and is not a complete current infrastructure audit.
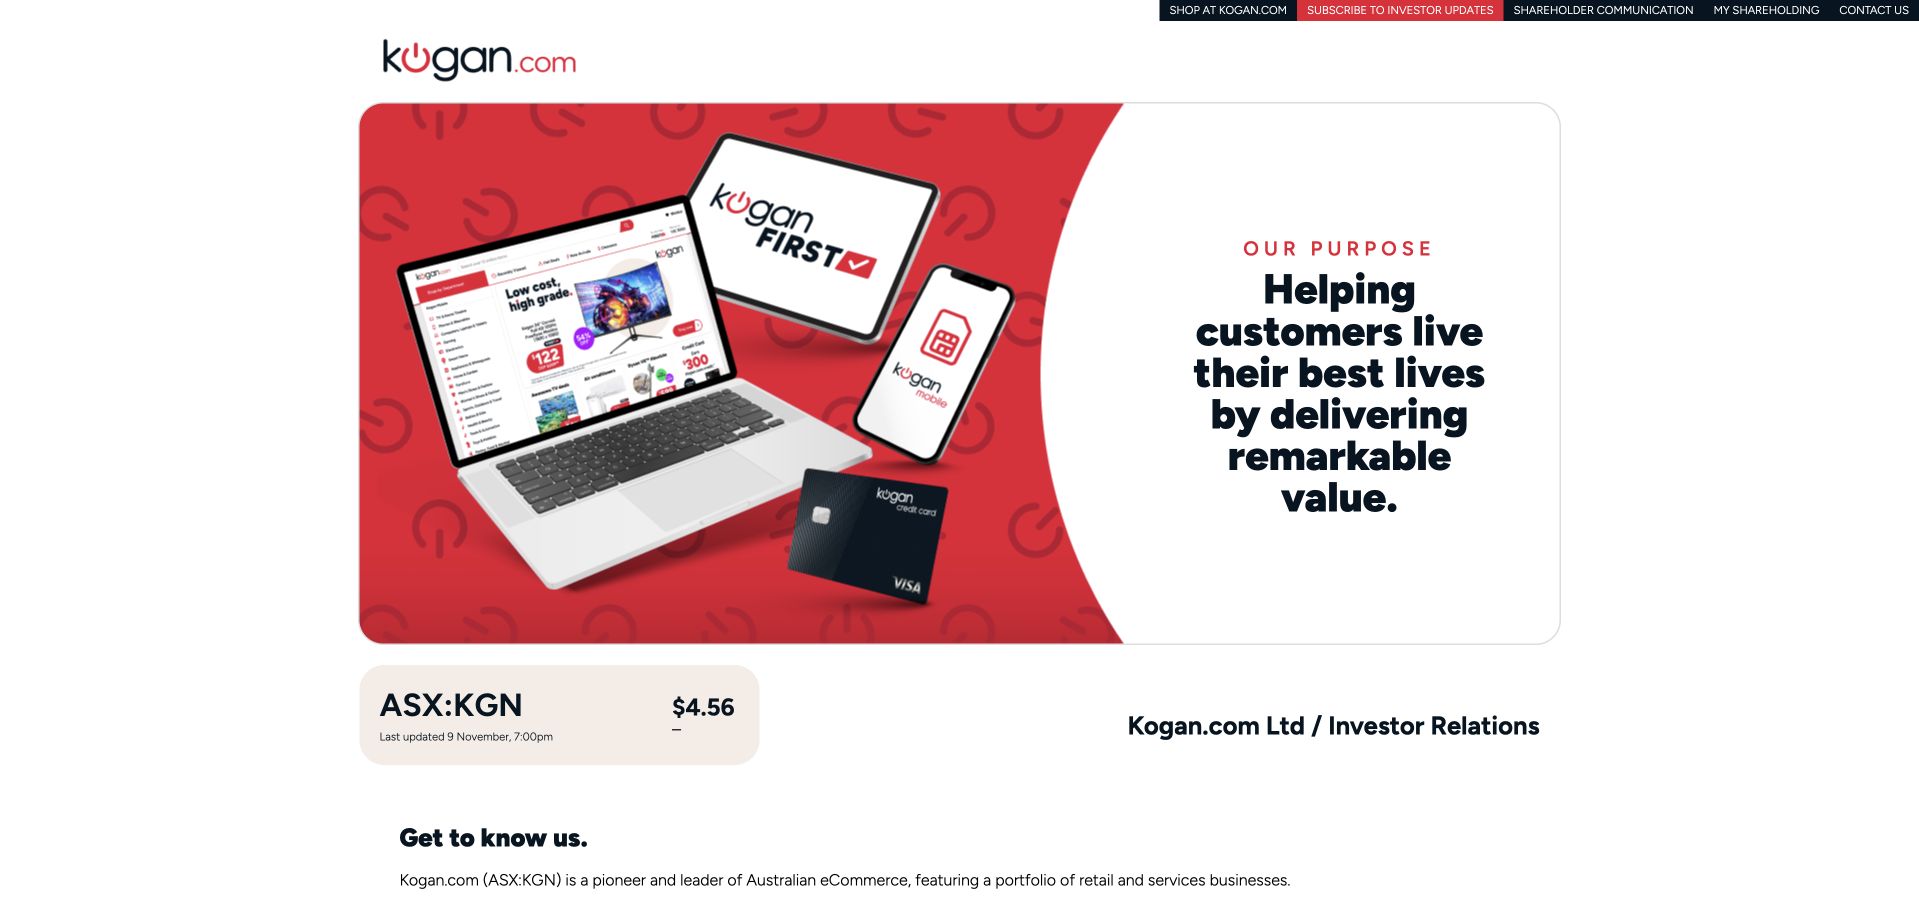
Kogan’s selected page is its corporate and investor-information website rather than the retail storefront. A red-and-white purpose panel shows devices and membership imagery beside a short statement, followed by market information and a company introduction. Utility links identify shopping, shareholder communication and investor contacts as separate destinations. Google Cloud’s Kogan.com case describes BigQuery, modeled data and Looker within internal analytics and self-service access. That supports the wider business workload, not a claim that this corporate page runs on BigQuery or evidence about the retail shopping interface. The design is useful for its explicit corporate-versus-shopping separation.
What you can learn
Review the page actually available and label its role honestly. Corporate imagery can reference a retail business without being its storefront, and an internal analytics case cannot establish the implementation of either public destination.
Pros
The purpose panel gives corporate visitors a concise introduction without pretending to be a product catalog.
Shopping and investor routes are explicitly different utility destinations.
Cons & considerations
A small corporate page provides limited evidence about the retail shopping experience.
The BigQuery and Looker case concerns internal data use, not the corporate site’s runtime.
Platform source: Primary documented BigQuery association. Google Cloud documents Kogan.com’s BigQuery analytics; the pictured corporate information page is a separate public design reference. Platform evidence is separate from the direct website screenshot and is not a complete current infrastructure audit.
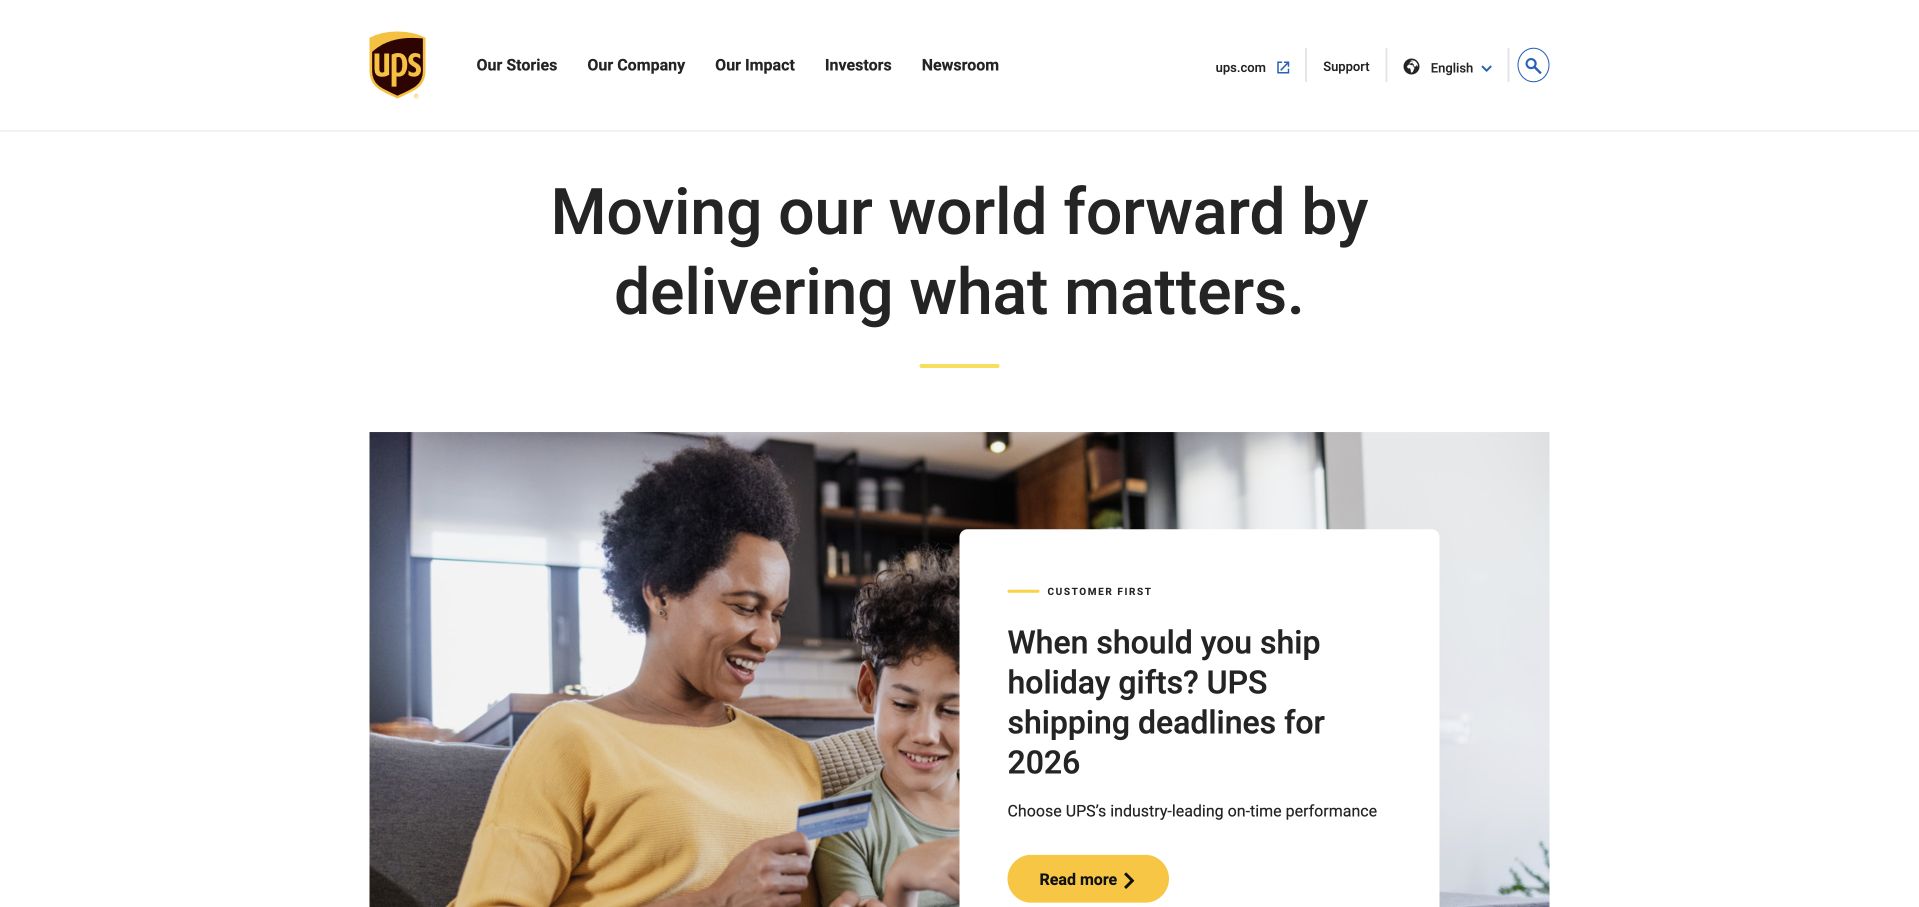
The selected About UPS page uses a white corporate header, a substantial introductory statement and a practical holiday-shipping story below. Company, impact, investor and newsroom routes identify it as a corporate publishing destination rather than the package-tracking application. A May 2024 Google Cloud article describes UPS Capital’s DeliveryDefense workload using BigQuery alongside other data and AI services. The subsidiary and date matter: that evidence does not establish the runtime of this About UPS page, every UPS delivery system or the current architecture of the parent group. The useful design pattern is the transition from a broad corporate identity to a timely, understandable story.
What you can learn
Preserve the organizational boundary of a technical case. A parent-company design reference can be useful, but a subsidiary’s documented workload should remain explicitly attributed rather than expanded into a whole-brand backend claim.
Pros
Corporate navigation clearly distinguishes the page from a tracking or shipment-creation interface.
The practical featured story gives the broad company introduction a concrete subject.
Cons & considerations
A corporate story hub may not satisfy visitors arriving with an immediate parcel-service task.
The dated UPS Capital case does not establish every current parent-company system or public-page runtime.
Visible tech stack
Earlier / documented evidence
BigQuery
Platform source: Primary documented BigQuery association. Google Cloud’s 2024 article documents UPS Capital’s BigQuery workload. Platform evidence is separate from the direct website screenshot and is not a complete current infrastructure audit.
INSIDER’s selected Brazilian clothing store uses a dark campaign image, oversized promotional typography and a restrained shopping header. Category links, search and bag controls remain conventional, while the model-led image carries the seasonal message. The dbt Labs customer case identifies BigQuery within INSIDER’s analytics platform and discusses model-level operational work. That supports the documented warehouse association, not a claim that the pictured store is rendered by BigQuery or that every product recommendation comes from it. The design is useful for studying a strong retail campaign whose interface remains recognizable despite a visually dominant offer.
What you can learn
Keep campaign presentation and analytical infrastructure separate in the explanation. A vendor case can document a warehouse relationship without identifying the storefront’s complete stack, and operational metrics should retain the source’s specific context rather than become universal performance claims.
Pros
Conventional category and utility controls remain recognizable beside the large promotional artwork.
A restrained palette keeps the seasonal image and primary shopping action visually connected.
Cons & considerations
Oversized discount lettering can overwhelm product context and important campaign qualifications.
The dbt case’s BigQuery evidence does not establish the public storefront runtime or every retail-data use.
Platform source: Primary documented BigQuery association. INSIDER’s dbt case describes its BigQuery data platform. Platform evidence is separate from the direct website screenshot and is not a complete current infrastructure audit.
Kegan has 15+ years of experience working with small businesses, Fortune 500 companies, and everything in between. No development job is too big or too small: he brings the same hands-on attention to a focused improvement, a complete website, or a custom application.
For BigQuery projects, he can help with data modeling, application data access, query design, search and cache integrations, migration planning, access boundaries, and maintainable handover. He works directly with clients on scope, design, implementation, testing, and handover, with an emphasis on clear communication and a system that remains practical to maintain after launch.
Show 3 other BigQuery developersHide other BigQuery developers
Begin with one trusted source and one recurring question, such as a daily operational summary. Agree on row meaning, update cadence and reconciliation before expanding. This provides a manageable way to test access, query behavior and ownership without declaring that every spreadsheet and database must move into a new enterprise platform.
A governed cross-system analytical layer
When several teams need consistent definitions across systems, plan shared datasets and explicit consumer boundaries. Separate raw source context from reviewed reporting outputs. Establish who approves a definition and how downstream users learn about changes. The important design choice is the agreement between teams, not simply adding more sources to one location.
For an existing warehouse, migrate a defined set of workloads with a comparison and rollback plan. Inventory scheduled jobs, consumers and historical restatements rather than translating SQL in isolation. Evaluate cost with representative runs and keep business acceptance separate from technical execution. A successful pilot should answer whether this specific migration is useful, not justify unlimited expansion.
Plan the data contract, cost boundary and service handoff
Write a workload brief that distinguishes analysis from operations
Choose one initial analytical output and name the people accountable for it. Describe what a row represents, which source systems contribute to it and how the result will be interpreted. For an order-based report, for example, decide whether the unit is an order, an order line or an event before joining tables. Record how duplicates, cancellations, corrections and source delays should be handled. These are project decisions that a warehouse cannot make on the team’s behalf. A technically valid query can still answer a different business question from the one the consumer intended.
Define the update expectation in useful terms. A daily management report and an interactive operational feature have different needs. Agree how fresh the data must be, how freshness is shown and what the consumer should see when a source is late. Do not turn a desire for a fast dashboard into an unexamined requirement to stream every source. Similarly, do not place an analytical query directly on a critical public interaction without designing the serving boundary, failure behavior and access controls appropriate to that feature. BigQuery’s presence in an organization is not a complete application architecture.
List the consumers before designing the final tables. A finance analyst, a product team and a public-facing API may require different outputs and permissions. Identify which dataset is exploratory and which is approved for recurring use. Write acceptance checks that compare meaningful counts and totals with the source context rather than only checking whether a job completed. Keep the first milestone deliberately narrow: one defined question, known inputs, a named owner and an explanation that a new team member can understand without reading the whole codebase.
Test query shape and cost with representative data
Build a small set of representative queries before deciding the final physical layout. Include the normal date range, a longer historical range, a common business filter and an intentionally broad exploration. Record what each query is meant to return and why it needs the selected columns. A tiny development sample can hide expensive or incorrect joins, so include a realistic acceptance run before exposing the dataset to many consumers. Do not use a successful demonstration query as evidence that every downstream dashboard will behave similarly.
Choose partitioning around the way the workload filters data, then verify the actual query. Google’s documentation explains that qualifying filters on the partitioning column can skip irrelevant partitions; simply creating a partitioned table does not make every query selective. For time-based reporting, define which time the partition represents and how source corrections outside the usual reporting window will be processed. Evaluate clustering as a separate workload choice, not an automatic companion to every table. Keep the reasons for the layout next to the model so later changes do not accidentally defeat the intended query pattern.
For on-demand work, use estimates and an appropriate maximum-bytes-billed setting where suitable. Do not assume a LIMIT clause controls scans on a non-clustered table. Treat budget alerts as notifications rather than a substitute for execution controls. Assign someone to review the chosen controls and investigate changes in recurring workload behavior. Keep current commercial pricing outside evergreen promises: establish an estimate for the actual project, record its assumptions and revisit it when query patterns, data volume or consumers change. A useful cost plan explains the boundary and owner, not just a forecast number.
Design permissions, publication and change ownership together
Create a simple map of who loads data, who transforms it, who runs analytical jobs and who consumes the resulting outputs. Review access at the appropriate resource level. Google’s IAM reference distinguishes the ability to create jobs from access to data; do not assume one broad role is the only way to support both. Identify human and service identities separately, and keep credentials out of public browser code. A public dashboard or website feature needs an intentional application or publishing boundary rather than exposing internal datasets simply because a chart must be visible.
Decide which outputs are approved to leave the analytical environment and who reviews that decision. A useful aggregate can still reveal information when combined with small groups or other data, so do not treat the word dashboard as an automatic publication approval. Define retention, export and deletion responsibilities with the relevant business and security owners. Document the regions and data-handling requirements the project must satisfy instead of inferring them from a customer case about a different organization. The evidence in this collection establishes named workloads, not a compliance template for a new implementation.
Plan changes before launch. Name the owner of each published dataset and the consumers who must be consulted before a field, meaning or schedule changes. Keep a recovery plan for missing loads, duplicate data, corrected history and accidental over-broad queries. Give operators a way to identify the affected output and pause publication when checks fail. Record what a successful reconciliation looks like after recovery. The handoff should include the workload brief, permissions, query examples, review process and the contact responsible for decisions. A data platform becomes maintainable through these agreements, not merely because the first ingestion and dashboard both run.
Ask the actual team to carry out its routine job: publish a realistic update, correct a mistake, preview a narrow screen, and identify who owns an integration failure. For a library or frontend framework, also ask who maintains the content source and deployment. A polished screenshot does not answer those operational questions.
Beyond the screenshot
BigQuery project brief checklist
Name the analytical question, output owner and first consumer before expanding the data inventory.
Define row grain, keys, duplicates, corrections and reconciliation expectations for each published dataset.
Separate analytical reporting requirements from the website’s transactional read and write responsibilities.
Agree on freshness expectations and the visible behavior when a source or transformation is late.
Compare normal, historical and broad queries with representative data before wider rollout.
Choose partition and clustering strategies from actual filter patterns, then verify their effects.
Document the selected compute model and appropriate query-execution controls without fixed-price promises.
Distinguish spending notifications from controls that can prevent an unsuitable query from running.
Map loading, transformation, job execution and consumption to specific identities and resources.
Define approved publication, export and retention boundaries with the responsible reviewers.
Document backfill, duplicate-load, correction and recovery procedures before production acceptance.
Assign change owners and notify downstream consumers when dataset meanings or schedules change.
Test with real content, a keyboard, a small screen, slow or failed requests, and the people who will maintain the system. These are planning checks, not an accessibility, security, performance, or search-ranking certification.
Sources & editorial method
How this BigQuery collection was reviewed
Exactly 20 public website design references are paired with checked primary workload evidence. The opening five are Spotify, Etsy, The Home Depot, AT&T and Best Buy. Google Cloud cases and official documentation were checked for their stated scope; a vendor case is not a fresh public-page runtime audit, independent performance benchmark or complete current architecture. Original planning recommendations concern project choices, not guaranteed savings or a prescribed enterprise design.
Every image is an unmodified capture from the actual website, with its source and capture date. Some captures are reused from our shared catalog; their dates remain the original capture dates. None comes from a vendor gallery or a generated reconstruction. Moving imagery and live content can change.
Technology attribution uses public page assets or metadata, official platform documentation, or a cited first-party project case study. Documentary and framework-relationship evidence is identified where used; it is not a complete current backend inventory. A CMS image CDN alone does not establish a full CMS deployment. A library’s presence does not prove which individual controls use it, and a platform label does not establish AI authorship.
The composition notes, lessons, pros and tradeoffs are original editorial observations. We have not measured conversion, traffic, security, performance or accessibility conformance. Website owners retain their brands and imagery; these examples are not our client portfolio. Written, Edited and Curated are independent records, not dates advanced by a build. See our editorial standards or suggest a correction.
Questions worth asking
BigQuery website development FAQs
Does a company using BigQuery mean its website is built with it?
No. A primary case can establish a particular analytical workload without identifying the public page’s runtime. The 20 screenshots are public design references. Their paired sources describe data work at the organization, and some concern a subsidiary or a dated migration rather than a complete current stack.
Should BigQuery replace the database behind a checkout or user account?
Do not make that substitution simply because an analytical project uses BigQuery. Define the transactional requirements separately and design an appropriate serving system. A warehouse can receive relevant data for analysis without becoming the operational database for every public website interaction.
Will partitioning automatically make every query cheaper?
No. It needs to match the data and query pattern, and the query must allow useful partition elimination. Test representative filters and the handling of historical corrections. A partitioned table name is not evidence that a dashboard’s actual queries use the intended boundary.
Can we use a row limit as the cost-control strategy?
Not for a general plan. Google’s guidance specifically warns that LIMIT does not reduce compute costs on non-clustered tables. Use the controls appropriate to the selected compute model and workload, and distinguish an estimate or budget notification from an execution restriction.
What should be included in the handoff after the first dashboard works?
Include the data definitions, source and consumer map, permissions, representative queries, cost assumptions, checks and recovery instructions. Name the owner who approves changes. The ability to render a chart is only one acceptance condition; maintainers also need to know what the numbers mean and what to do when they are wrong.
Start with one defined analytical question and an accountable owner. A useful dataset, controlled access and a recoverable workflow matter more than imitating the scale of a famous adopter.