Best Data Analytics Company Websites of 2026 (12 Real-World Examples)
How to make an analytical product understandable, show a useful investigation and support the people who evaluate, implement and use it.
A data analytics company website should connect an understandable question with the work its product actually supports. Attractive charts can introduce the category, but a useful site also explains data inputs, reporting boundaries, evaluation options and where a visitor can investigate the details.
Analytics is a broad label. Website-traffic reporting, product behaviour, business intelligence, search and operational observability answer different questions. A homepage should help someone recognise the relevant category before comparing feature names. State the intended audience and the task in ordinary language, then connect the proposition to a concrete example. Do not assume that every visitor understands the difference between a session, an event, a replay and an infrastructure metric.
The public website is only part of the experience. Developers need implementation material, business evaluators need scope and commercial information, and existing customers need practical support. This collection deliberately includes precisely identified documentation and help-centre views alongside marketing pages. Their purpose is to show how a company supports investigation and learning, not pretend that every screenshot depicts a homepage or an equivalent kind of product.
Use the examples as design references rather than a product recommendation or an independent privacy, legal or performance assessment. Demonstration dashboards do not establish the quality of a supplier’s data or the results a customer will obtain. Reused direct captures keep their original dates and pixels; a current first-party topic check does not turn them into new screenshots. The reviews focus on visible communication and conditional tradeoffs.
Before the examples
What makes good data analytics company website design in 2026?
Start with the question the product helps answer
Explain whether the visitor is investigating acquisition, a product journey, an operational issue or another specific task. A category headline can be short, but the supporting explanation should name the work. Give a reader enough context to understand why a pictured chart matters rather than expecting familiar dashboard styling to explain the offer.
Use demonstrations that can actually be read
Choose one comprehensible example instead of a collage of tiny interfaces. Label illustrative data and explain the sequence from question to investigation. If the product preview is an image or a motion sequence, provide readable supporting text. Avoid presenting an illustrated conclusion as independently verified evidence of causation or a guaranteed outcome.
Separate evaluating, implementing and getting help
A trial, a sales conversation, an API reference and a support search serve different purposes. Give them meaningful labels and destinations. Do not require an existing customer to repeat the acquisition journey to find installation instructions or service status. Explain external account and documentation handoffs where they might otherwise be surprising.
Explain what the numbers mean
Define important measures and scope them to the product’s actual reporting model. Totals, rates, sessions and sampled views are not interchangeable. A marketing page need not reproduce a reference manual, but it should connect the attractive preview to accessible explanations of definitions, limitations and required inputs.
Keep collection and governance information reachable
Provide specific current technical and policy material for people responsible for data collection and handling. Treat privacy or no-cookie wording as a claim requiring its own review, not a design shorthand that settles every installation’s obligations. An analytics website should not imply that buying a tool completes a customer’s governance process.
Treat learning and ongoing support as product communication
Help pages, getting-started material, platform matrices and changelogs influence how understandable the offer is. Design them with a clear hierarchy and task-based language. Maintain brand-transition notices and account instructions so an older support destination does not silently imply an independent product or a current signup process.
The collection · 12 examples
12 data analytics company websites worth studying
The collection covers focused web reporting, product analytics, business intelligence and operational data platforms. It also includes explicitly labelled implementation and support views, which show another important part of an analytics company’s public website. These are design comparisons, not interchangeable service recommendations.
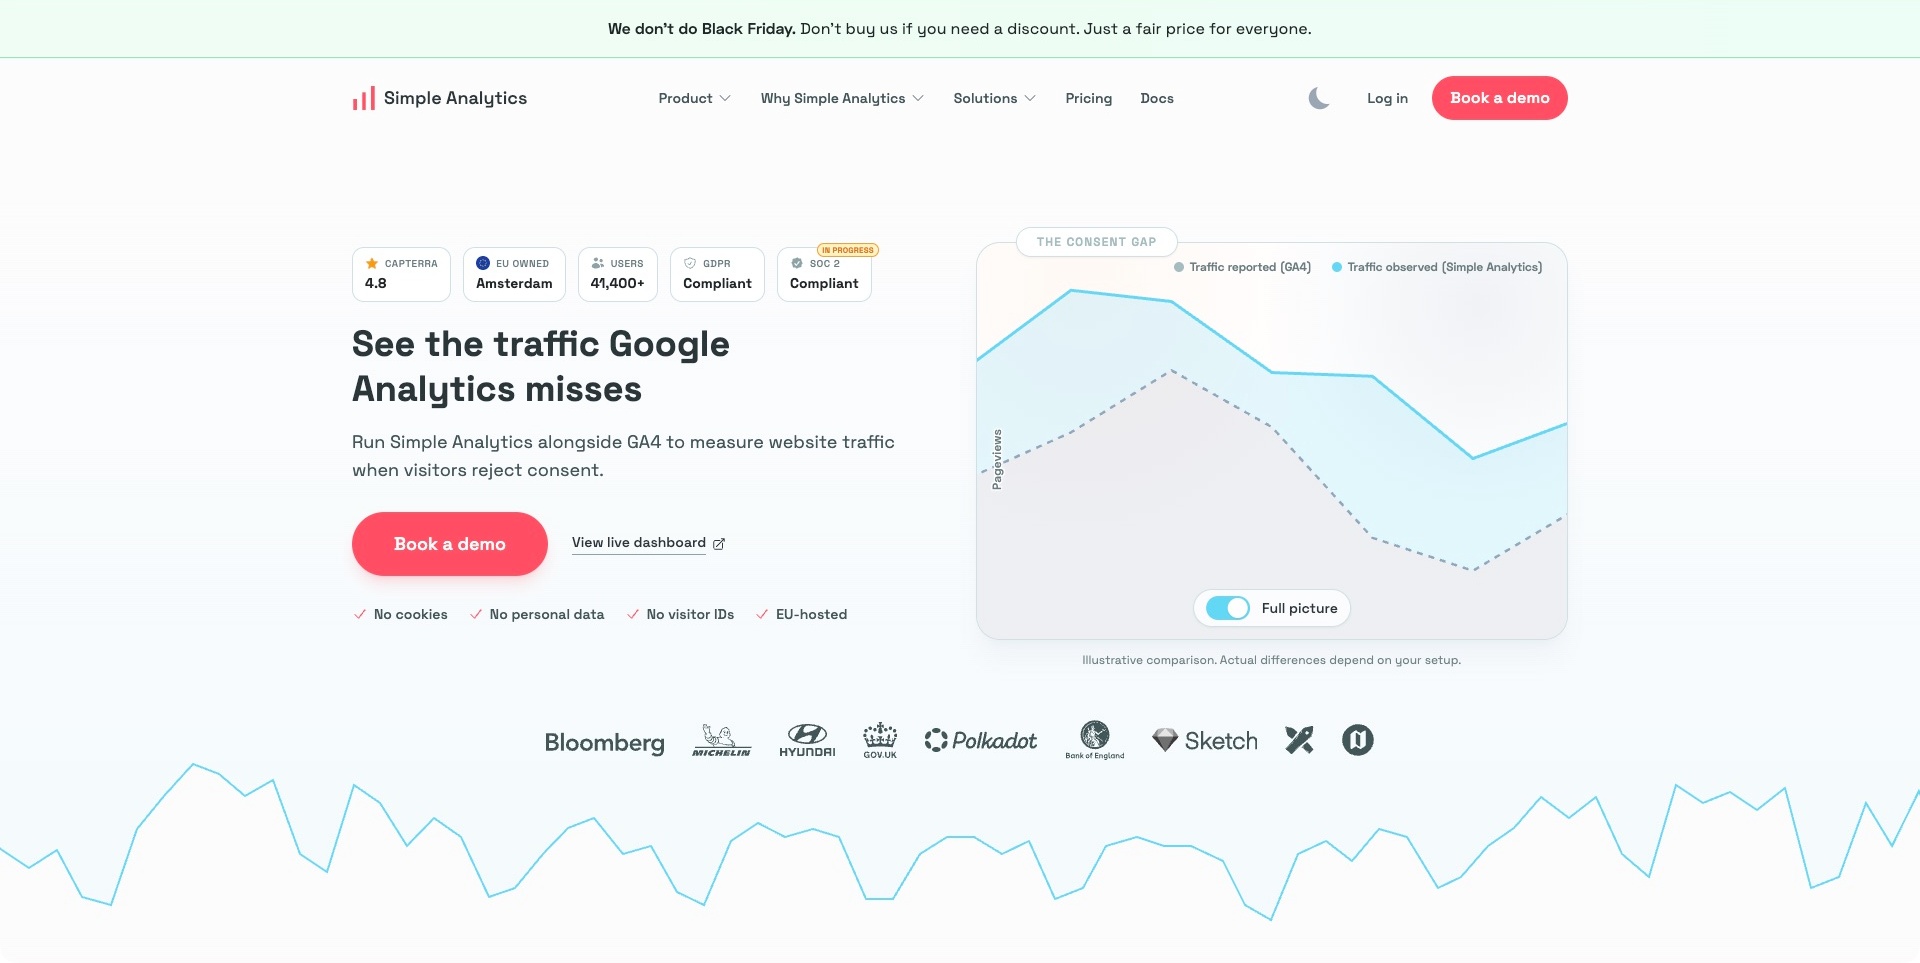
Simple Analytics uses pink actions and a restrained white layout to frame a specific website-measurement proposition. A line chart occupies the right side, with two labelled series, a comparison toggle and a visible note that the illustration depends on the setup. A demo button and live-dashboard link serve different levels of investigation. The useful design pattern is an immediately understandable comparison alongside an example the visitor can explore. The privacy, compliance and measurement claims remain supplier statements; this website review does not establish their legal validity or the amount of traffic another installation would measure.
What you can learn
Make a comparison’s scope visible where the comparison is shown. Label sample charts, explain definitions and give readers access to relevant documentation rather than treating a gap between lines as universal evidence. A public dashboard can support evaluation without requiring every visitor to begin with a sales conversation.
Pros
The comparison includes an explicit illustration qualification.
Assisted evaluation and a live dashboard have distinct labels.
Cons & considerations
If assurance badges lead the page, explain their actual scope in supporting material.
If competing measurement methods are compared, identify configuration and definition differences.
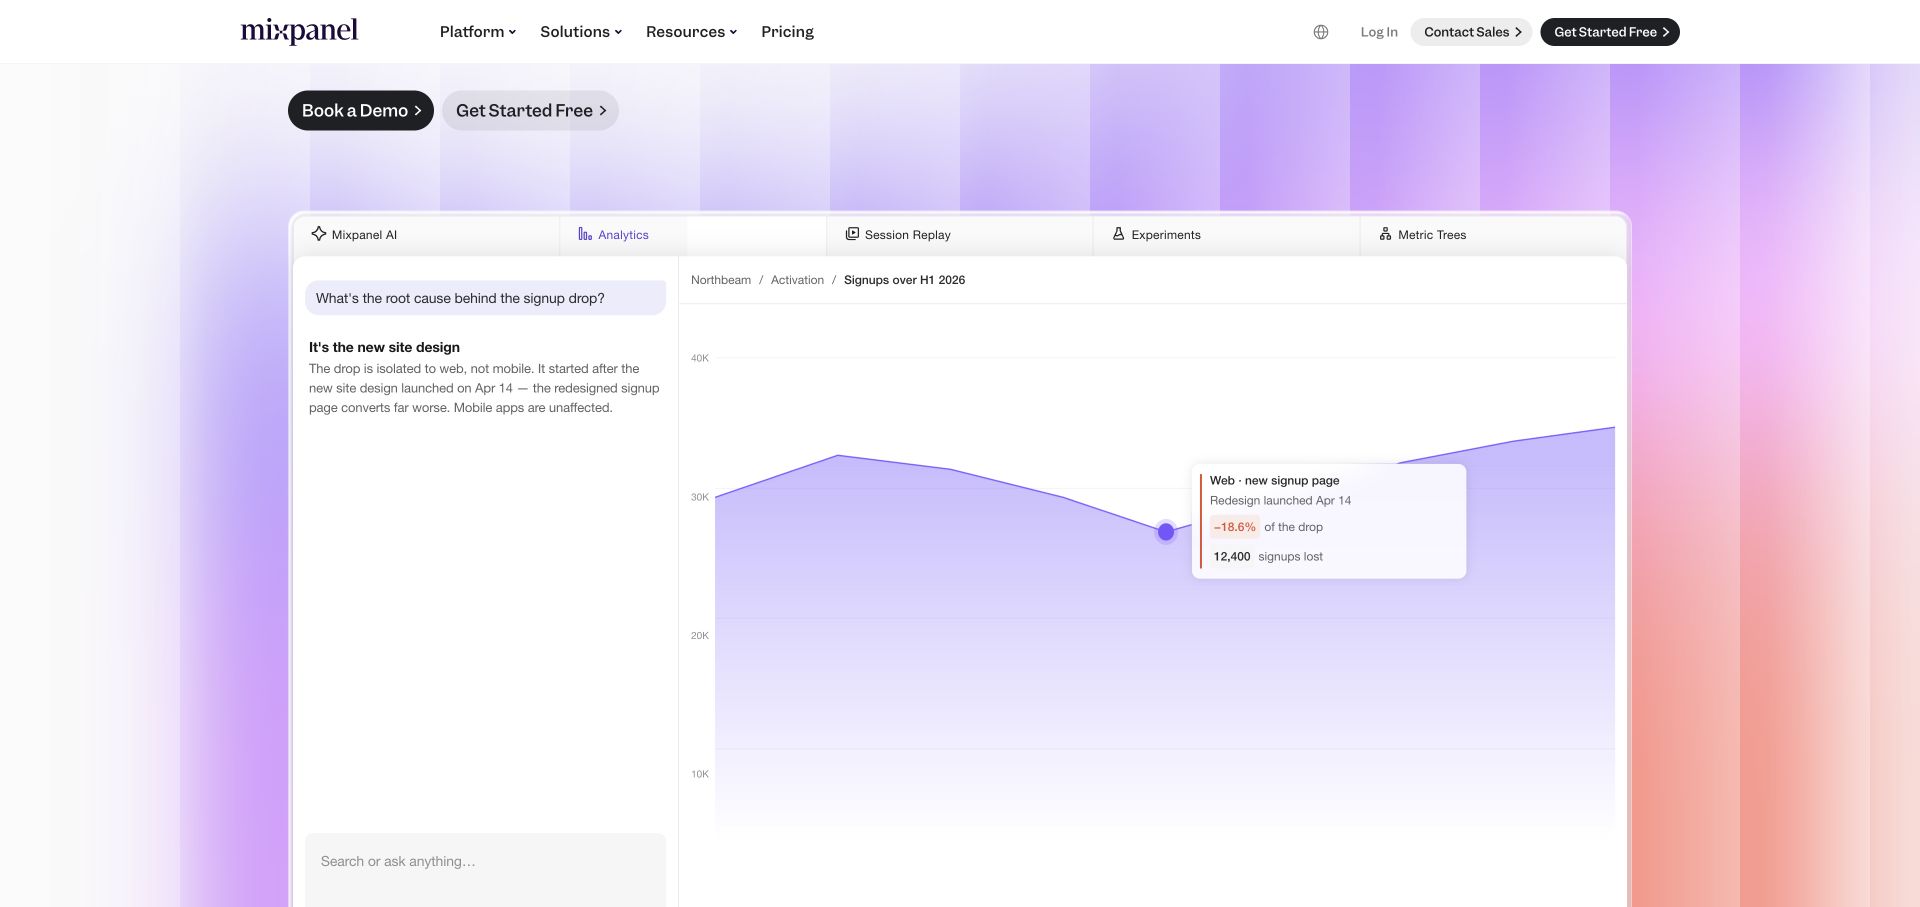
The captured Mixpanel view concentrates on a large product illustration rather than the beginning of the homepage headline. A question-and-answer panel sits beside a purple area chart, with an annotation linking a change in sign-ups to a pictured page update. Tabs distinguish analytics, replay, experiments and other product areas. The sticky header preserves pricing and evaluation actions. This is useful for studying how an analytics company can show a recognisable investigation instead of decorating a broad promise with an unexplained dashboard. The figures and suggested explanation are demonstration content, not independently established customer findings.
What you can learn
Choose one intelligible question for a product preview and show how the interface helps investigate it. Label example data, connect an annotation to an understandable event and give readers a route into the relevant feature. Do not turn an illustrative correlation into a verified causal conclusion.
Pros
The question and chart share one coherent demonstration.
Product tabs distinguish several related analysis tasks.
Cons & considerations
If the preview carries the explanation, provide readable supporting copy outside the image.
If an annotation suggests a cause, clarify what evidence and human review would be needed.
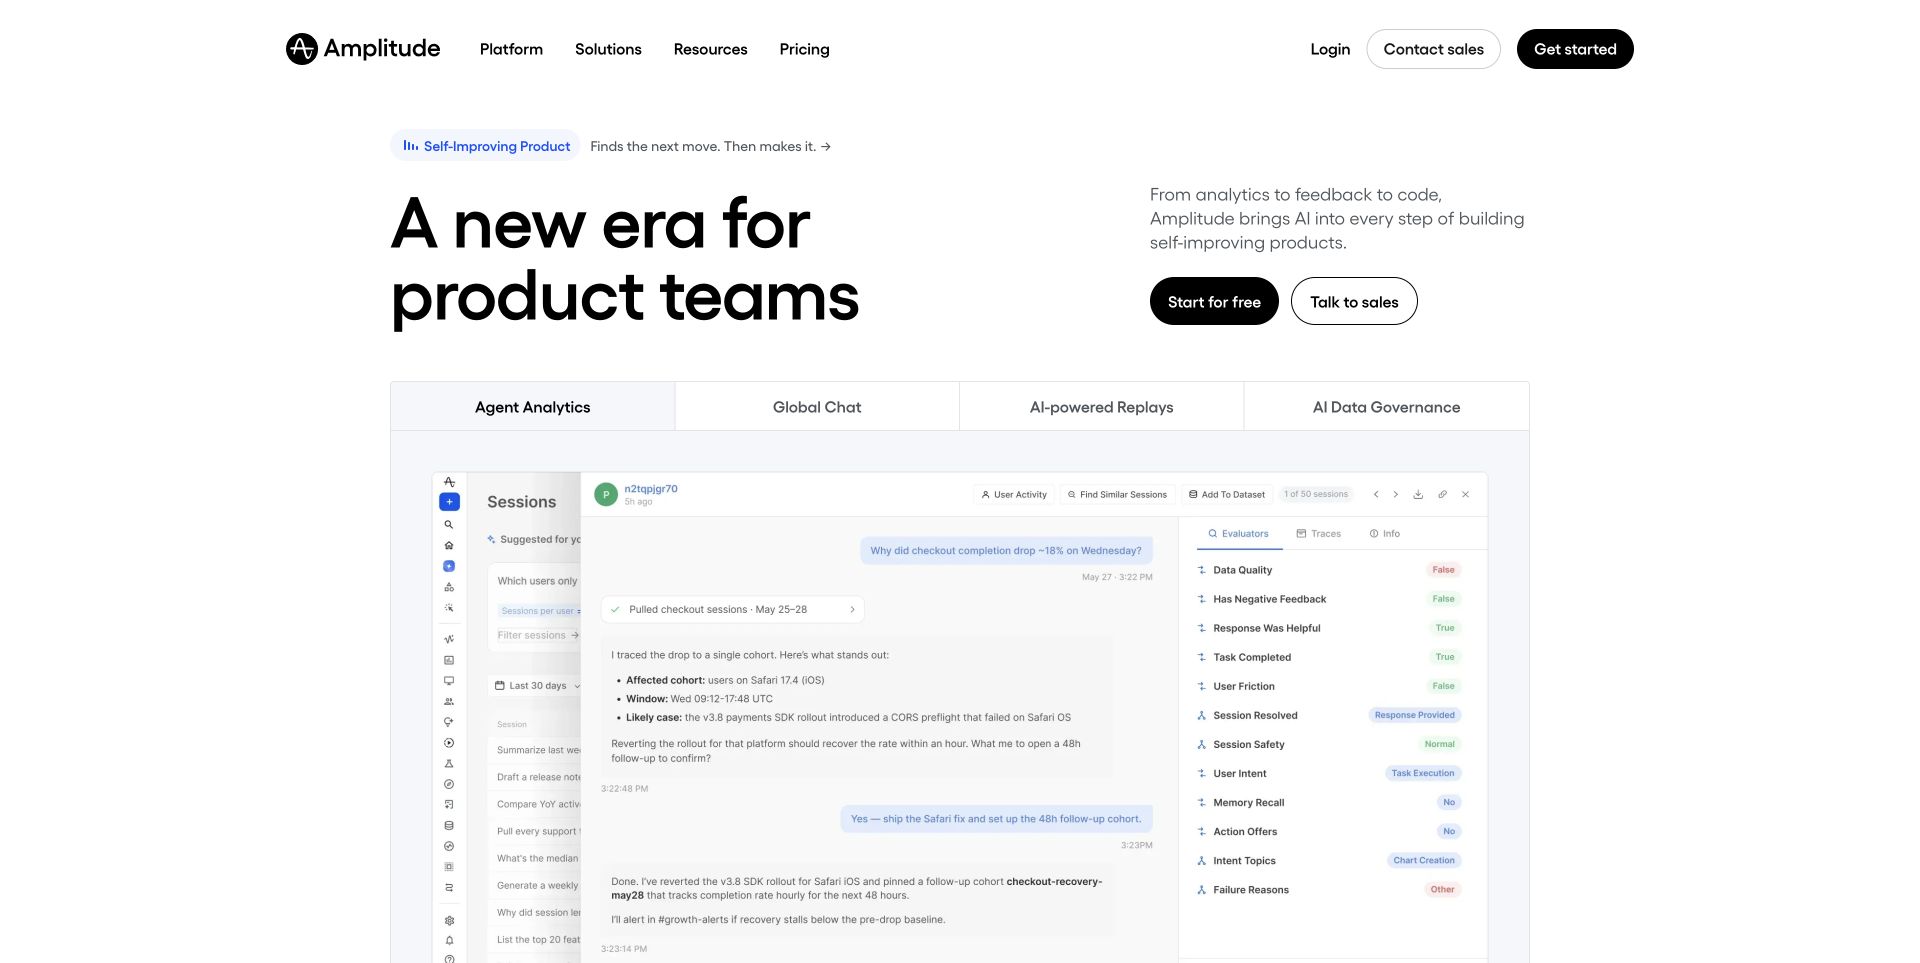
Amplitude’s white opening divides a large product-team headline from a short explanation and two evaluation actions. Below it, a tabbed panel names agent analytics, chat, replays and governance. The illustrated workspace contains a question, supporting analysis and an information column, making the offer more concrete than a generic growth chart. The useful design pattern is the transition from concise positioning to a recognisable working environment. The pictured conversation and its proposed next action are marketing demonstration material; the screenshot is not evidence of autonomous changes to a real customer application.
What you can learn
Introduce the category simply, then use a specific interface example to explain the work involved. Distinguish product analysis, replay and governance instead of treating every capability as the same kind of insight. Provide readable explanations and clear review boundaries wherever an illustration suggests that software recommends or performs an action.
Pros
The short introduction leaves room for a substantial product preview.
Self-service and sales-led evaluation are visibly separated.
Cons & considerations
If the workspace contains small text, provide another way to understand the example.
If an illustration suggests automated remediation, explain approval and responsibility boundaries.
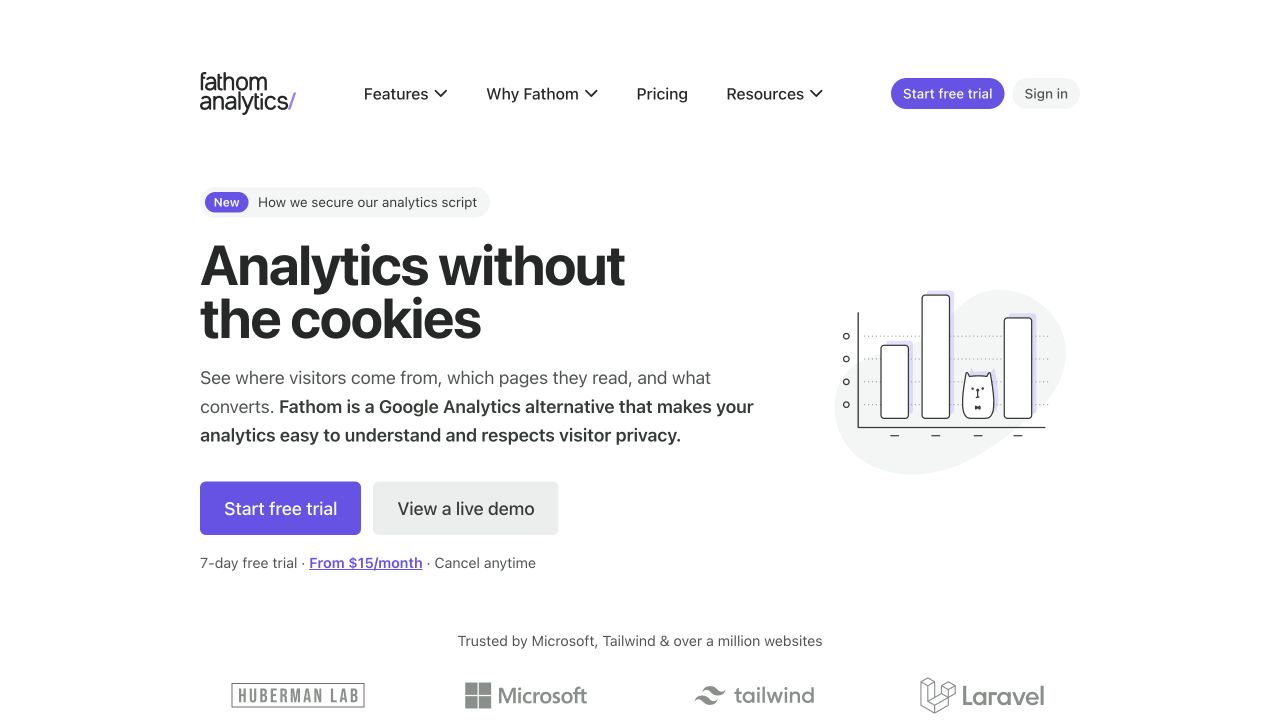
Fathom’s captured homepage uses a plain white background, a compact purple-accented headline and a small bar-chart illustration. Trial and live-demo actions appear together, with a pricing link directly underneath. Features, product explanation and resources remain in the header. The useful pattern is an economical introduction that gives a visitor more than one way to investigate an analytics service. Its cookie and privacy positioning is recorded as the supplier’s message, not an independent conclusion about legal obligations, a particular installation or the behaviour of every script on a customer website.
What you can learn
Name the reporting problem in ordinary language and make the next evaluation step tangible. A public demo can help someone understand the dashboard before creating an account. Keep pricing, documentation and data-handling explanations reachable, and separate the visual promise of simplicity from the configuration and governance work a real implementation requires.
Pros
Trial, demonstration and pricing routes are close together.
The restrained illustration supports rather than overwhelms the explanation.
Cons & considerations
If privacy leads the proposition, link to specific current technical and policy detail.
If simplicity is the differentiator, explain which reporting tasks are intentionally outside the product.
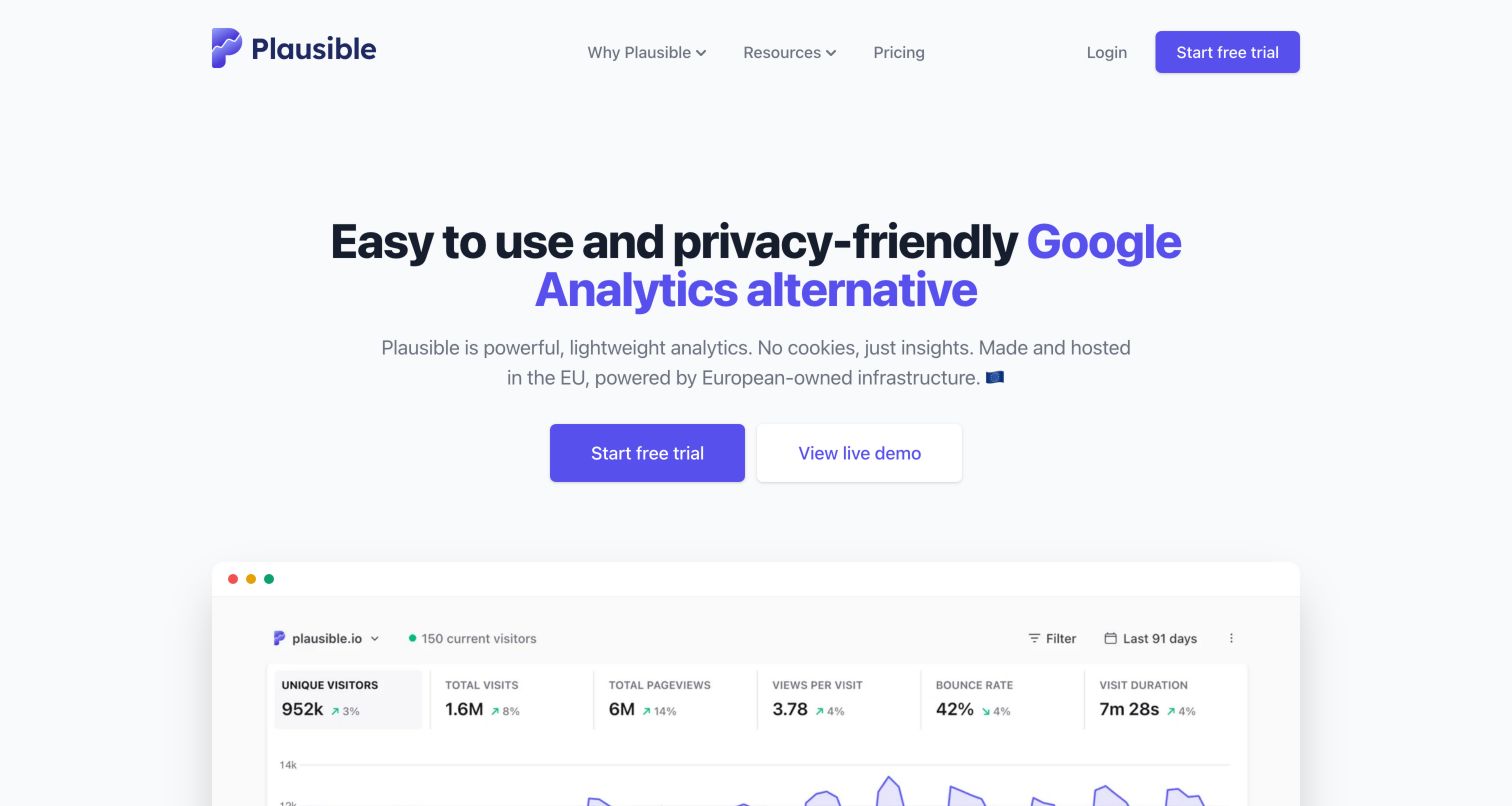
Plausible centres a large two-line proposition above paired trial and live-demo actions. The beginning of a dashboard appears below, with familiar traffic totals and a line chart contained in a browser-like frame. The header keeps product explanation, resources and pricing compact. The useful pattern is continuity between a simple introductory message and a concrete reporting view. The displayed numbers are illustrative interface content, and the supplier’s privacy, hosting and performance language does not independently establish compliance or the behaviour of a particular customer installation.
What you can learn
Let visitors inspect the kind of report they will receive before asking them to commit. Give the dashboard a clear reading order and explain unfamiliar measures in ordinary language. Keep data collection, retention and integration information separate from an attractive preview so the commercial proposition does not substitute for an implementation decision.
Pros
The dashboard preview makes the product category immediately recognisable.
Trial and demonstration actions offer distinct evaluation routes.
Cons & considerations
If a comparison with another platform leads the page, define the relevant differences precisely.
If compact totals dominate the preview, explain metric definitions and data limits elsewhere.
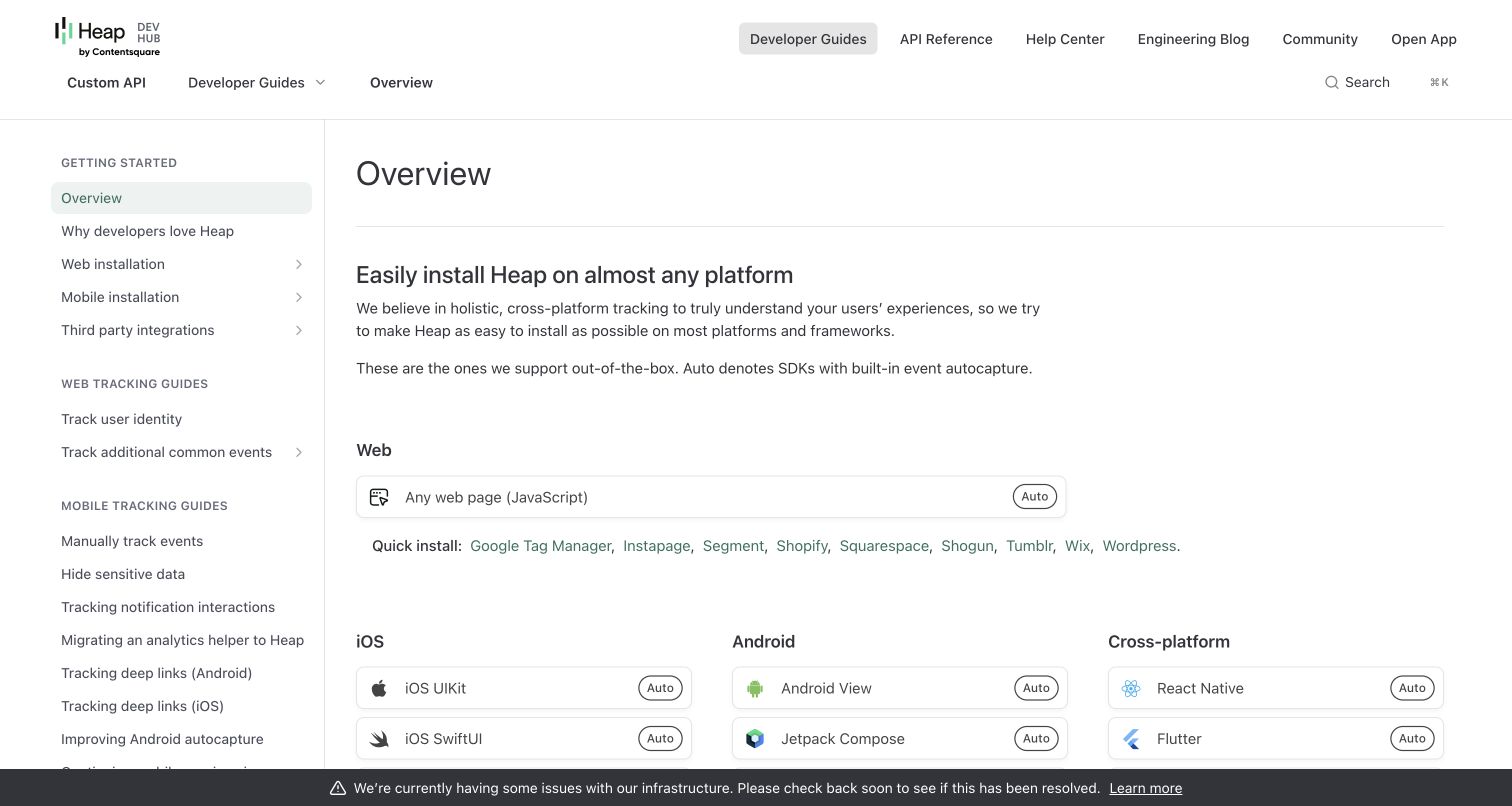
Heap’s developer overview combines a persistent left navigation with a broad installation matrix. Web, iOS, Android and cross-platform options are separately labelled, while small Auto badges have an explicit explanation in the introduction. A top row distinguishes guides, reference material and help. The captured bottom infrastructure-status announcement is ordinary operational content, not a consent overlay. The useful design pattern is a practical implementation entrance that reduces the distance between evaluating an analytics product and understanding how it might be installed. Supported platform names do not identify the technology used to build Heap’s documentation site.
What you can learn
Organise implementation material around the environment a developer recognises, then explain badges and installation routes before presenting a long reference. Keep product help, API details and service status distinguishable. A clear documentation layout should also direct readers to sensitive-data handling and account-specific requirements rather than implying that installing a script completes an analytics plan.
Pros
Platform groupings make the installation overview easy to scan.
Guides, API reference and help have distinct destinations.
Cons & considerations
If automatic capture is highlighted, explain exclusions and governance responsibilities nearby.
If many platform options appear, preserve a clear beginner route through the documentation.
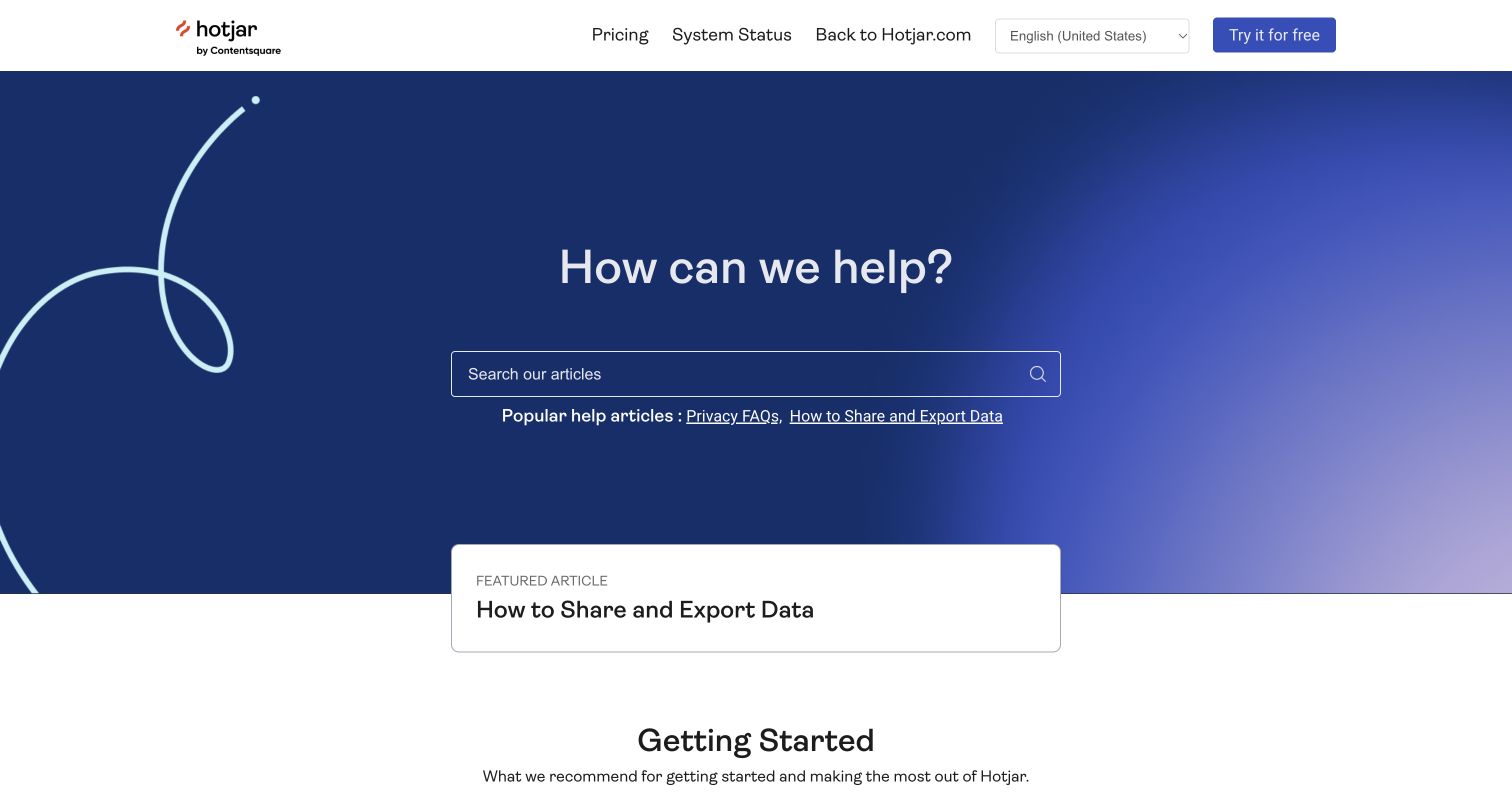
The retained Hotjar help-centre image places a large search field inside a blue introduction, with a short row of popular article links beneath it. A featured card highlights sharing and exporting data, while a getting-started section begins below. Pricing, service status and a return to the main site have individual header labels. The useful pattern is a support experience organised around a person’s immediate task. This is a dated official help view, not a new marketing homepage; the current primary Hotjar destination explains the product’s transition into Contentsquare.
What you can learn
Separate support tasks from acquisition messages and make likely questions reachable without knowing the product’s internal terminology. Feature important operational articles with descriptive titles, then preserve routes to status and product information. When a brand or platform changes, explain that relationship clearly rather than leaving older help destinations to imply a separate current service.
Pros
Search occupies an obvious and generous location.
The featured export article names a concrete customer task.
Cons & considerations
If branding or account arrangements change, explain the transition near relevant support routes.
If popular articles are prominent, keep their selection and destinations current.
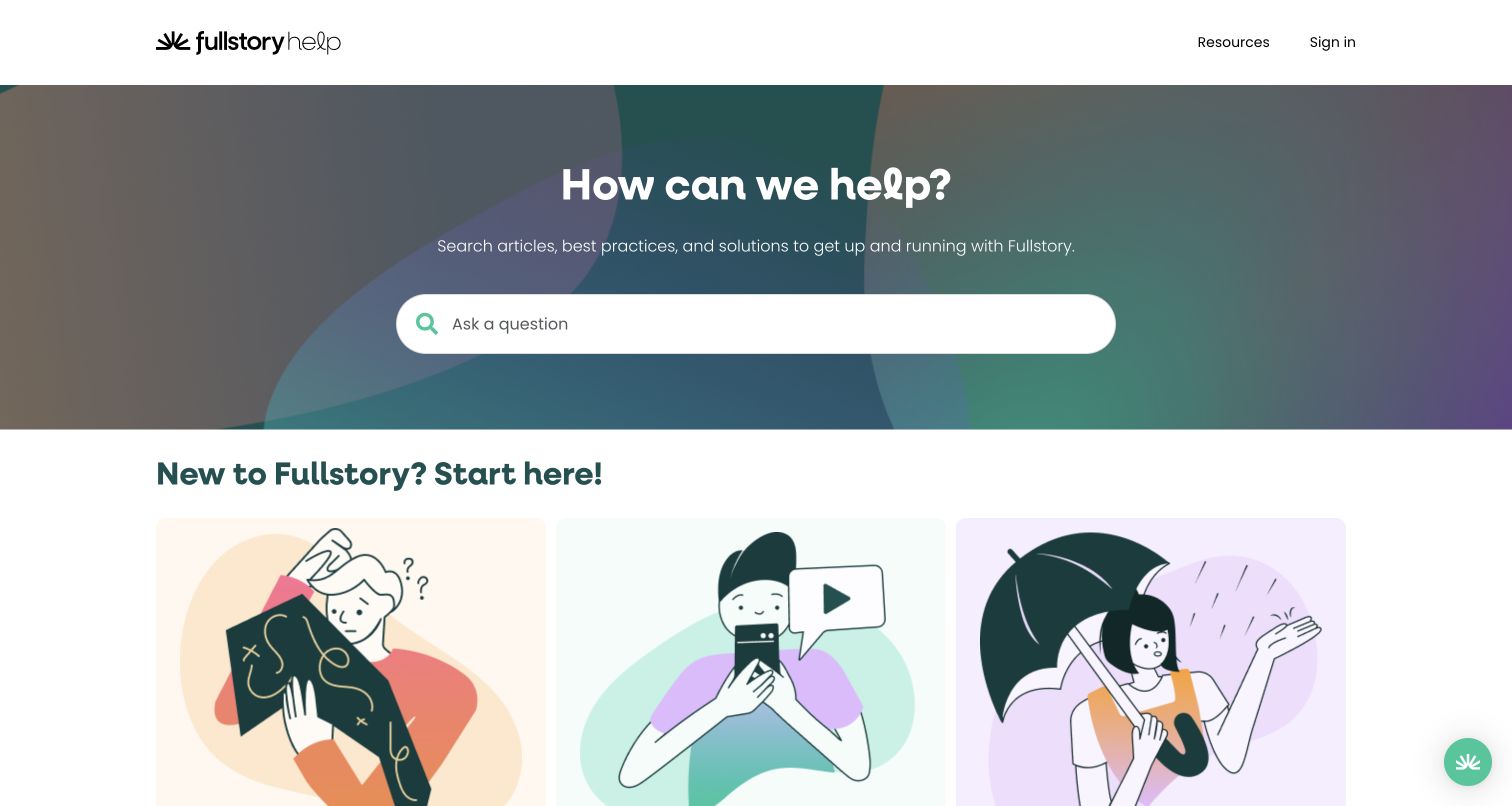
Fullstory’s help-centre opening gives most of the first view to a large question and a prominent search field. The next section introduces three illustrated starting routes, while resources and sign-in remain in a restrained header. A small collapsed green launcher sits at the lower-right without opening a panel over the content. The useful design pattern is a distinction between searching for a known issue and browsing for an initial learning path. This is the public support property, not a screenshot of a customer’s session recordings or private analytical data.
What you can learn
Provide a strong search route while acknowledging that a new customer may not know what to ask. Use clear categories and practical article titles below the search rather than relying on decorative illustrations alone. Keep product learning, developer implementation and service-status information connected but distinguishable, especially when analytics terminology can mean different things to different roles.
Pros
The large search field gives returning users a direct starting point.
Illustrated entry cards create a separate route for beginners.
Cons & considerations
If illustrations carry category meaning, provide explicit descriptive labels.
If a launcher is added, ensure it does not obscure search, articles or navigation when expanded.
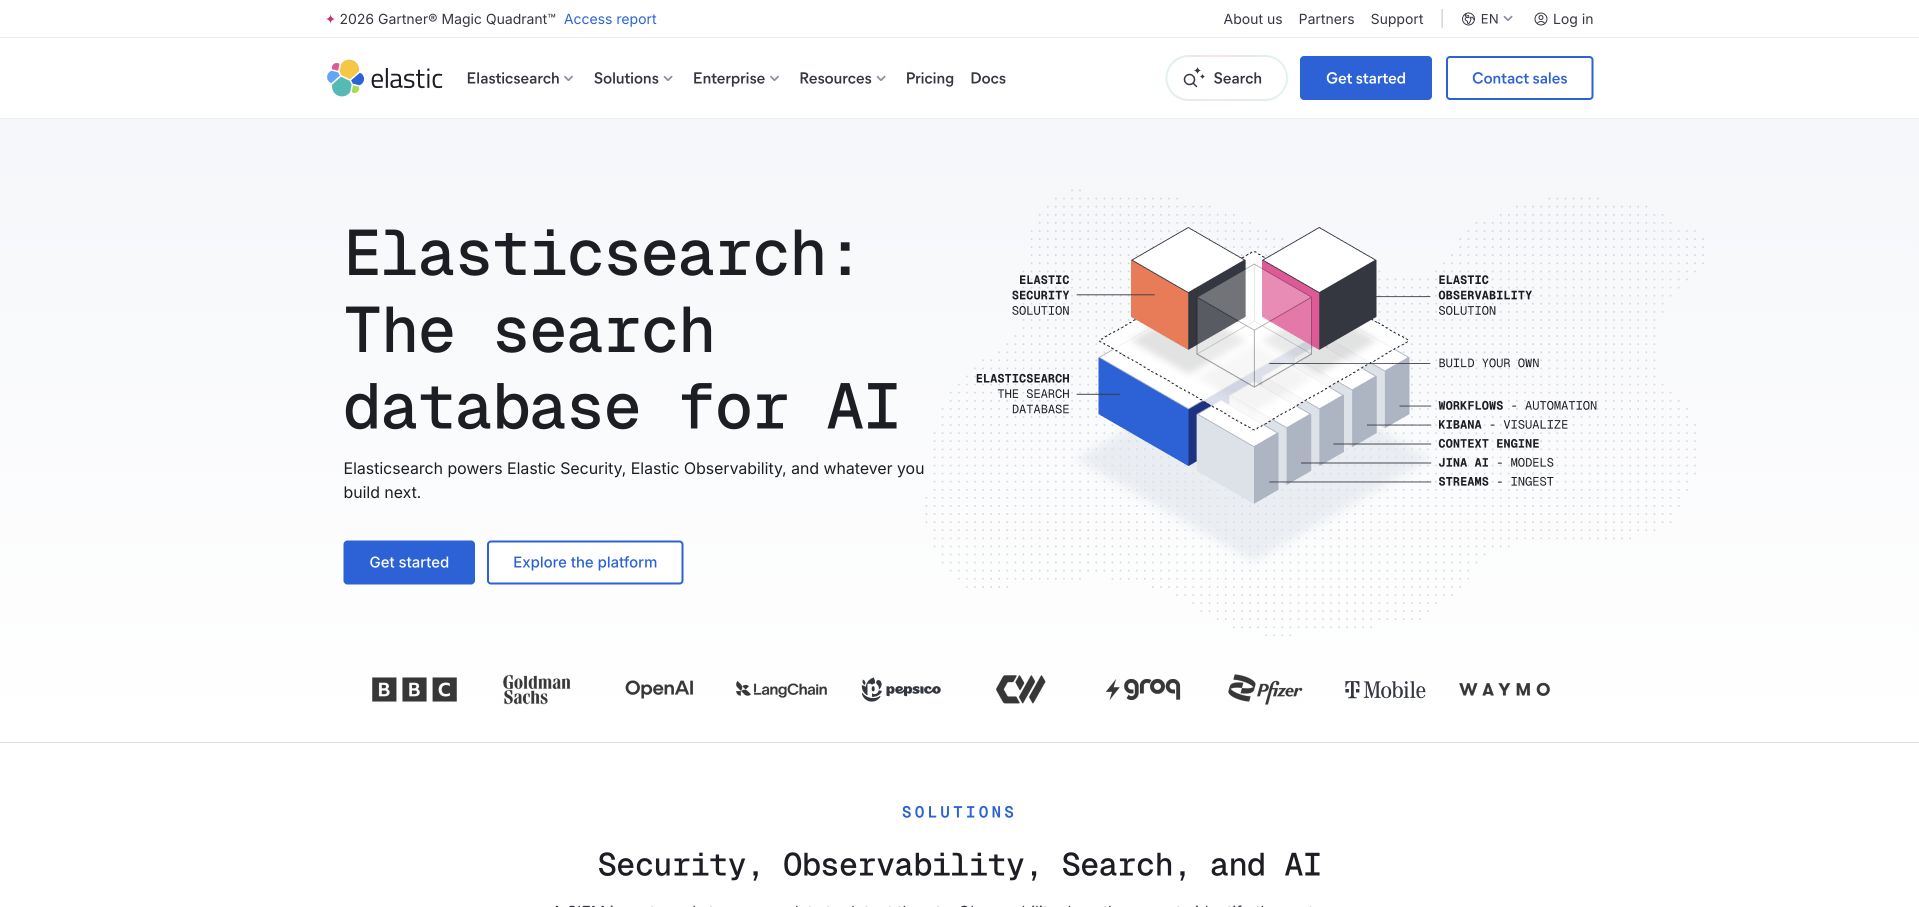
Elastic’s captured homepage pairs a large monospace search-database heading with an exploded cube diagram. Labels connect the underlying database with observability, security and build-your-own applications, while two actions distinguish getting started from exploring the platform. The conventional header retains pricing and documentation. The useful design pattern is an architectural relationship explained visually rather than a feature grid with no organising principle. This is a broader search and operational-data platform example, not a direct equivalent of a small website-traffic dashboard. Customer marks do not establish the configuration or performance of those organisations’ systems.
What you can learn
Explain which component is foundational and which tasks sit above it, then give each audience a route into the relevant detail. Keep an architecture illustration readable without relying entirely on tiny labels. Distinguish a platform’s analytical capabilities from claims about the technologies used on its own public marketing page.
Pros
The diagram gives several product areas a shared conceptual structure.
Documentation and commercial evaluation remain independently reachable.
Cons & considerations
If small diagram labels carry essential meaning, repeat the explanation in readable text.
If multiple use cases share one engine, help a narrow-task visitor identify the appropriate starting point.
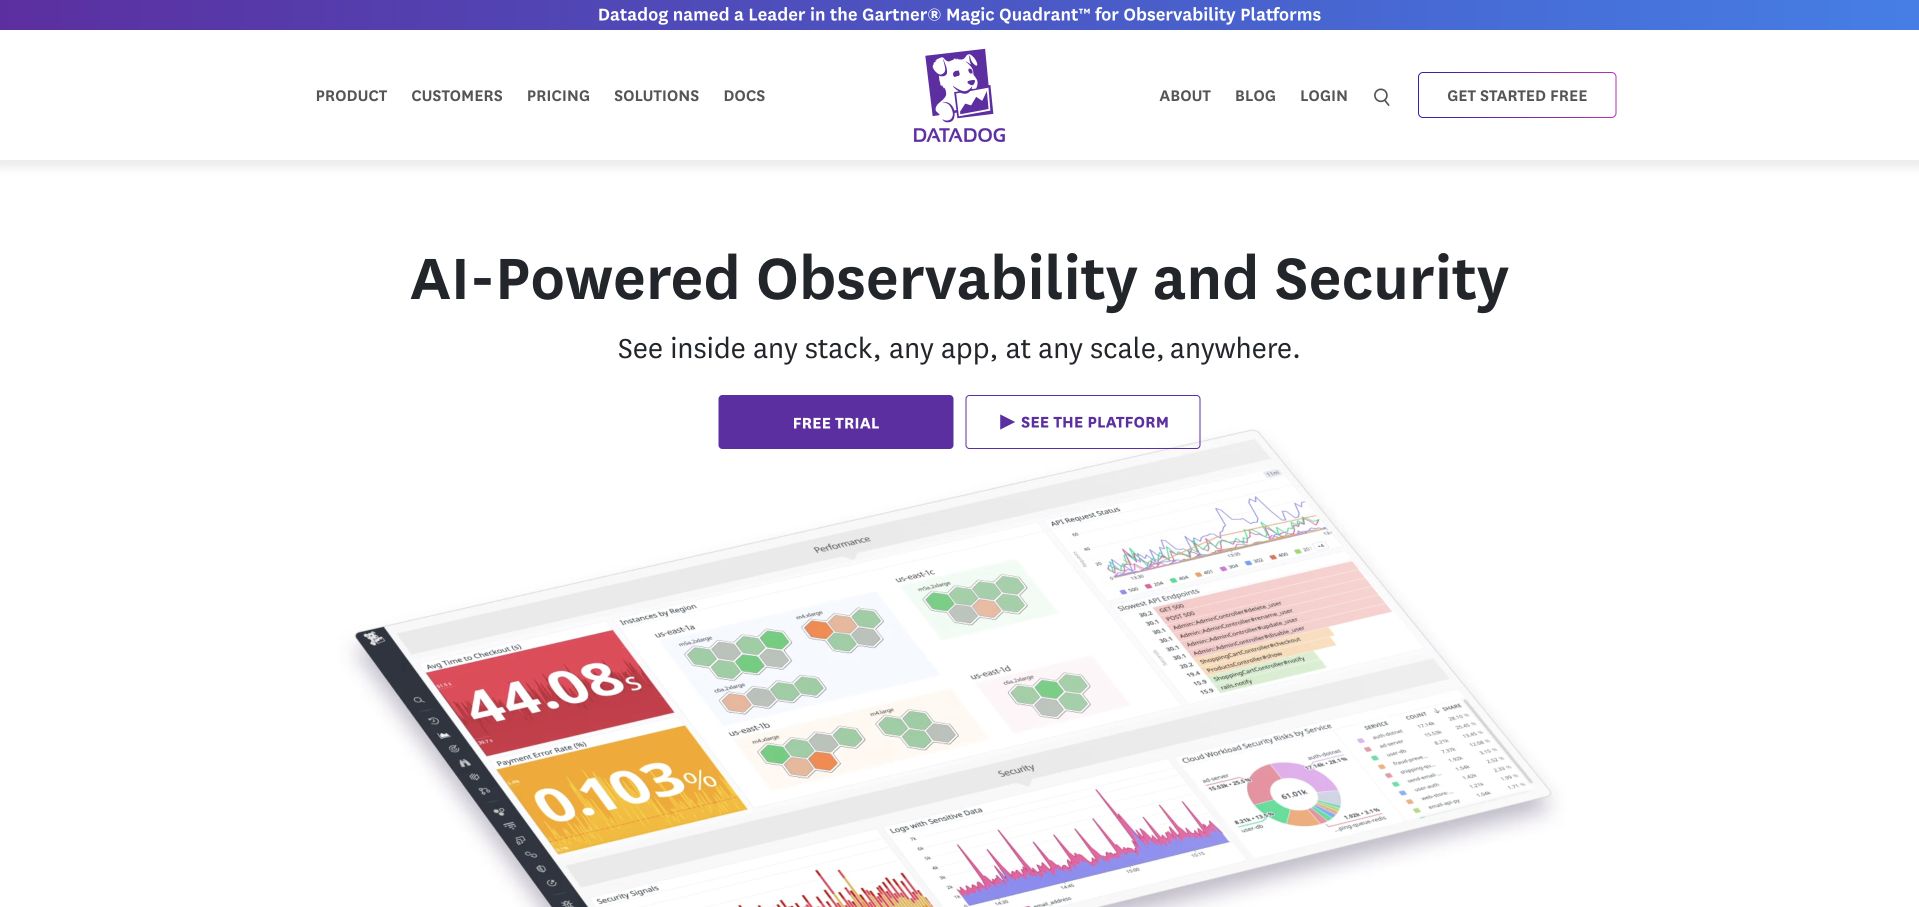
Datadog’s captured homepage centres a short observability-and-security proposition above trial and platform-exploration actions. A large angled dashboard illustration then introduces charts, status blocks and application measurements. The familiar purple identity connects the logo, actions and the top analyst-report announcement. The useful design pattern is a recognisable monitoring environment supporting an otherwise broad category claim. This example concerns operational and digital-experience analytics, not an independent audit of the displayed performance figures. The public illustration does not expose a customer account or establish the marketing site’s backend.
What you can learn
Show a plausible analytical task while keeping example figures distinct from verified product outcomes. Give different evaluators routes into infrastructure, applications, logs and product analytics without expecting them to interpret one generic dashboard. Pair visual breadth with readable explanations of the data sources, definitions and operational responsibilities relevant to each use case.
Pros
The interface illustration makes an abstract monitoring category concrete.
Trial and platform exploration are separately labelled.
Cons & considerations
If a dashboard is angled or reduced, provide readable supporting examples elsewhere.
If many technical products share the introduction, preserve task-specific navigation and definitions.
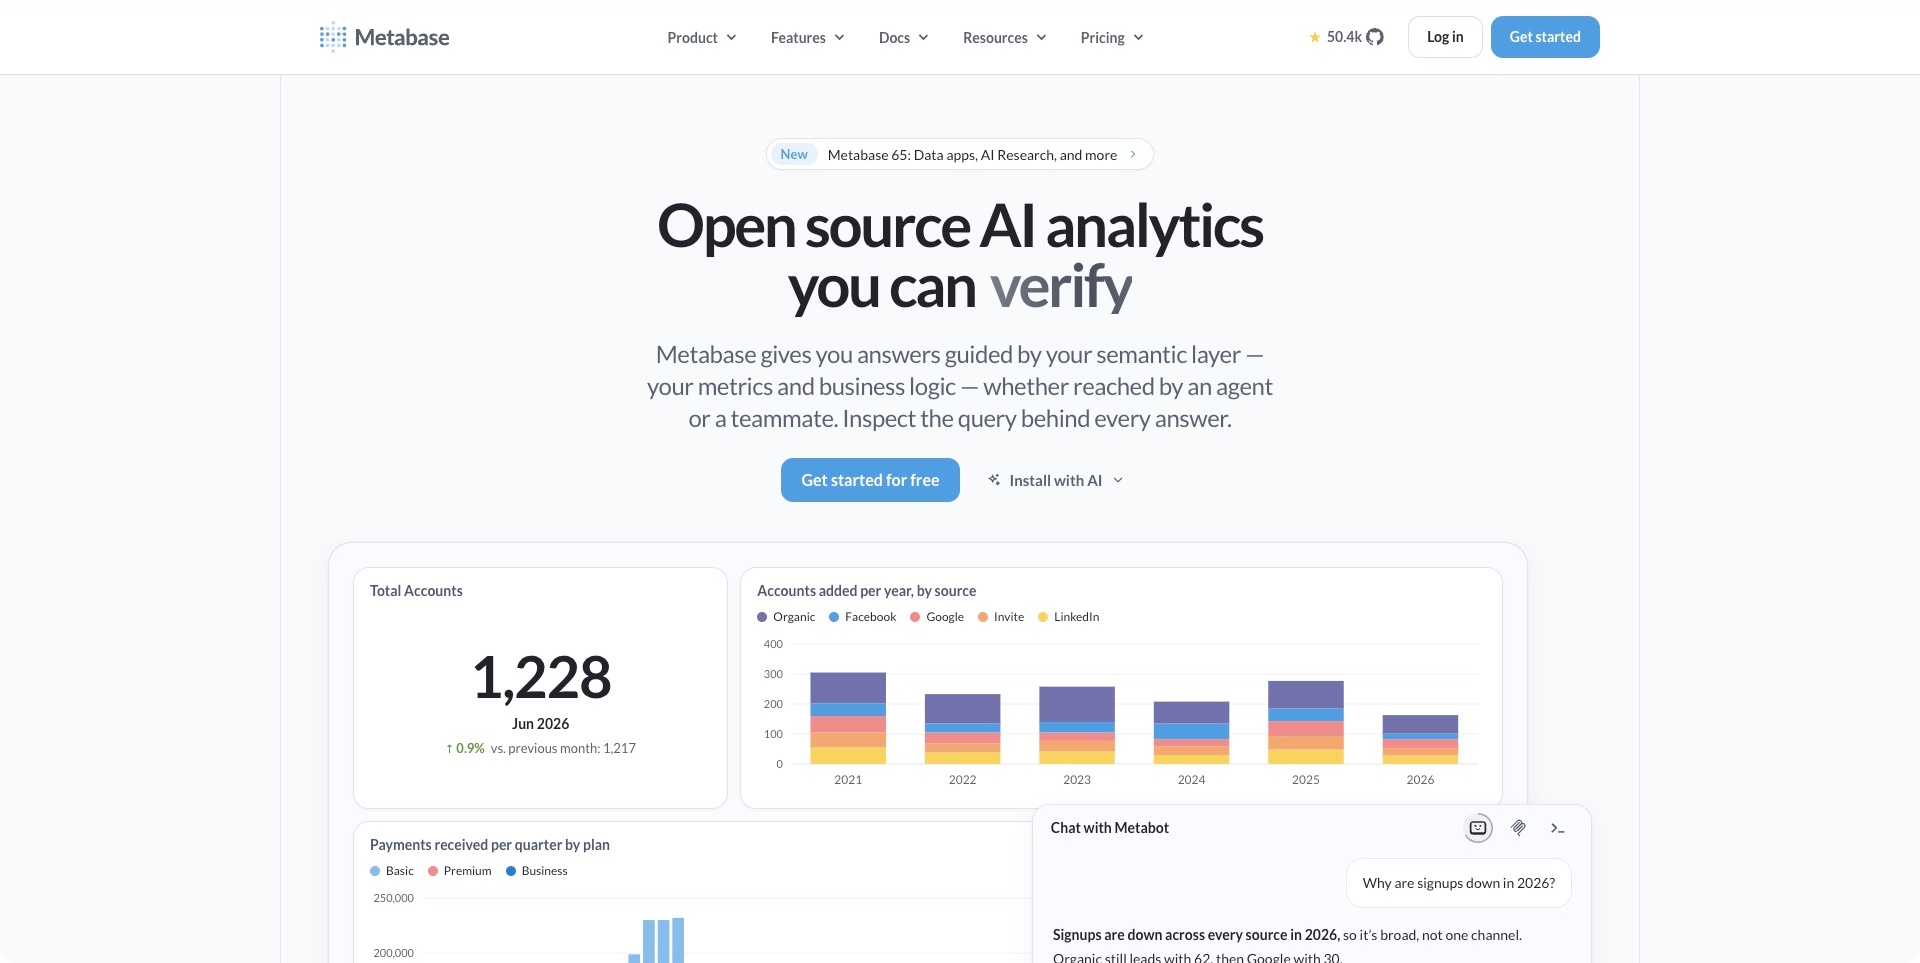
Metabase’s pale introduction centres a large analytics statement above a paragraph about metrics, business logic and inspecting a query. The first actions separate starting an account from an installation route. A dashboard below combines a prominent total, a source chart and other report panels with an overlapping Metabot conversation. The useful pattern is connecting a conversational question to the underlying analytics context. The pictured charts and answer are public product illustrations, not independent evidence that a particular dataset is accurate, an answer is correct or a deployment has the intended permissions.
What you can learn
Explain where a reported answer comes from and what the evaluator can inspect next. A conversational panel should not replace definitions, query context or responsibility for interpretation. Keep installation, learning and account creation distinct, and provide readable supporting explanations for visitors who cannot decipher a dense dashboard image.
Pros
The introductory copy connects answers to metrics and query inspection.
The demonstration gives the analytics category a concrete working surface.
Cons & considerations
If an assistant answer is prominent, explain its example context and verification boundaries.
If dashboard text carries essential meaning, offer a readable alternative on small screens.
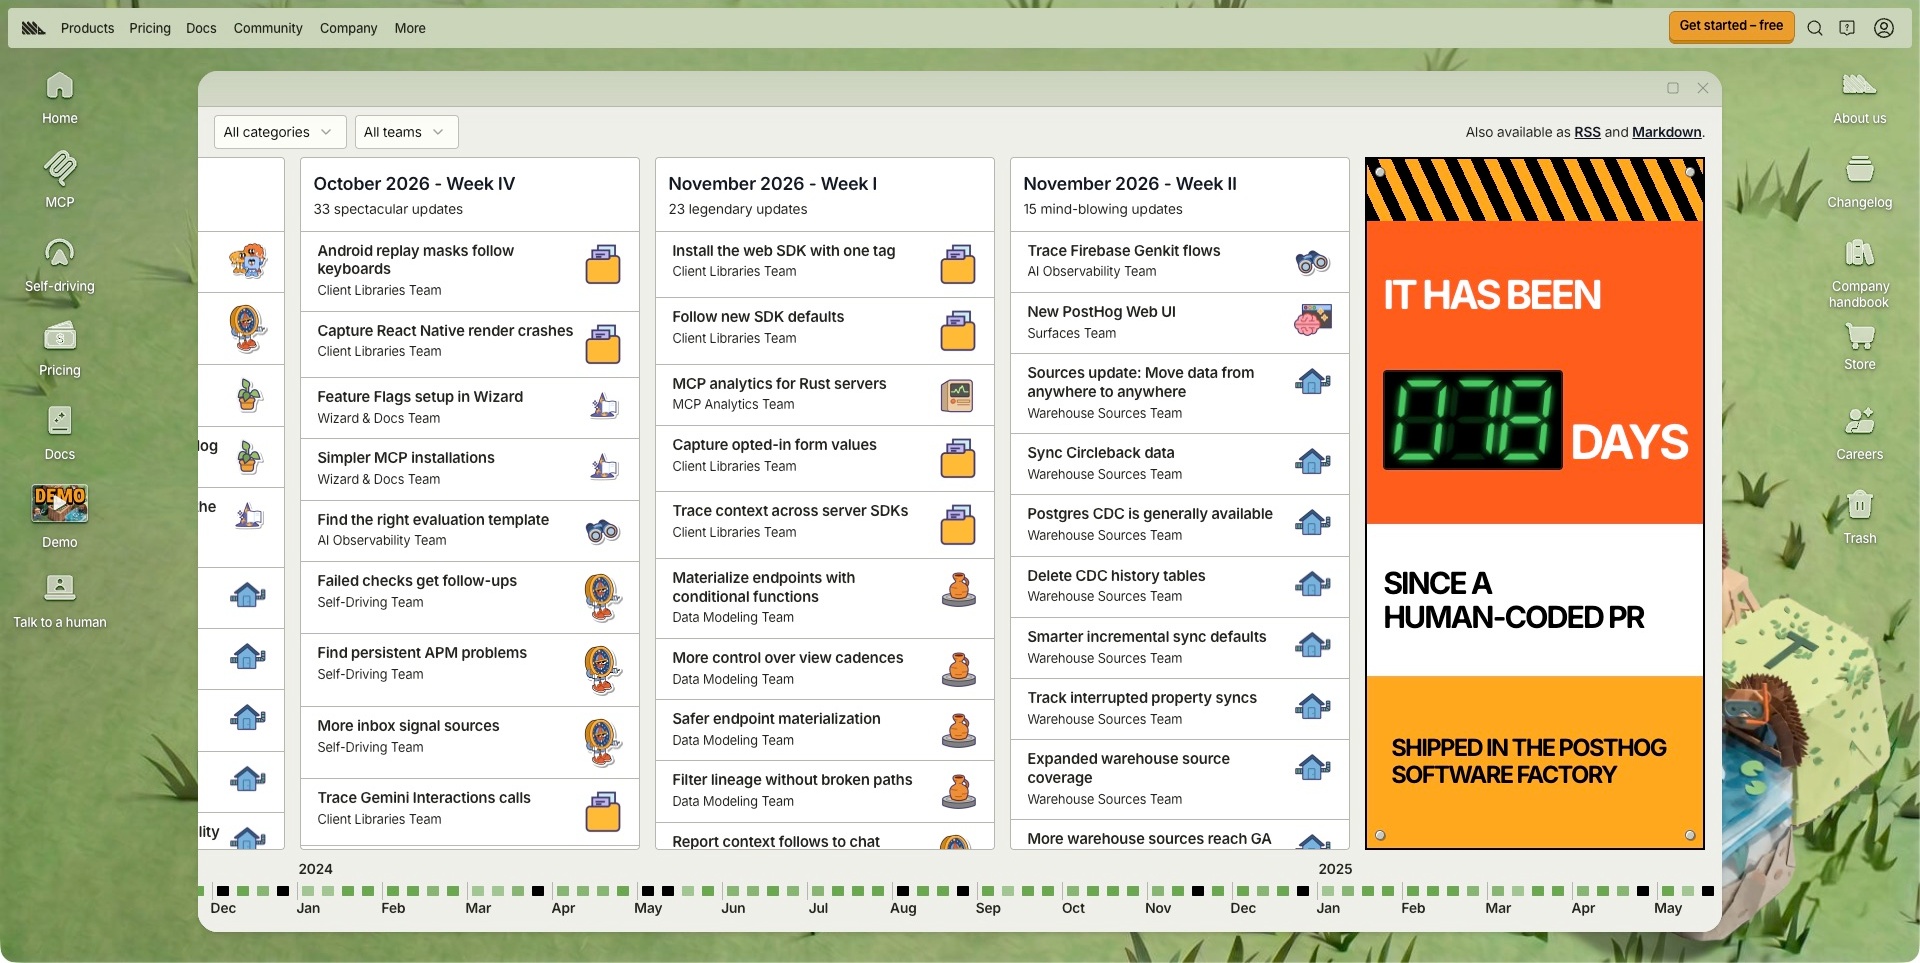
The captured PostHog source is its changelog, not the homepage. A grassy desktop surrounds a window-like board with weekly release columns, category and team selectors, and a long date timeline below. Individual entries identify a short change and responsible team, with permanent navigation above. The useful pattern is making a large release history explorable without reducing it to an undifferentiated article stream. The board records public announcements; it does not independently establish availability in every plan, the correctness of an analytics result or how a customer installation is configured.
What you can learn
Organise change around the questions a reader actually has: what changed, which product it affects and where to investigate details. Preserve a chronological route alongside filters, and keep relevant documentation reachable. A distinctive metaphor should support those tasks rather than require visitors to understand desktop conventions before finding a release.
Pros
Weekly columns and team labels give the release stream several organising dimensions.
Category filters provide a route beyond reading every announcement.
Cons & considerations
If the board extends horizontally, provide an understandable way to navigate it on small screens.
If a release describes a new capability, clarify its actual availability and implementation requirements.
Kegan is a freelance web designer and developer with 15+ years of experience helping businesses turn complicated website requirements into clear, maintainable digital experiences. He works directly with clients from planning and design through development, launch, and ongoing support.
For data analytics company website design, his development approach focuses on clear measurement and analysis use cases, useful product and report examples, documented integrations and data-handling boundaries, and distinct trial, demo and support routes. The scope can be a targeted improvement or a complete custom build, with responsive layouts, thoughtful content structure, and integrations chosen around the people using and maintaining the site.
Show 3 other data analytics company website designersHide other data analytics company website designers
Plan an analytics website around the path from a question to a useful next step
Define the category, intended users and actual analytical job
Write a concise description of the offer before designing a hero. Identify the person using the product, the question being investigated, the inputs involved and the kind of result the product presents. A small-business owner checking traffic sources has different expectations from an engineer investigating application behaviour or an analyst building a business report. Those distinctions should guide navigation and examples rather than appear only in later sales conversations.
Make a list of adjacent categories that could cause confusion. Decide where the product sits in relation to reporting, replay, experimentation, search and observability, and explain important boundaries. The goal is not to make a broad platform sound narrow. It is to help a reader enter the right part of that platform without interpreting an unexplained list of features or assuming that every analytical task is supported in the same way.
Design one honest product demonstration before building a gallery of screens
Select a realistic question that can be understood in a few sentences. Show the relevant part of the interface and explain how a person moves through the investigation. Label example data, date ranges and any assumptions needed to understand the illustration. A diagram should reveal a relationship; a chart should have a reason for being there. Do not use a dense interface simply because it looks technical.
Plan a readable alternative to the largest product image. On a narrow screen, a detailed dashboard may become an illegible decorative block. A short sequence of text, focused crops of your own product interface or a properly introduced demonstration can communicate the task more effectively. Keep a supplier-provided example distinct from a real customer result, and do not imply that a correlation proves the reason an outcome changed.
Map evaluation routes and explain what each one starts
Compare the needs behind a live demo, a trial, a sales discussion and a pricing visit. If a public demonstration exists, explain whether it contains example data and whether account creation is required. If a trial starts a separate account process, make that handoff understandable. If a conversation is needed for a particular plan or deployment, state that rather than implying every visitor can follow the same self-service path.
Keep the initial form proportionate to the task. Someone asking about product fit should not need to provide a private dataset or detailed customer records simply to start a conversation. Agree on the actual routing and follow-up process with the responsible team. The website should describe what happens next without inventing a response-time promise or making guarantees that the commercial and support teams have not approved.
Give implementation and support an intentional place in the architecture
Create a destination map for installation guides, SDK material, API references, account help, training and status information. Use labels that distinguish those functions. A developer following installation instructions should know which environment the material applies to and where to find prerequisites. A customer who knows the problem should be able to search; a beginner who does not know the terminology should have a browseable starting route.
Define ownership for these properties as carefully as for the marketing pages. Product changes can leave a setup article, category card or featured help link behind. Brand transitions also need explicit explanation: an older support identity can remain useful, but its relationship to the current company and account process should be clear. Treat support content as part of the public experience rather than a disconnected portal added after launch.
Separate reporting definitions, supplier claims and governance review
Make a small content model for important terms, limitations and supporting sources. Decide where a visitor can learn how the product defines an event, session, user or other principal measure. Explain the relevant boundaries of an illustration without turning a marketing page into a wall of caveats. The more persuasive a numerical comparison appears, the more important it is to identify what is actually being compared.
Ask the appropriate technical and policy reviewers to approve data-handling descriptions. Copy about privacy, cookies, retention, hosting regions or consent must reflect the current product and actual context. A website designer can make this material clearer and easier to find, but visual polish does not establish legal compliance or a safe configuration. Keep the relevant sources current and avoid borrowing another supplier’s assurance language as generic marketing copy.
Test whole tasks and maintain the material after release
Test a few real journeys from beginning to end: understanding the category, finding an appropriate demonstration, comparing the relevant commercial information, locating installation instructions and searching for help. Check the actual forms, menus, search controls, media and external handoffs at realistic screen sizes and with keyboard interaction. A screenshot can inspire a composition, but it cannot prove that an interactive task works.
Assign owners to plans, screenshots, feature labels, documentation links and support categories. Record the dates of substantive checks and keep old captures distinct from current product facts. Revisit a prominent demonstration whenever the interface changes enough to make it misleading. Track website usability separately from analytical accuracy, product performance and organisational data governance; each requires a different kind of evidence and review.
The editing job behind the design
Choose a content system that keeps product explanations and reference material coherent
Start with editing and review needs rather than copying a visible framework from an example. Marketing explanations, plan information, definitions, integration records, documentation and help articles may belong in different systems. Agree on the relationships and navigation between them before choosing tools. Each destination should retain its actual purpose without requiring identical page layouts.
Model reusable product terms and destinations so editors can change one definition or account URL without hunting through decorative sections. Give important claims sources, owners and appropriate review dates. Keep product screenshots, demonstration data and current commercial information separate in the content model so updating one does not silently imply that the others were validated.
Document the actual responsibilities of search, forms, account systems and analytics integrations. Public technology evidence can identify a visible resource or a cited association on a particular page; it cannot establish a complete backend inventory or the suitability of that stack for a different company. Choose the system that supports the actual publishing and implementation work, then test it in context.
Our WordPress website examples offer a separate look at publishing approaches. A visible platform label is evidence for that named page, not a guarantee that the same system will suit your requirements.
Before the public launch
Data analytics company website planning checklist
Name the actual analytical category and the people it serves.
Describe a practical question before selecting dashboard imagery.
Label demonstration data and keep it distinct from customer results.
Provide readable explanations outside small interface screenshots.
Distinguish trial, live-demo, sales and account-access routes.
Explain which process each evaluation action starts.
Define important reporting measures and their relevant limits.
Keep installation material, API reference and account help distinguishable.
Offer search for known problems and a starting route for beginners.
Make service status and operational notices easy to identify.
Have responsible reviewers approve data-handling and policy claims.
Explain older brand and support destinations when products change.
Assign owners to screenshots, plans, help categories and integration links.
Test complete navigation, form, support and documentation journeys.
These checks are a project checklist, not a performance, legal, security, or accessibility certification. Test real journeys with the people responsible for the website before making claims about the result.
Sources & editorial method
How this collection was selected and reviewed
This collection contains exactly12 distinct public website examples, matching the original random target saved before research. Every accepted image was independently inspected. Reused original direct screenshots retain their exact bytes, source identity and original capture dates; new direct screenshots retain actual UTC timestamps and browser-only crop records. Current official source observations establish topic fit without turning older images into fresh captures. Reviews are original industry-specific editorial analysis of the visible communication, including conditional tradeoffs; illustrations and vendor claims are not independently tested product outcomes. Simple Analytics is the explicitly researched Editors Choice for the stated website-design reasons, not a vote-derived or measured ranking. Unknown technologies remain unlisted until supported by a scoped dated observation. External imagery and trademarks belong to their respective owners.
Each example links to its actual source page. Screenshots are direct browser captures with their own capture dates; moving imagery, announcements and live designs can change. The notes describe observable design choices and conditional tradeoffs, not measured traffic, conversion results, service quality, or accessibility conformance.
Technology labels use public page metadata, asset evidence, or explicitly cited platform documentation. Platform documentation is not a complete current deployment audit. A component reference may be legacy or unused; it is not a complete backend inventory. Unknown stacks are omitted. These sites are editorial examples, not our client portfolio.
Written, Edited and Curated are separate editorial records, not timestamps advanced by a rebuild. Website designs and imagery belong to their owners. See our editorial standards or suggest a correction.
Questions worth asking
Data Analytics Company website design questions
Should an analytics company put a dashboard in the hero?
Only if it helps explain a concrete task. A recognisable chart can introduce the category, but tiny unexplained numbers are weak communication. Show a focused example, label demonstration data and explain the question being investigated. Keep readable supporting copy available when the interface cannot be understood at a small size.
Do analytics products all need the same navigation?
No. A focused traffic-reporting tool, a business-intelligence platform and an observability suite serve different audiences and tasks. The navigation should reflect the real offer. What they share is the need to distinguish evaluation, implementation, account access and help instead of asking every visitor to follow one commercial journey.
Why include documentation and support pages in this collection?
They are part of how an analytics company explains and supports its product. A platform matrix, a search-first help centre or a getting-started route can provide useful design lessons that a marketing hero does not. Each captured page is labelled precisely so a resource view is not presented as a homepage.
Can a privacy headline establish that an installation needs no consent?
No. This collection does not make legal or configuration findings. A supplier’s positioning needs its own current technical and policy review, and a customer’s full website may contain other systems. Make relevant information easy to find and have the responsible reviewers approve statements before publication.
Does a polished analytical preview prove the product produces better results?
No. It shows how the product is presented. Demonstration charts, customer marks and proposed actions are not independent evidence of data quality, causation or a result in another environment. Product evaluation and organisational decisions require their own appropriately scoped evidence.
Borrow the clarity of a useful example, not the numbers or promises inside it. Build the website around a specific analytical task, honest evaluation routes and information that the people implementing and using the product can actually investigate.