Best Mapbox Websites of 2026 (20 Real-World Examples)
Twenty real public websites and map interfaces, with original reviews, direct screenshots and carefully scoped evidence for their mapping relationships.
A useful map helps someone make a decision. These examples show how address search, text results, geographic layers and supporting explanations work together—and where a beautiful canvas is not enough.
The collection opens with the FCC, UNHCR, Getaways by Southwest, T-Mobile and Tripadvisor, then examines store locators, community resources, research visualizations, accommodation discovery and public product demonstrations. Some captures show the working map; others show the public entrance to the documented mapping experience. Each review says which state it covers. That difference is more useful than pretending every screenshot reveals a complete application.
Mapbox customer implementation stories and Strava's own map documentation provide primary evidence for the named relationships. They do not establish that every current page uses the same API, that every source is current, or that a map's underlying data is correct. WCK's December 2021 response report is explicitly historical. StoreRocket is one real vendor demonstration with labeled example data, not a collection of fictional customer businesses. No account, reservation, payment, personal location permission or private operations tool was accessed.
Before the examples
What makes good Mapbox website development in 2026?
Begin with the decision, not the basemap
A store finder, a research visualization and a trip planner need different controls and defaults. Mapbox GL JS provides browser rendering, geographic sources and layers; it does not decide which information your visitors need first. Write the starting task, useful result and recovery state before choosing a visual style. Then determine which geography is essential and which information belongs in ordinary text.
A visitor should not have to drag a map successfully to find a branch or understand a result. Give search a clear label and keep selected locations synchronized with a readable list. Mapbox demonstrates placing a geocoder control outside the map; the wider interface still needs keyboard behavior, meaningful errors and a practical alternative when rendering fails.
Separate public rendering credentials from private capabilities
Mapbox distinguishes public client tokens from secret server tokens and documents scopes and URL restrictions. Use only the permissions required for the actual application. A public map does not justify exposing administrative credentials, private datasets or unrestricted write capabilities in its scripts. Include credential ownership and usage review in the handoff rather than treating them as a one-time developer detail.
Compare the task and information hierarchy, not just the style of the tiles. Notice what happens before a location is selected, whether a list exists, how date and layer context are explained, and which claims remain outside what a public screenshot can establish.
We start with five recognizable brands or organizations: FCC National Broadband Map, UNHCR Operational Data Portal, Getaways by Southwest, T-Mobile coverage map, Tripadvisor. Each attribution applies to the named website property, not every product or website belonging to its organization. This is a curated reading sequence, not a measured ranking.
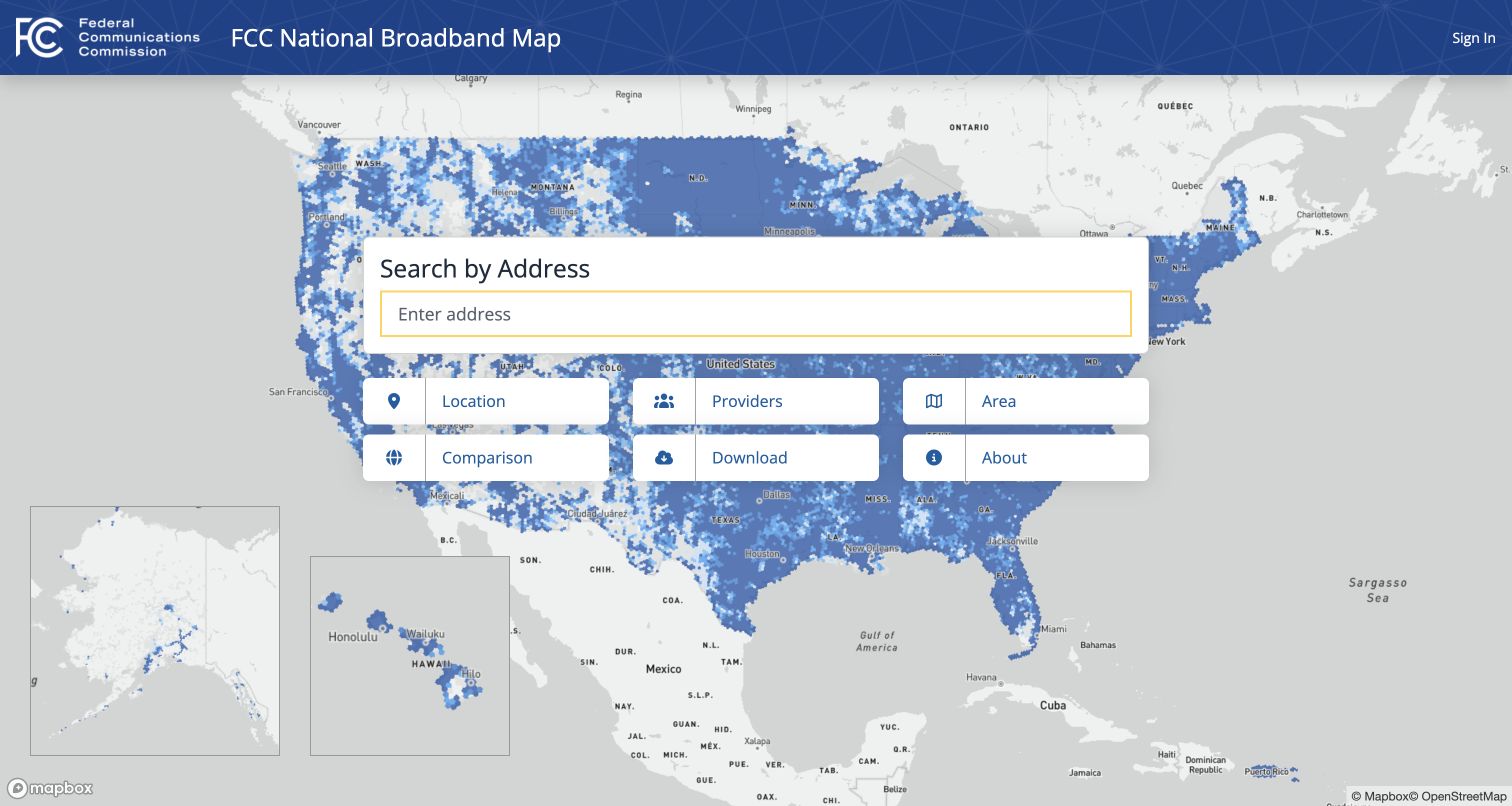
The FCC National Broadband Map opens with a nationwide coverage background and a centered address-search panel. Location, provider, area, comparison and download routes are presented as distinct tasks rather than an undifferentiated dashboard. The government identity remains visible without occupying the whole viewport. A visitor can start with a familiar address or choose a more analytical route. The underlying dots establish that this is a geographic data service, while the white panel provides a stable place to begin. It is a useful example of keeping a complex public dataset approachable at the entrance.
What you can learn
Start with the decision a visitor needs to make, then expose increasingly specialized tools. Keep provider-reported coverage, actual service availability and eligibility separate. Mapbox's FCC case is an implementation reference, not independent validation of any particular household's connection or the dataset's accuracy.
Pros
The central address panel gives a national map an obvious starting action.
Research and download tasks are separate, plainly labeled navigation choices.
Cons & considerations
A dense national overview needs a meaningful non-map alternative for accessibility.
Coverage colors require accompanying definitions and timely data-source explanations.
Visible tech stack
Earlier / documented evidence
Mapbox
Platform source: Mapbox customer implementation record. Public broadband-data map, explicitly named in the official implementation record; no household-level availability or data-accuracy claim is made. Platform evidence is separate from the direct website screenshot and is not a complete current infrastructure audit.
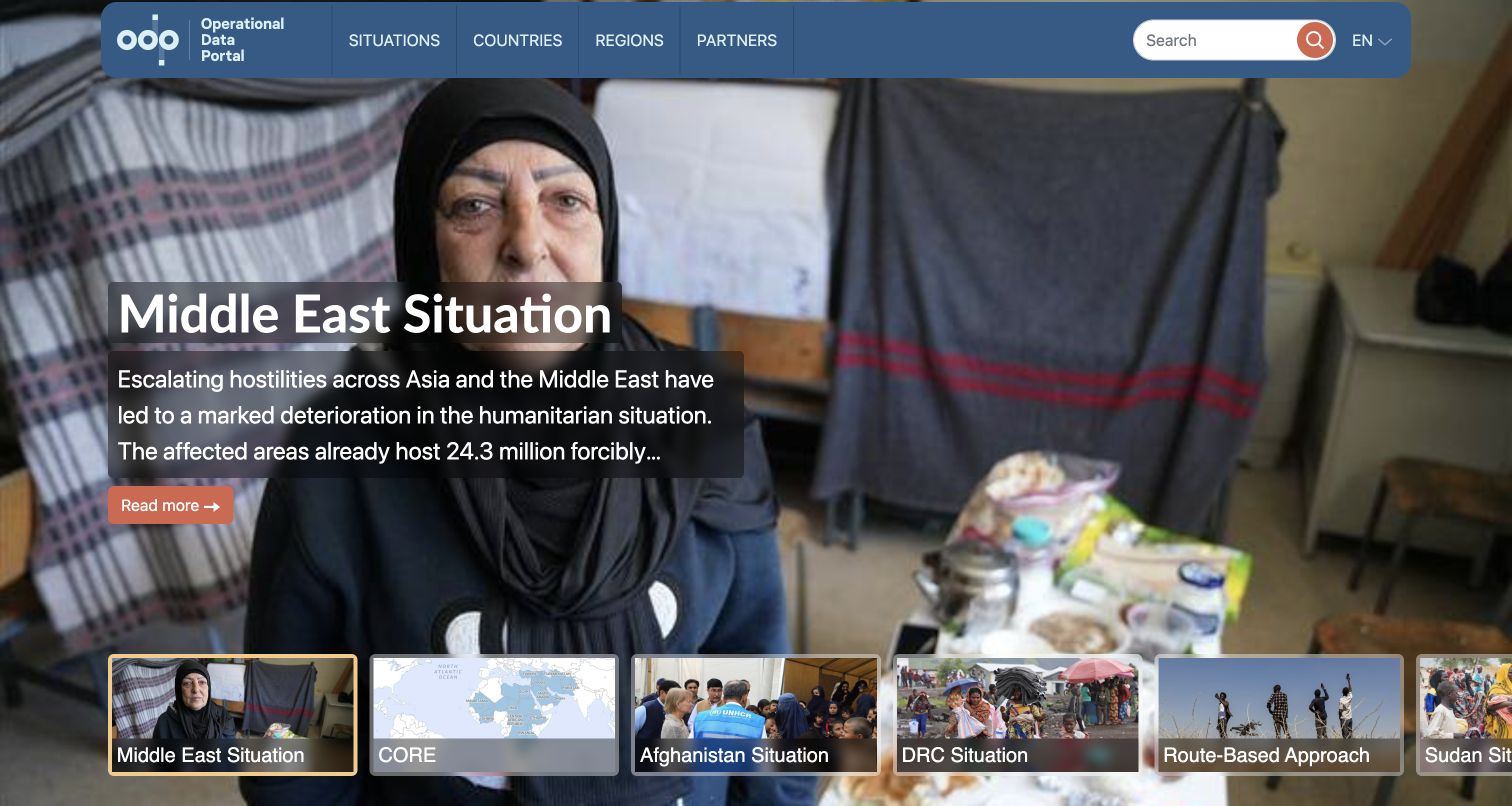
UNHCR's Operational Data Portal leads with a large situation photograph, a short contextual statement and a strip of other response topics. The compact blue header provides separate routes into situations, countries, regions and partners. Search is available without competing with the main story. This screenshot is the portal's public entrance rather than a country-level map, an important distinction when studying its design. The initial view connects the information system to the people it concerns before asking a researcher to choose a location or dataset. Multiple entry points support visitors who know different pieces of the same situation.
What you can learn
Build a stable taxonomy around the ways people actually seek humanitarian information. Mapbox's implementation story specifically identifies this portal and its geographic visualizations. Preserve source dates, boundary standards and contextual explanations when moving from the editorial entrance into a map; a visual layer should not erase those qualifications.
Pros
Situations and geographic routes support different research starting points.
A concise contextual lead gives otherwise technical information a human frame.
Cons & considerations
Large photography delays the first directly actionable dataset on smaller screens.
Rotating situations need pause controls and stable links to previous context.
Platform source: Mapbox customer implementation record. The official case specifically identifies the Operational Data Portal and its Mapbox geographic visualizations. The capture shows the public portal entrance, not every downstream country map. Platform evidence is separate from the direct website screenshot and is not a complete current infrastructure audit.
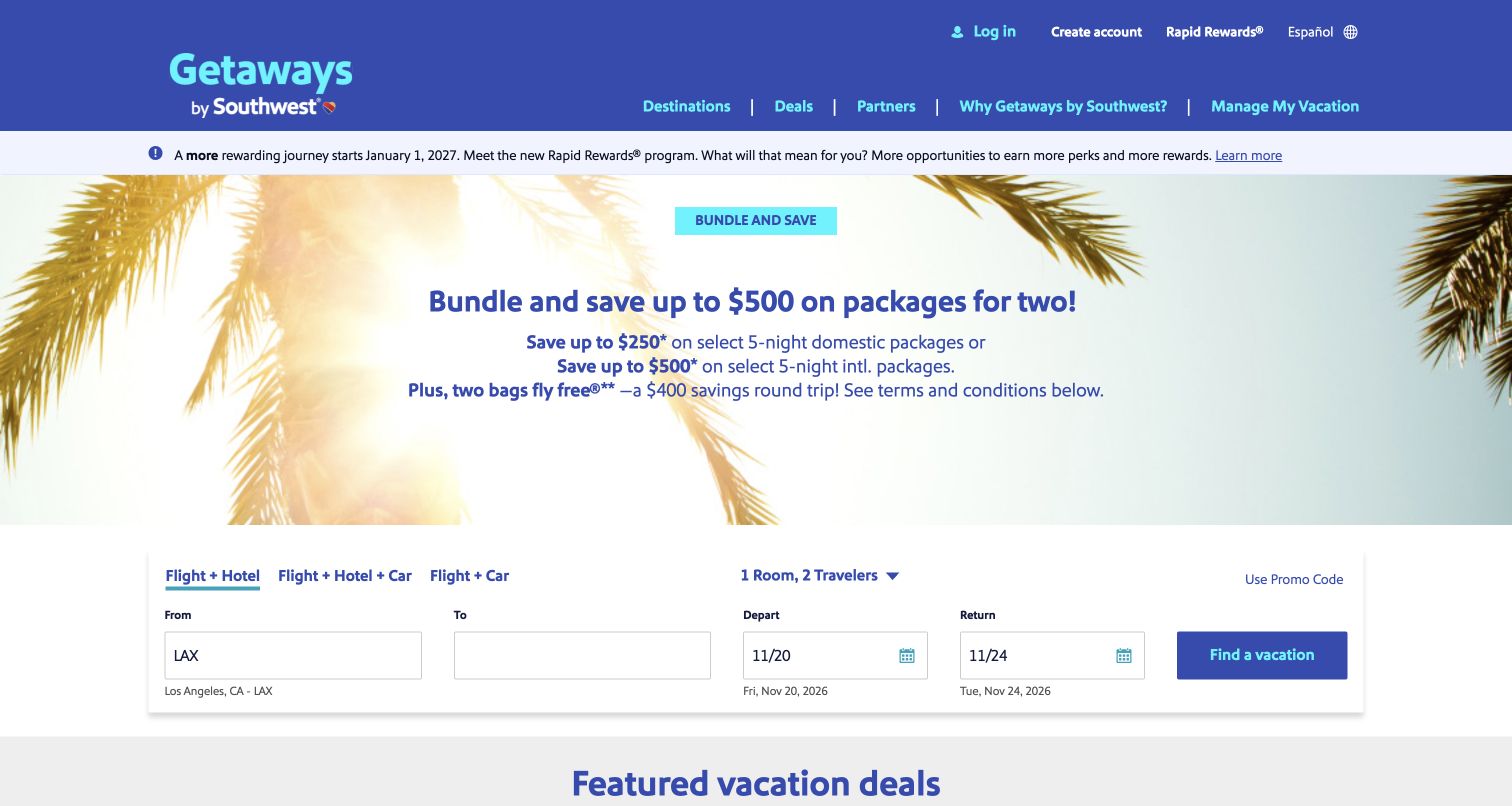
Getaways by Southwest places a compact package form under a large destination image and a clearly bounded promotional offer. Tabs separate flight-and-hotel, car-inclusive and flight-and-car combinations. Origin, destination and date controls share the same white surface, while existing vacation management has its own header route. The captured page is the public package entrance, not a completed hotel map or a real booking. Promotional conditions appear below the form and featured packages rather than being implied by a decorative badge. The arrangement demonstrates how a complex travel product can introduce its first decision without immediately displaying every supplier and option.
What you can learn
Separate the search entrance from mapped hotel results, quoted availability and the final reservation. Mapbox's Southwest case concerns the documented hotel-map experience. Design every transition so travelers retain their dates and party details, and never present a vendor's published conversion figure as a result measured for your own implementation.
Pros
Package-type tabs group related choices before detailed travel inputs.
Existing-reservation management remains separate from the new-vacation search.
Cons & considerations
Seasonal offer artwork can consume space needed by the booking task.
Package conditions and changing prices require clear explanations beyond the hero.
Platform source: Mapbox customer implementation record. The official case identifies the Getaways by Southwest hotel-map experience. The capture is its public package-search entrance, not a directly inspected hotel-results or booking state. Platform evidence is separate from the direct website screenshot and is not a complete current infrastructure audit.
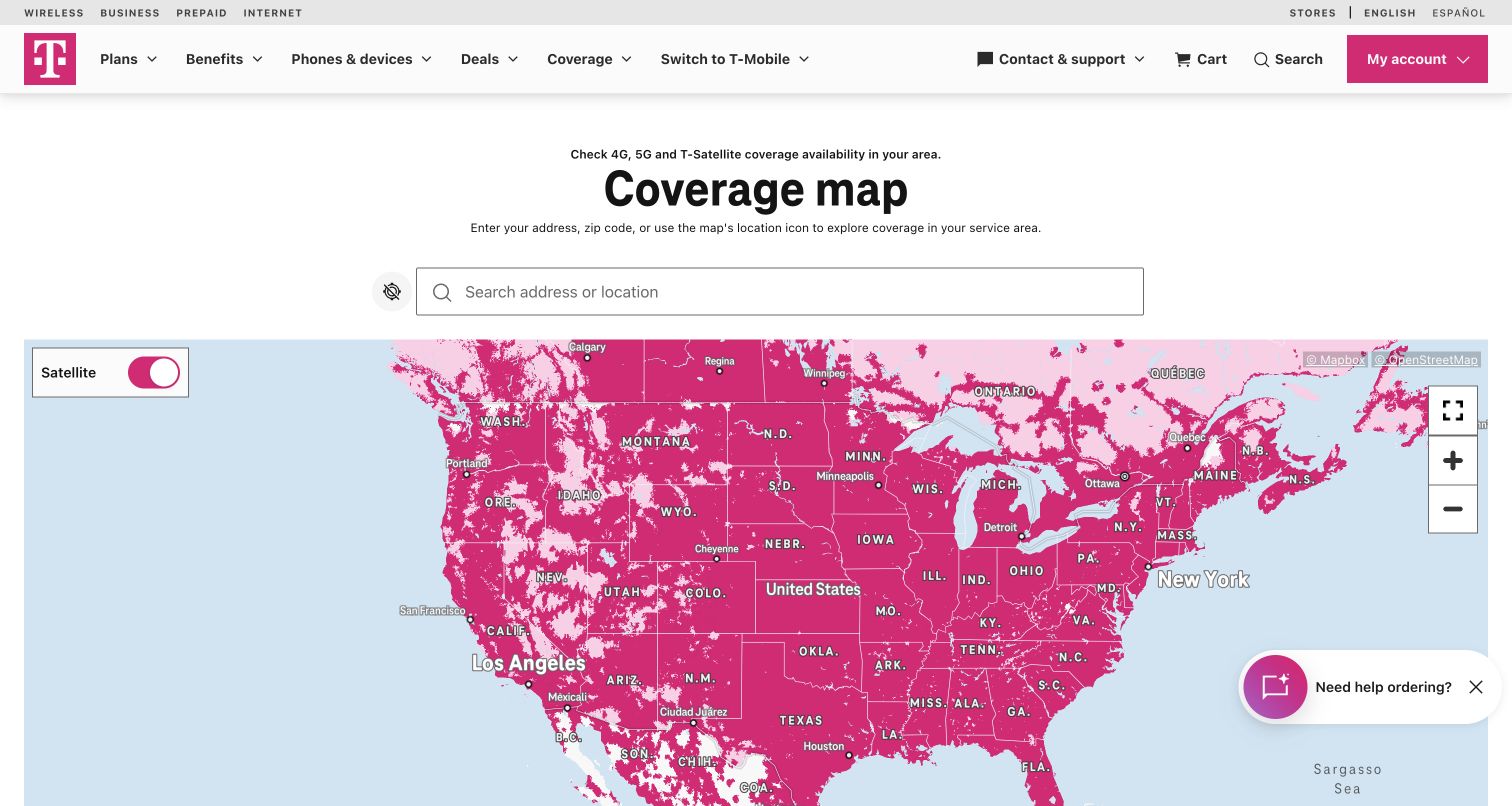
T-Mobile gives its coverage map a clear heading, an address field and familiar zoom, fullscreen and layer controls. The magenta coverage layer retains the brand's visual identity while the surrounding interface explains the purpose of the tool. A visitor can inspect the broad map without first creating an account or granting device-location access. The screenshot records the public nationwide starting view, not a service check at the reader's home. Commercial next steps are present below the tool, but the map and address task occupy the main content area. The distinction between coverage exploration and purchasing is useful to preserve.
What you can learn
Explain each coverage layer before asking it to support a buying decision. Include conditions, technology types and dates, with an accessible location-search alternative. Mapbox's implementation case supports the mapping association; neither that relationship nor this screenshot verifies a particular address's service quality.
Pros
Address search and standard controls are visible within the main task area.
Coverage exploration does not require account creation at the starting screen.
Cons & considerations
Brand colors still need an accessible legend and sufficient layer contrast.
Availability estimates can be mistaken for guaranteed indoor service without clear limits.
Visible tech stack
Earlier / documented evidence
Mapbox
Platform source: Mapbox customer implementation record. The official case specifically describes public T-Mobile coverage mapping; visible Mapbox attribution was also observed on this exact coverage page. Platform evidence is separate from the direct website screenshot and is not a complete current infrastructure audit.
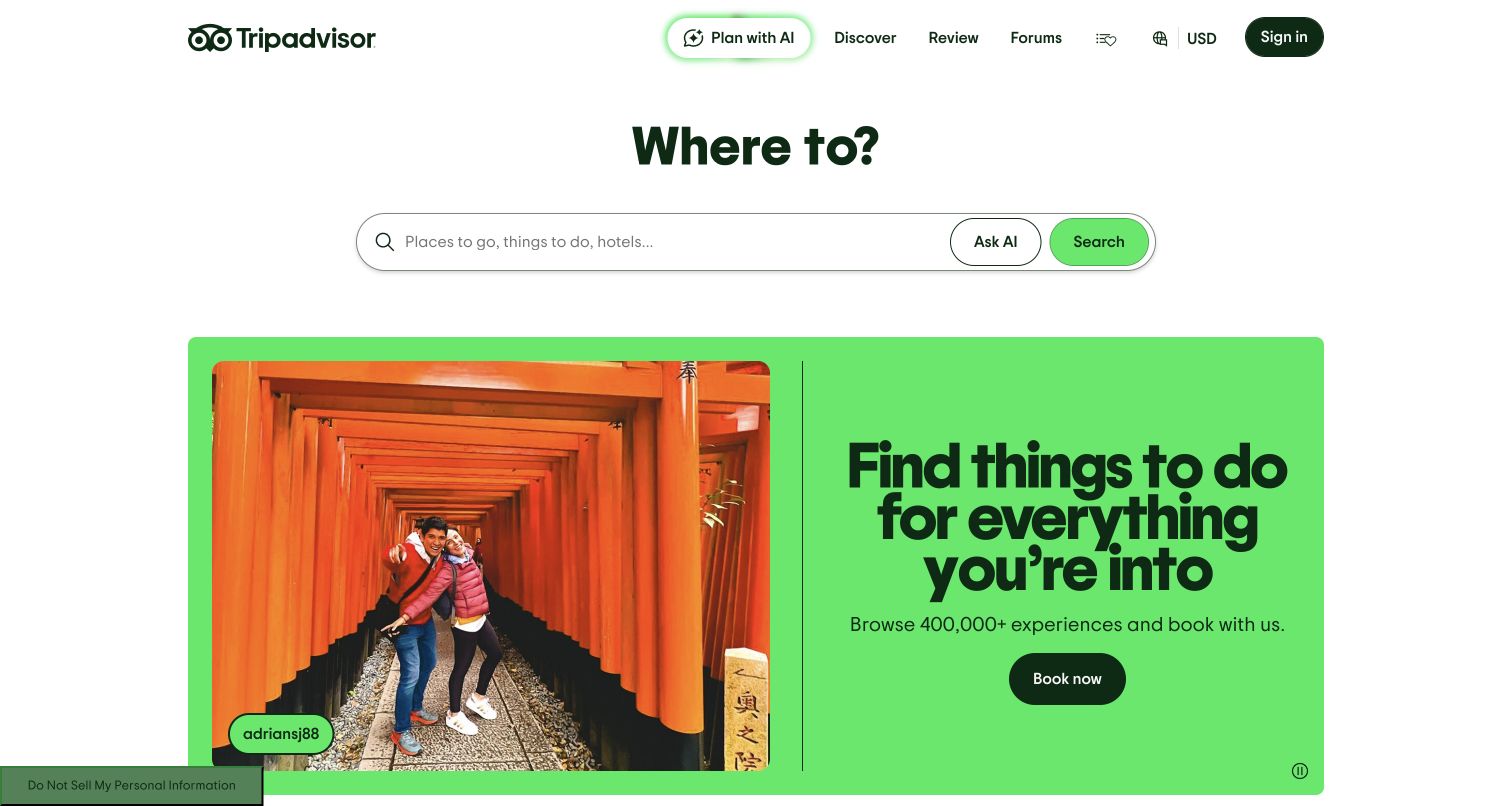
Tripadvisor's public homepage uses a large destination question, a rounded search field and a green action button as its principal starting point. Activity categories and illustrated experience cards follow below. The surrounding header keeps discovery, reviews and saved content within a familiar travel shell. The retained screenshot is this marketing and discovery entrance, not an authenticated itinerary or an independently inspected hotel-map state. That scope matters because Mapbox's case covers the company's broader location experience. The design lesson is the entrance's restraint: it offers one obvious query task before exposing the size of the collection.
What you can learn
Let visitors express a destination or interest before adding the complexity of map layers, filters and saved plans. Keep prices, ratings and availability attached to their own sources and conditions. A documented mapping relationship does not prove that every current homepage widget or personalized recommendation uses the same implementation.
Pros
A prominent search task provides a clear entrance to a large catalog.
Activity-led categories help visitors who have not selected a specific venue.
Cons & considerations
Promotional cards can distract from visitors seeking a particular place.
Review summaries and displayed prices need context rather than visual emphasis alone.
Visible tech stack
Earlier / documented evidence
Mapbox
Platform source: Mapbox customer implementation record. The official case documents Tripadvisor location experiences across web and mobile. This public homepage is a discovery entrance, not direct evidence for every present homepage widget. Platform evidence is separate from the direct website screenshot and is not a complete current infrastructure audit.
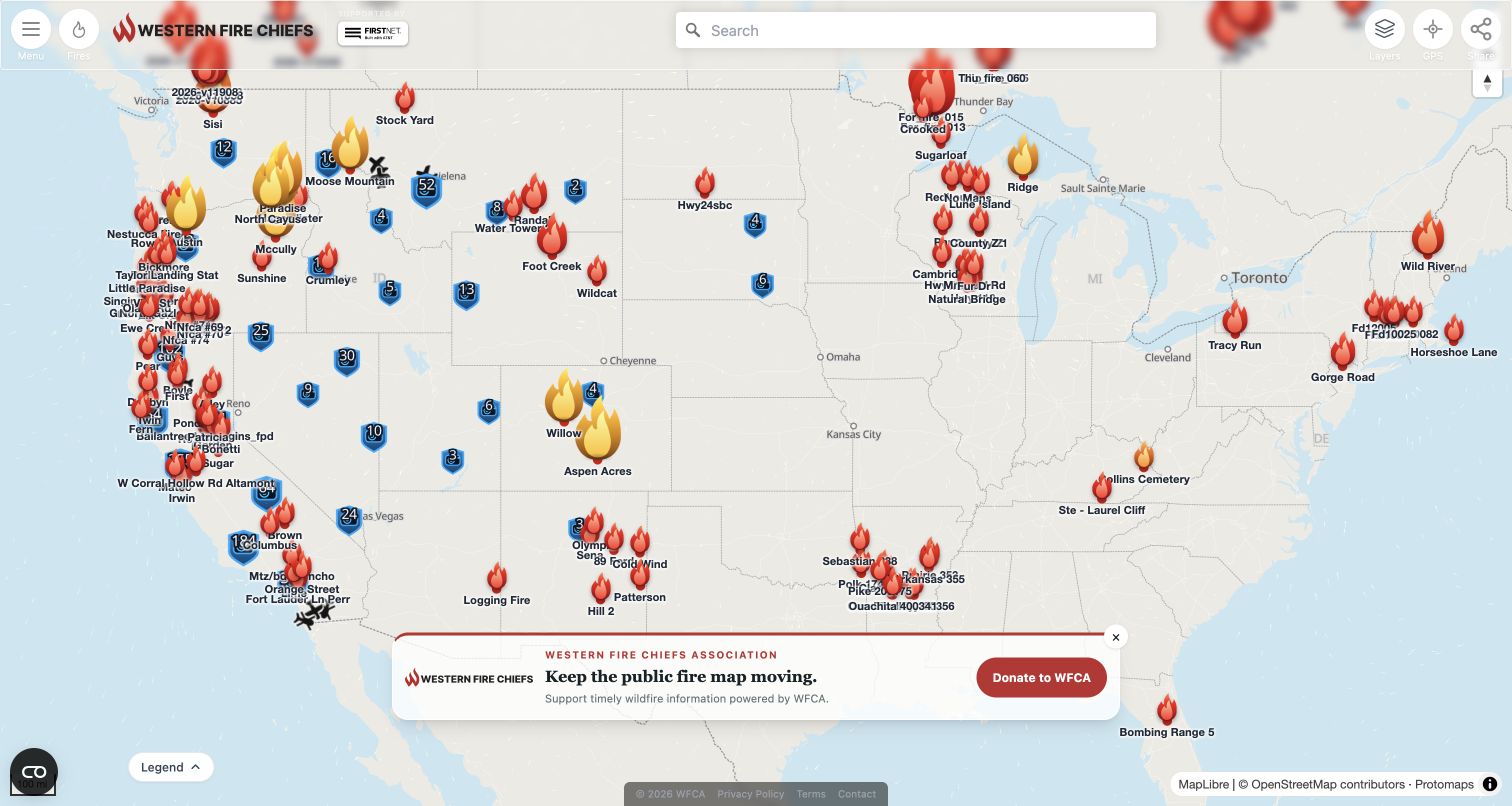
The Western Fire Chiefs Association Fire Map devotes nearly the entire viewport to incident geography. Differentiated markers, a compact search box, map controls and a legend share one working canvas. The title and association identity are deliberately small compared with the information being explored. This creates an immediate, practical tool rather than a long promotional introduction. The captured view is one moment in an updating public service; incident names and symbols should not be treated as a current emergency bulletin when someone encounters the screenshot later. Its strong point is the directness of the geographic interface.
What you can learn
For time-sensitive data, reserve visual space for update times, source definitions and uncertainty, not just more markers. Mapbox's case specifically identifies this public map. Provide a searchable text alternative and direct users to official emergency authorities; an inspiration example cannot establish evacuation advice, incident accuracy or real-time completeness.
Pros
Most of the viewport is dedicated to the geographic task visitors came for.
Distinct markers and a legend provide structure across a crowded map.
Cons & considerations
Dense incidents can overwhelm a nationwide overview before users zoom in.
Safety-related information requires especially clear timestamps and authoritative-source links.
Platform source: Mapbox customer implementation record. The official case identifies the public wildfire map; the documented fire-map address redirects to the captured wfca.com/fire-map page with visible Mapbox attribution. Platform evidence is separate from the direct website screenshot and is not a complete current infrastructure audit.
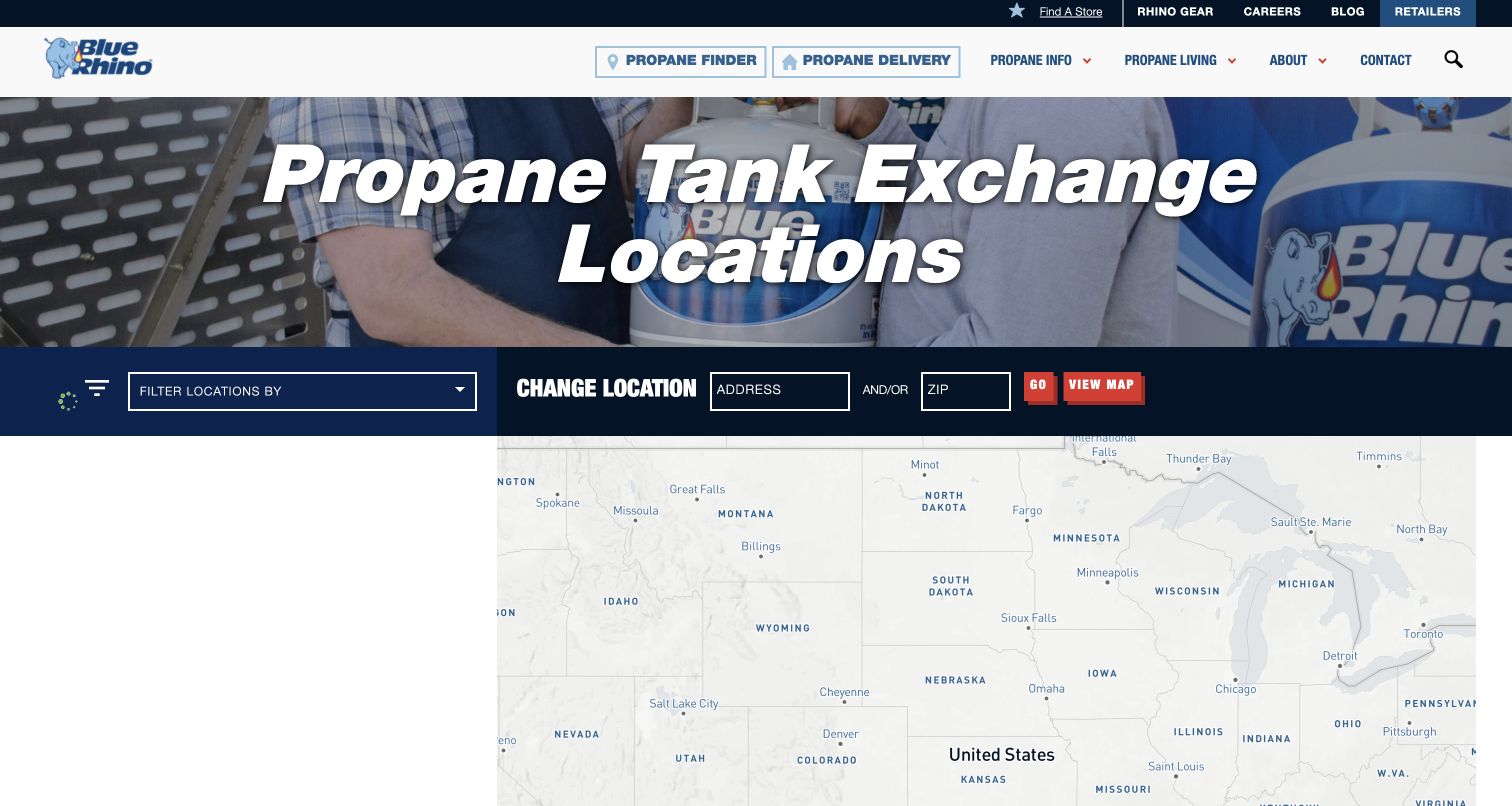
Blue Rhino's propane finder combines a branded photographic heading with a dark filter strip and a map beneath it. Location, retailer type and distance are treated as parts of the same task rather than separate marketing sections. The public interface includes ordinary zoom controls and an option to change location manually. The retained frame is the locator's starting state, not proof that a specific retailer has stock. That distinction is important for products whose inventory and opening hours may change independently of the map. The page provides a useful reference for keeping a utilitarian lookup recognizable as part of the parent brand.
What you can learn
Synchronize the location list, map selection and filters when geolocation is unavailable. Mapbox's Blue Rhino case concerns this locator. Make manual entry a first-class option, and distinguish a listed retailer from confirmed inventory rather than allowing a pin to imply stock availability.
Pros
The locator preserves brand identity without hiding the task.
Distance and retailer filters reflect useful real-world reasons for choosing a location.
Cons & considerations
Several compact fields require clearer labeling and larger targets on phones.
Empty results and unavailable geolocation need helpful recovery rather than a dead map.
Platform source: Mapbox customer implementation record. The official case explicitly identifies the propane-finder web map; Mapbox attribution was directly observed on this exact locator. Platform evidence is separate from the direct website screenshot and is not a complete current infrastructure audit.
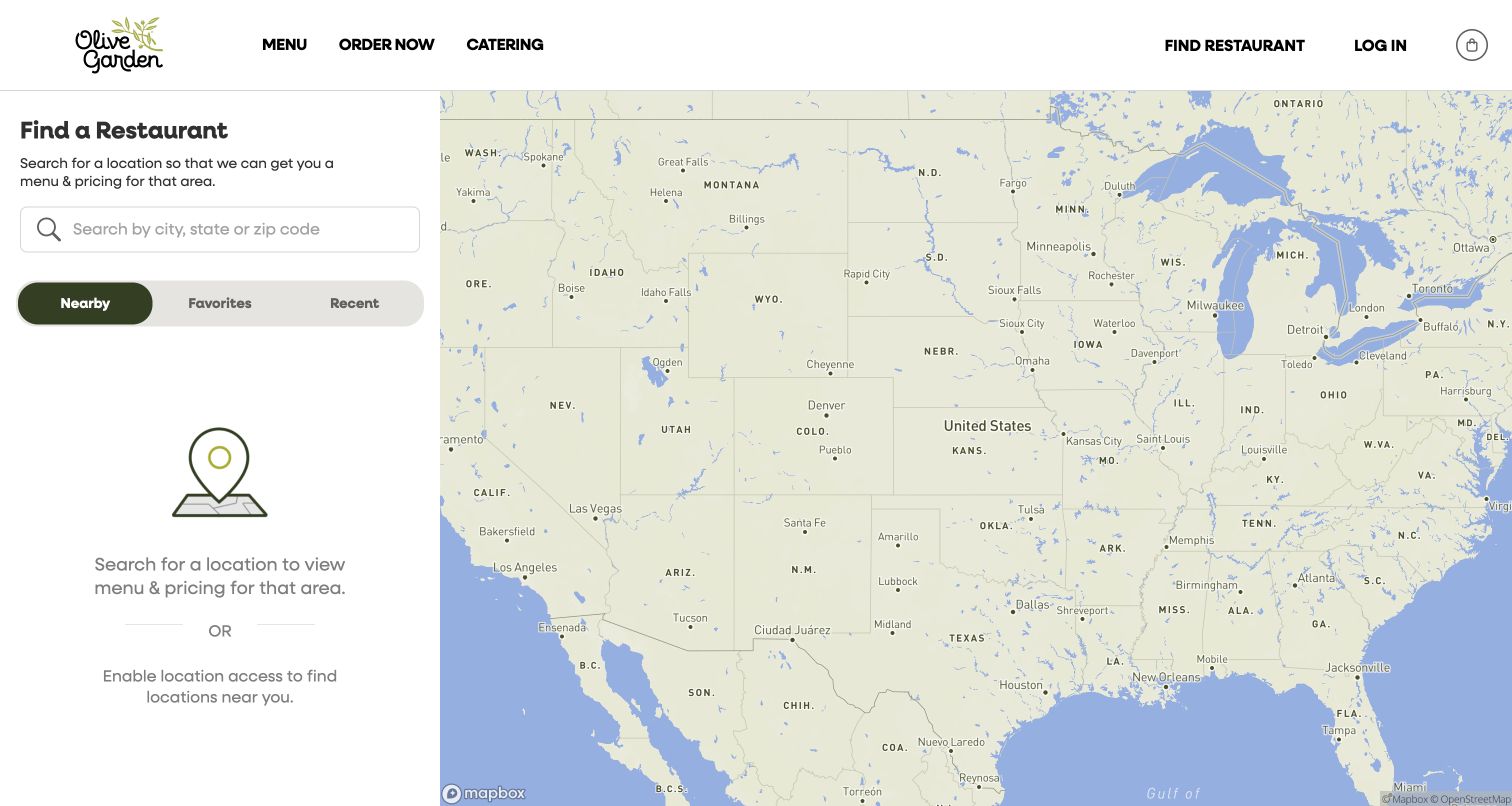
Olive Garden's locator divides the screen into a narrow search-and-results column and a large map. The left side explains why choosing a restaurant matters before asking for a city, state or ZIP code. Nearby, favorites and recent selections are grouped as alternate starting points. In the captured signed-out state, no location has been selected and the page explains that rather than inventing nearby results. The map supplies geographic context without replacing the text search. This is a useful example of designing the initial state of a locator, not only its attractive fully populated result state.
What you can learn
Specify the no-selection, no-results and denied-location states alongside the successful search. Mapbox's Darden case documents Olive Garden's restaurant-finding experience. Treat menus, wait times, availability and pricing as separate restaurant data that can change; the presence of a map does not make every branch-specific claim current or complete.
Pros
The page explains why branch selection is needed for practical restaurant information.
Search and text results have a persistent position beside the map.
Cons & considerations
An empty nationwide map provides limited immediate guidance without a sample route.
Saved and recent options must explain what remains available to signed-out users.
Visible tech stack
Earlier / documented evidence
Mapbox
Platform source: Mapbox customer implementation record. The Darden case explicitly identifies Olive Garden restaurant discovery. The public captured locator is its no-selected-location state, not a claim about live wait times or inventory. Platform evidence is separate from the direct website screenshot and is not a complete current infrastructure audit.
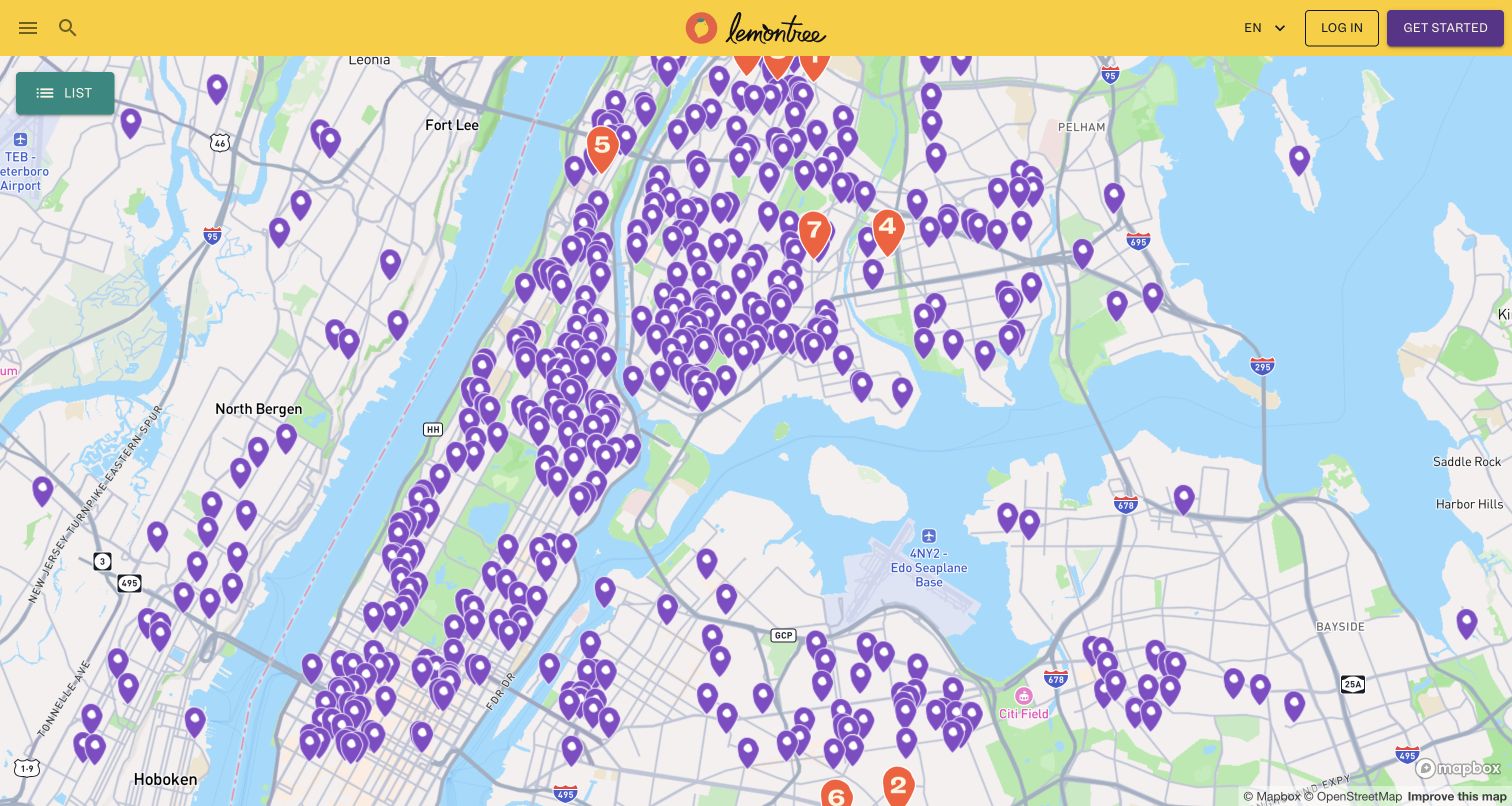
Lemontree's New York City directory pairs a bright, compact header with a map full of resource pins. List and map views provide different ways to browse the same service collection. The inspected page also exposes resource details such as schedules, requirements, directions and contact information, rather than relying on a pin alone. That content is especially important when a visitor is trying to act on the information soon. The page makes the geographic scope explicit, and its yellow identity stays distinct from the neutral basemap. The screenshot represents public discovery, not a request for assistance or an assessment of anyone's eligibility.
What you can learn
Design the resource record before styling the map: hours, requirements, contact details, ownership and last verification need a home. Mapbox's Lemontree case identifies this directory. Keep list access available and corrections easy, without promising a listed pantry will have capacity or supplies when someone arrives.
Pros
List and map modes support both geographic browsing and detail-oriented reading.
Resource records include practical requirements and schedules beyond a location pin.
Cons & considerations
Large clusters need a strategy that keeps individual resources discoverable.
Time-sensitive service details require visible maintenance and correction processes.
Platform source: Mapbox customer implementation record. The official case identifies the foodhelpline.org public resource map, and Mapbox attribution was directly observed in the captured NYC map view. Platform evidence is separate from the direct website screenshot and is not a complete current infrastructure audit.
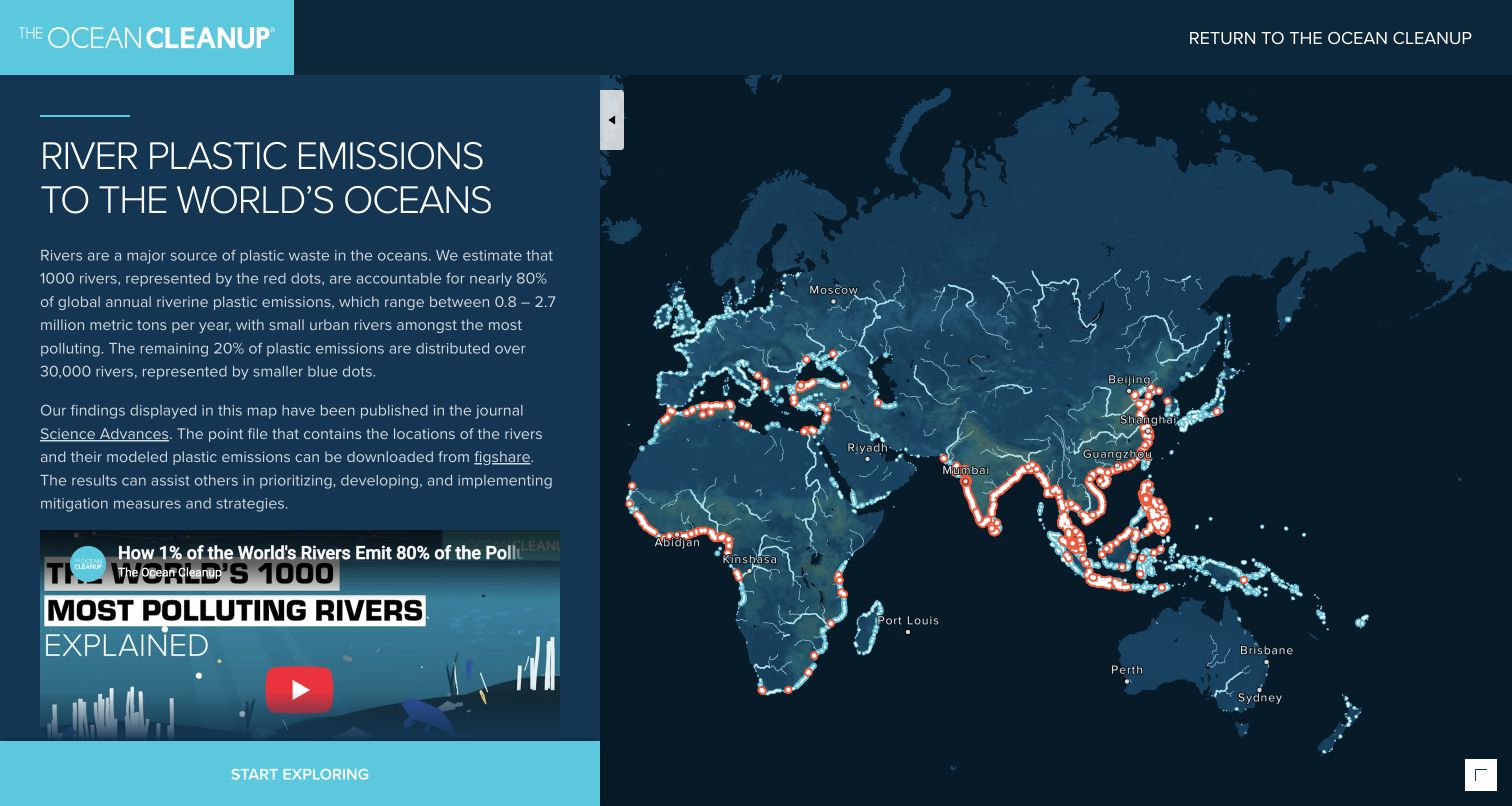
The Ocean Cleanup's river-pollution page places a substantial explanatory panel beside a dark global map. Bright river paths and colored points stand out against the subdued land and water. The text connects the visualization to a published study and a downloadable dataset, so the visual is not presented as an unexplained heat map. A reader can understand the intended meaning before interacting with individual locations. The page is a reference to a particular research model and publication, not a live sensor showing today's plastic emissions. Its strongest design decision is keeping methodological context beside the geographic overview.
What you can learn
Give a map's model, source and limitations a visible place in the interface. Mapbox's case links this named public visualization. Preserve the distinction between modeled estimates and direct observations, and make the accompanying explanation readable without requiring users to decode colors or successfully manipulate a canvas.
Pros
Research and dataset links provide context for interpreting the visual layer.
The dark map creates a clear hierarchy for bright river and location data.
Cons & considerations
A long explanatory panel can compete with map space on narrow displays.
Color alone is insufficient for communicating categories to every reader.
Platform source: Mapbox customer implementation record. The official case links this exact scientific river-sources visualization; the research model is not described as current sensor data. Platform evidence is separate from the direct website screenshot and is not a complete current infrastructure audit.
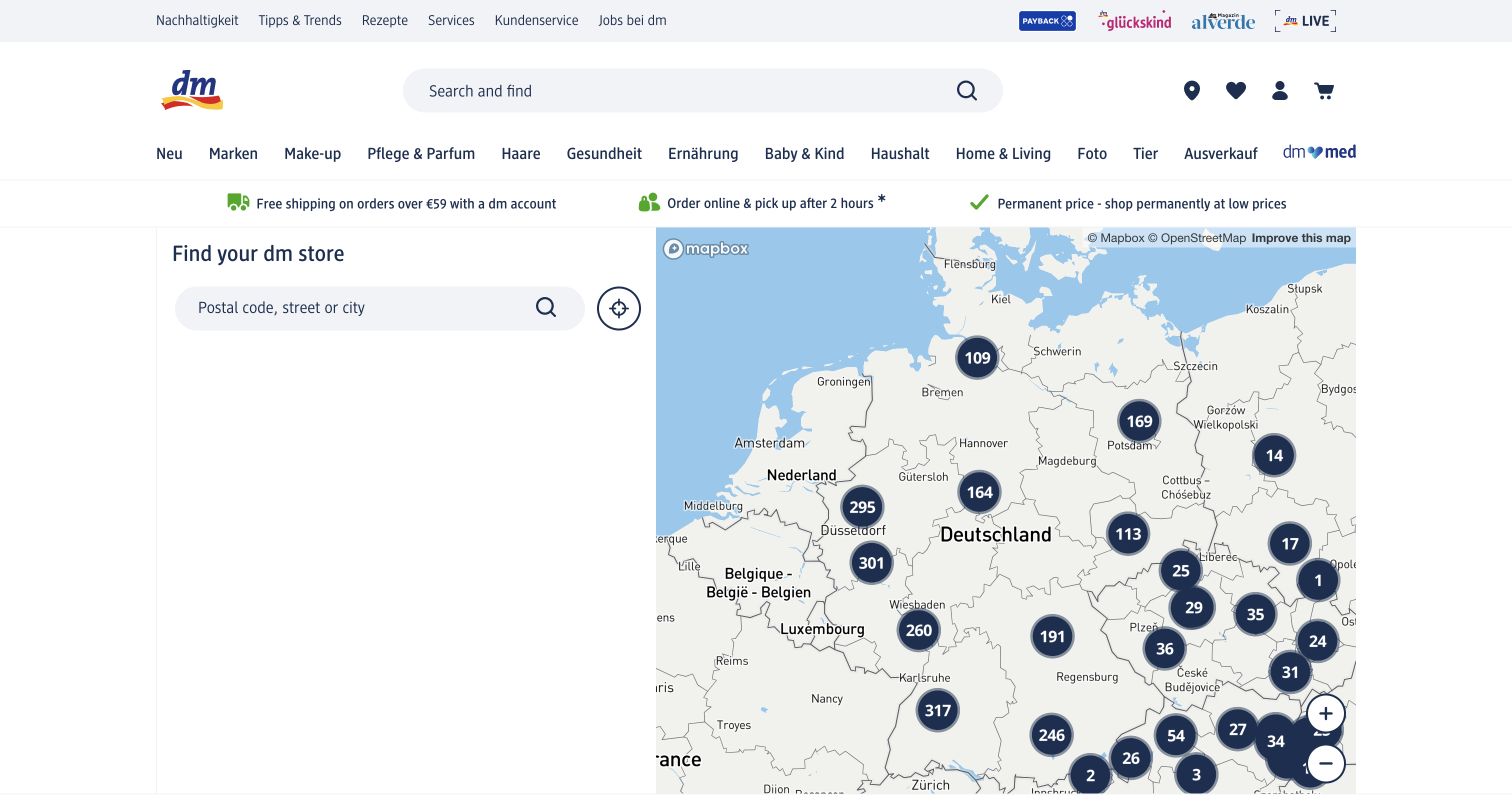
The dm store finder sits inside the retailer's full ecommerce header, preserving search, product categories and account utilities. Within the locator, an address-search panel is paired with a map using clustered store counts. The clusters reduce the initial noise of a dense store network while preserving a clear geographic overview. Regional text routes further down provide another way into the directory. The captured browser rendered portions of the interface in English while retaining German category labels; that is an observed display state, not a claim that every route is fully localized. Store discovery remains a distinct task within the larger shopping system.
What you can learn
Connect each branch record to services, hours and stock-related information. Mapbox's dm case identifies the store finder. Maintain a keyboard-accessible route around the canvas and a useful regional directory when the map cannot load or visitors do not share their location.
Pros
Clustering makes a large store network easier to understand at the starting zoom.
The locator remains integrated with the wider shopping and service navigation.
Cons & considerations
A large retail header reduces the map's usable first-screen height.
Mixed-language states need review across controls, categories and result details.
Platform source: Mapbox customer implementation record. The official case links this exact dm.de/store locator; Mapbox attribution and clustered store counts were directly observed. Platform evidence is separate from the direct website screenshot and is not a complete current infrastructure audit.
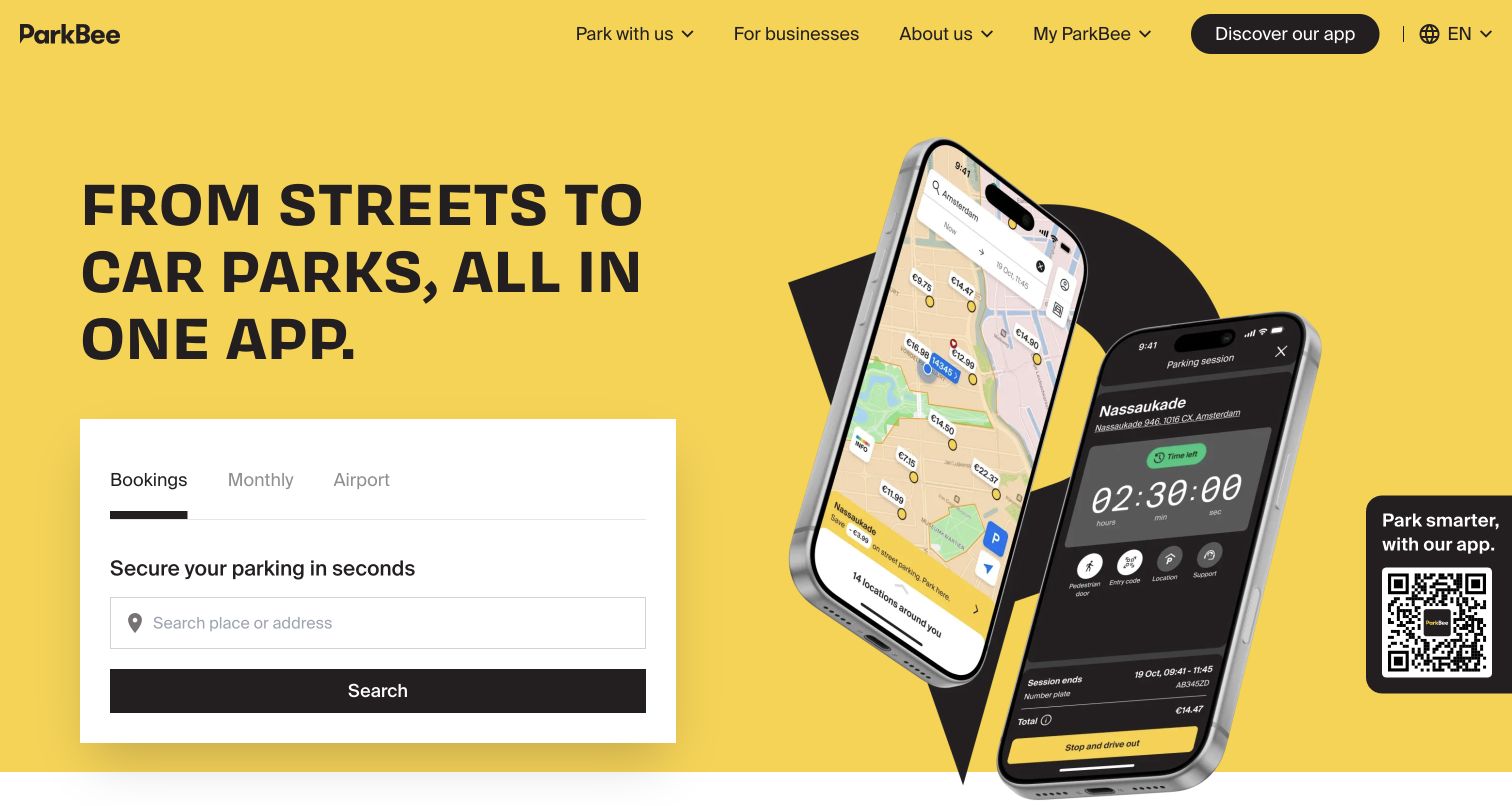
ParkBee uses a vivid yellow hero, a short parking proposition and a compact search panel. Bookings, monthly parking and airport parking are separated near the starting task. Product imagery introduces the app without taking over the whole explanation. The public page is a marketing and search entrance, not a completed reservation or a directly inspected private operations dashboard. Its hierarchy keeps the action approachable before explaining the broader parking network and different ways to use it. The strong color makes the service memorable, while the simple labels reduce the effort needed to identify a relevant route.
What you can learn
Separate searching, understanding access instructions and completing a reservation. Mapbox's ParkBee case documents the platform's mapping work, not the live availability of any parking bay. Keep price conditions, vehicle restrictions and entry instructions attached to the chosen location, and test recovery without making real bookings.
Pros
Parking modes are grouped before visitors need to enter detailed trip information.
The brand color and concise opening create a recognizable service entrance.
Cons & considerations
Phone imagery can imply capabilities that should also be explained in accessible text.
Availability and booking promises need explicit conditions beyond the introductory hero.
Platform source: Mapbox customer implementation record. The official case documents the ParkBee web mapping platform. This capture is the public marketing and search entrance, not a private operations or completed-reservation state. Platform evidence is separate from the direct website screenshot and is not a complete current infrastructure audit.
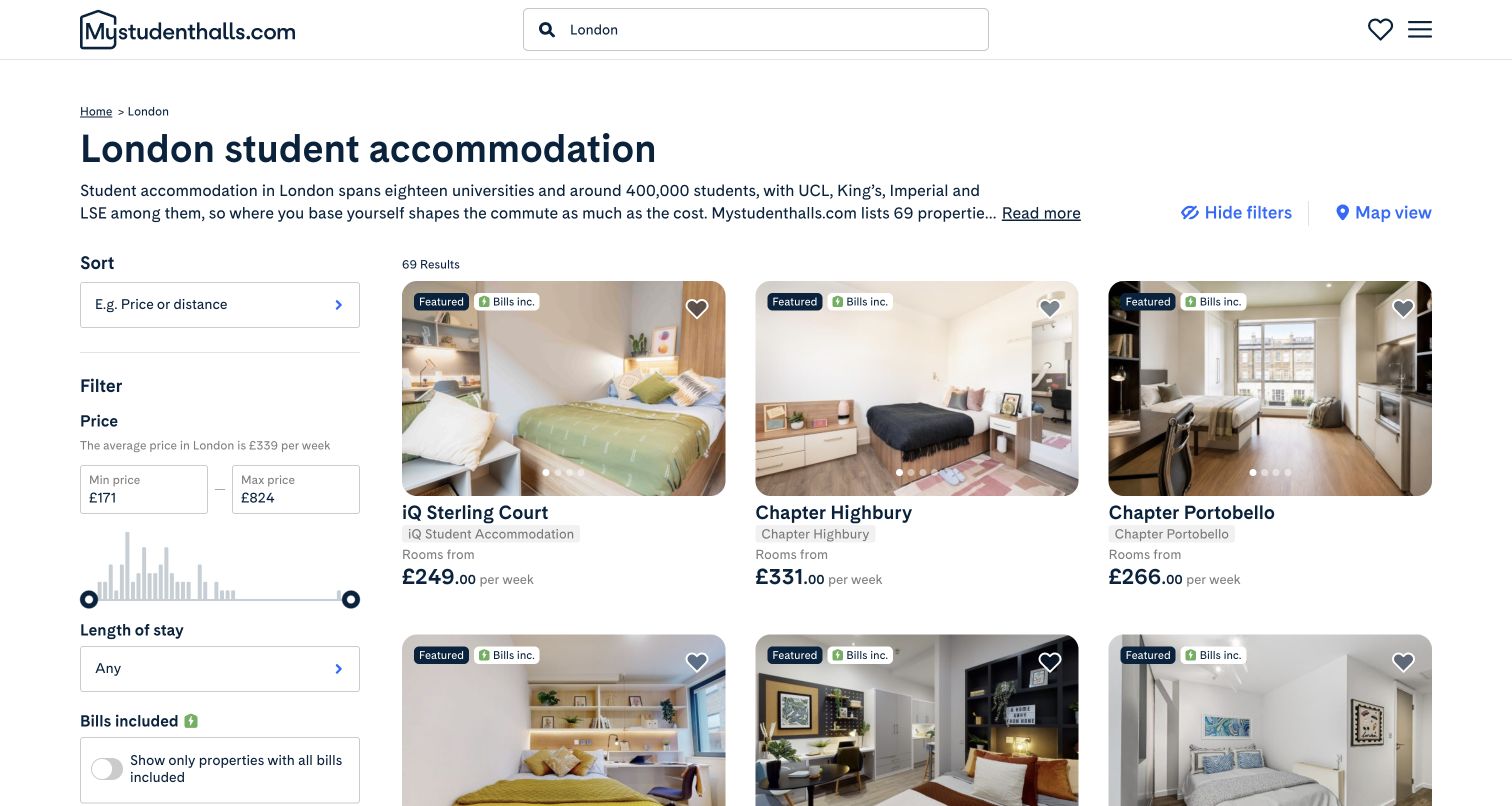
Mystudenthalls' London results page places budget and feature filters beside a regular grid of accommodation cards. Each card combines a real property photograph, a name, a price and a small set of qualifying details. The page also offers a map-view route, letting visitors switch from comparison to geography rather than forcing everyone to begin on a canvas. This capture is the London list state, with the selected city made explicit in the heading. The combination is useful because accommodation choices involve much more than proximity: price, tenancy length, amenities and university context all affect a visitor's shortlist.
What you can learn
Keep map and list modes tied to the same filters and selected property IDs. Mapbox's case documents the website's accommodation-map work. Explain price periods, offer conditions and data freshness separately; a tidy comparison card is not a guarantee of availability, accessibility or suitability for a particular student.
Pros
Regular cards make several properties easier to compare without opening each detail page.
Budget and feature filters reflect decisions beyond simple geographic distance.
Cons & considerations
Long filter lists need sensible disclosure and keyboard-friendly controls on mobile.
Starting prices and promotional tags require clear periods and availability conditions.
Platform source: Mapbox customer implementation record. The official case documents the public accommodation website and map experience. The capture shows its London list-view results and map-view route. Platform evidence is separate from the direct website screenshot and is not a complete current infrastructure audit.
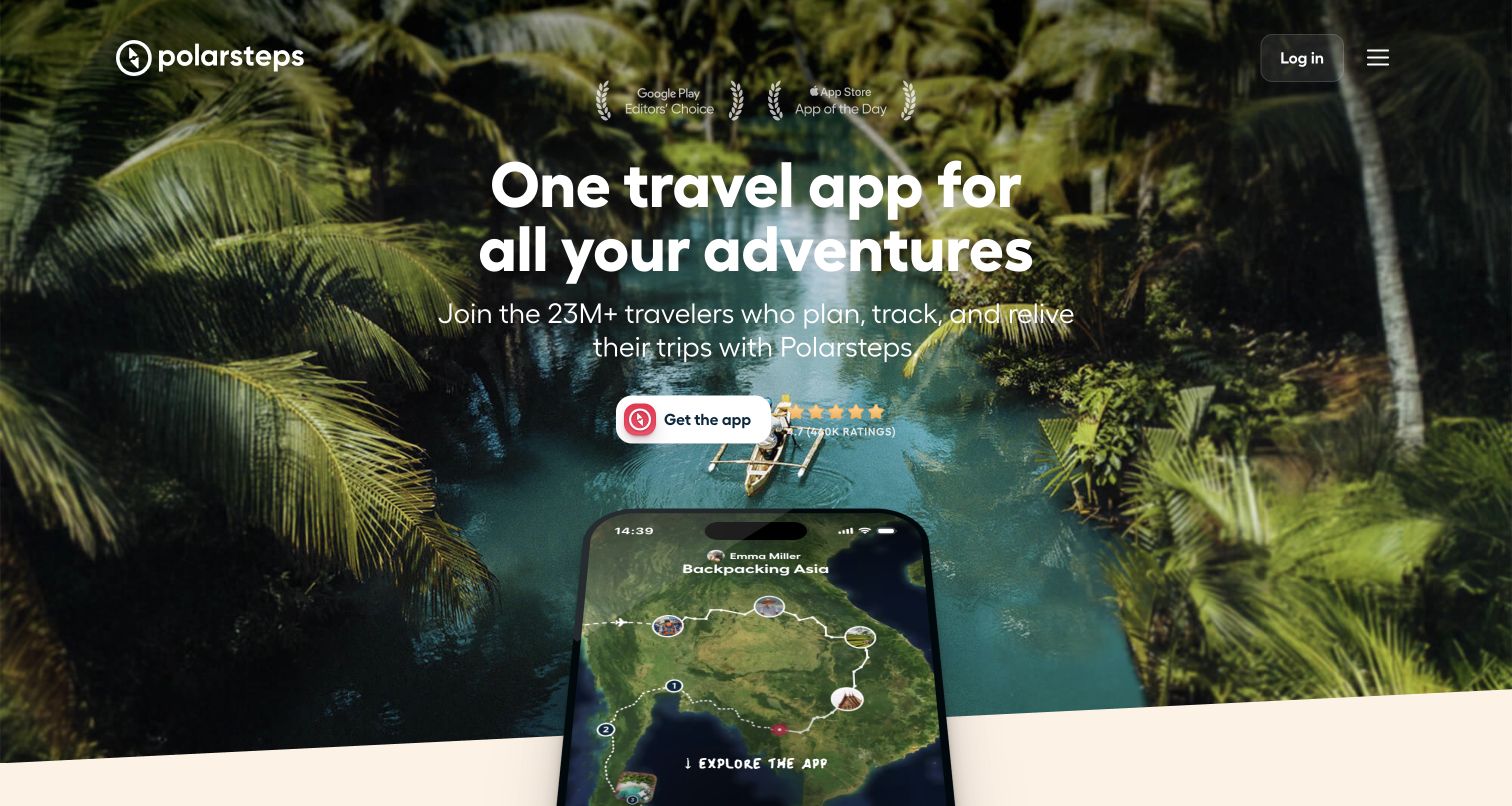
Polarsteps uses a full-width travel photograph, a concise promise and a prominent app action. A phone-like product preview introduces the planning and tracking experience within the scene. The following navigation separates planning, tracking and reliving a trip, giving the product a simple conceptual structure. The retained view is the public product homepage, not a real traveler's private route or location history. That scope is important for a service built around personal journeys. The page demonstrates how to explain a map-based product through an understandable sequence of activities instead of presenting every feature as an equal dashboard tile.
What you can learn
Show how the geographic tool fits the user's workflow, with explicit sharing and privacy boundaries. Mapbox's Polarsteps case includes web mapping. Do not confuse a staged phone preview with proof that someone's itinerary, tracking settings or location data have been independently reviewed.
Pros
Planning, tracking and remembering provide a simple structure for a multifaceted product.
Travel imagery gives the interface an emotional context without replacing the main action.
Cons & considerations
Large motion and imagery require reduced-motion and low-bandwidth alternatives.
Location-sharing products need clearer privacy explanations than a marketing preview can supply.
Platform source: Mapbox customer implementation record. The official case documents Polarsteps web and mobile mapping products. This capture is the public product homepage, not a private travel route or independently reviewed tracking record. Platform evidence is separate from the direct website screenshot and is not a complete current infrastructure audit.
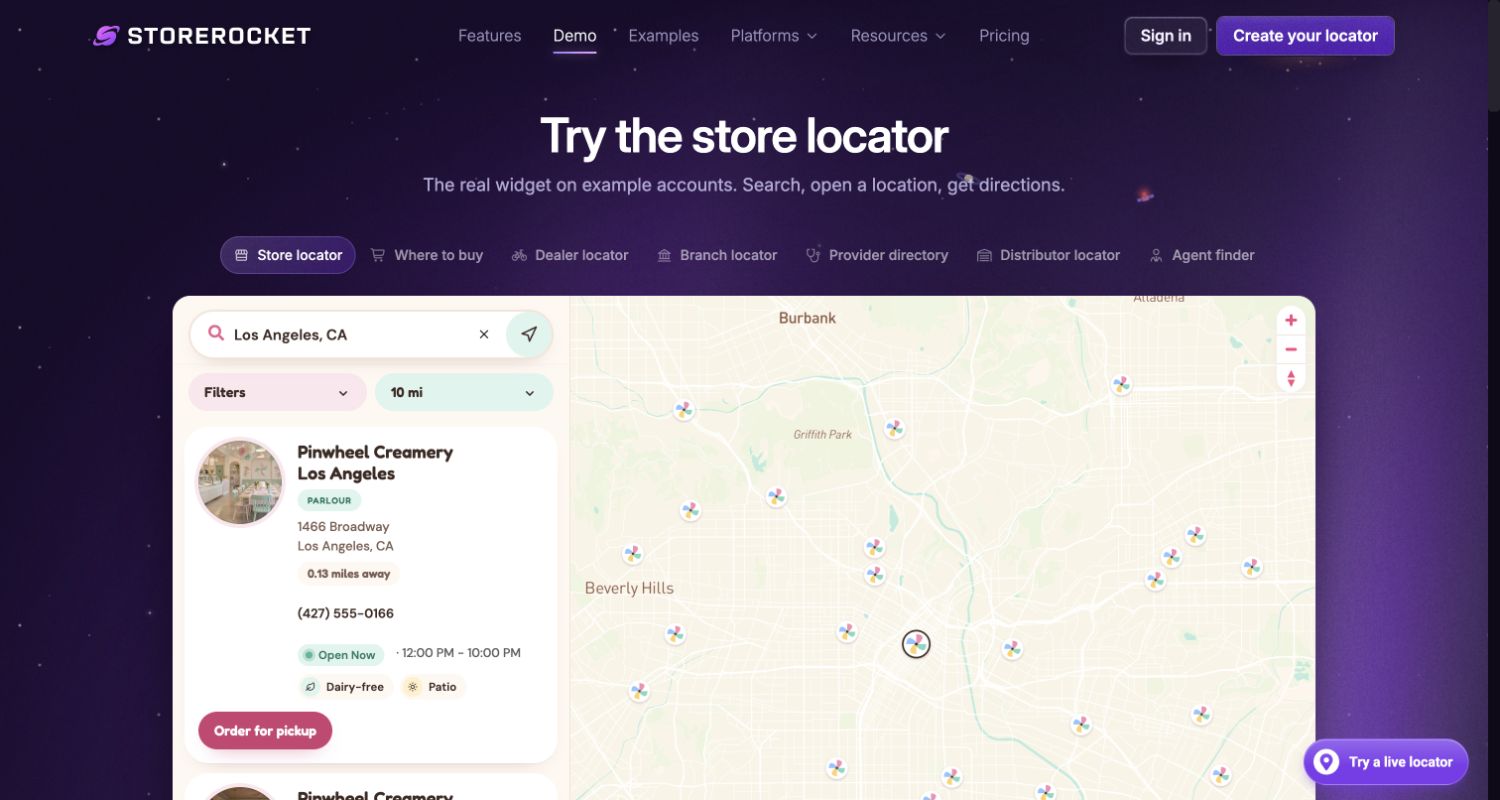
StoreRocket's demo places a working locator beneath a clear heading and a row of use-case tabs. Search, distance, filters, location cards and the map can be evaluated in the same bounded area. The page explicitly labels its example account and data, so the named ice-cream locations should not be mistaken for independently verified client businesses. This is one real product website demonstrating its interface, not several additional customer examples. The purple surrounding shell distinguishes the vendor's explanation from the embedded experience. It is a useful reference for showing prospective buyers the actual interaction model before requiring an account.
What you can learn
Label demonstration data separately from customer claims. Mapbox's StoreRocket case documents the product's map integration. Review synchronization, empty searches and keyboard access within the frame, then verify the real customer's location feed and contact details before using the design in production.
Pros
A public working demo communicates the interaction more clearly than a static feature diagram.
Platform source: Mapbox customer implementation record. The official case documents the StoreRocket locator product. The exact captured public demo is labeled with example data; the example shop chain is not presented as an independently verified customer. Platform evidence is separate from the direct website screenshot and is not a complete current infrastructure audit.
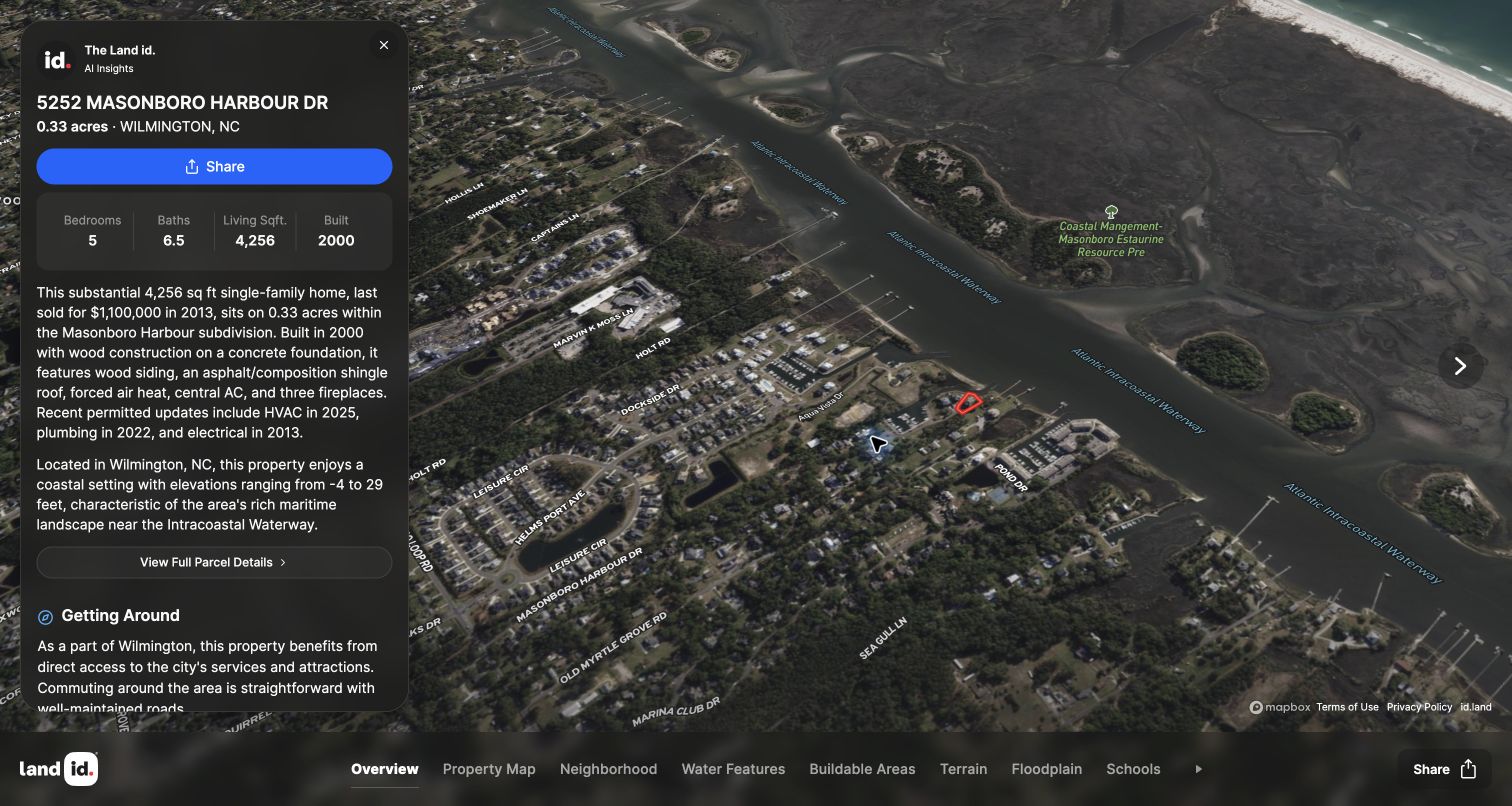
Land id's publicly linked sample tour opens with an aerial map and a structured information card. The selected property is named at the top, while a bottom navigation strip separates overview, property map, neighborhood, water, terrain and other layers. The map remains the central visual object rather than becoming a small supporting thumbnail. This is the company's published sample property, not a private client record obtained for research. Its AI-generated descriptive material and property figures are part of the observed interface, not facts independently verified by this review. The design makes several geographic perspectives available within a consistent presentation shell.
What you can learn
Distinguish parcel boundaries, analysis layers and generated narrative. Mapbox's Land id case and visible attribution support the mapping relationship. Provide provenance and limitations for each layer; a polished visualization cannot replace a survey, title review, flood assessment or professional due diligence.
Pros
Layer navigation gives a complex property presentation a consistent structure.
The information card remains connected to the spatial context it describes.
Cons & considerations
Dense property text can obscure the map on smaller screens.
Generated descriptions and analysis layers need explicit provenance and appropriate professional limits.
Platform source: Mapbox customer implementation record. The official case documents the Land id mapping product, and Mapbox attribution was directly observed on the sample tour linked publicly from its official homepage. No private account was accessed. Platform evidence is separate from the direct website screenshot and is not a complete current infrastructure audit.
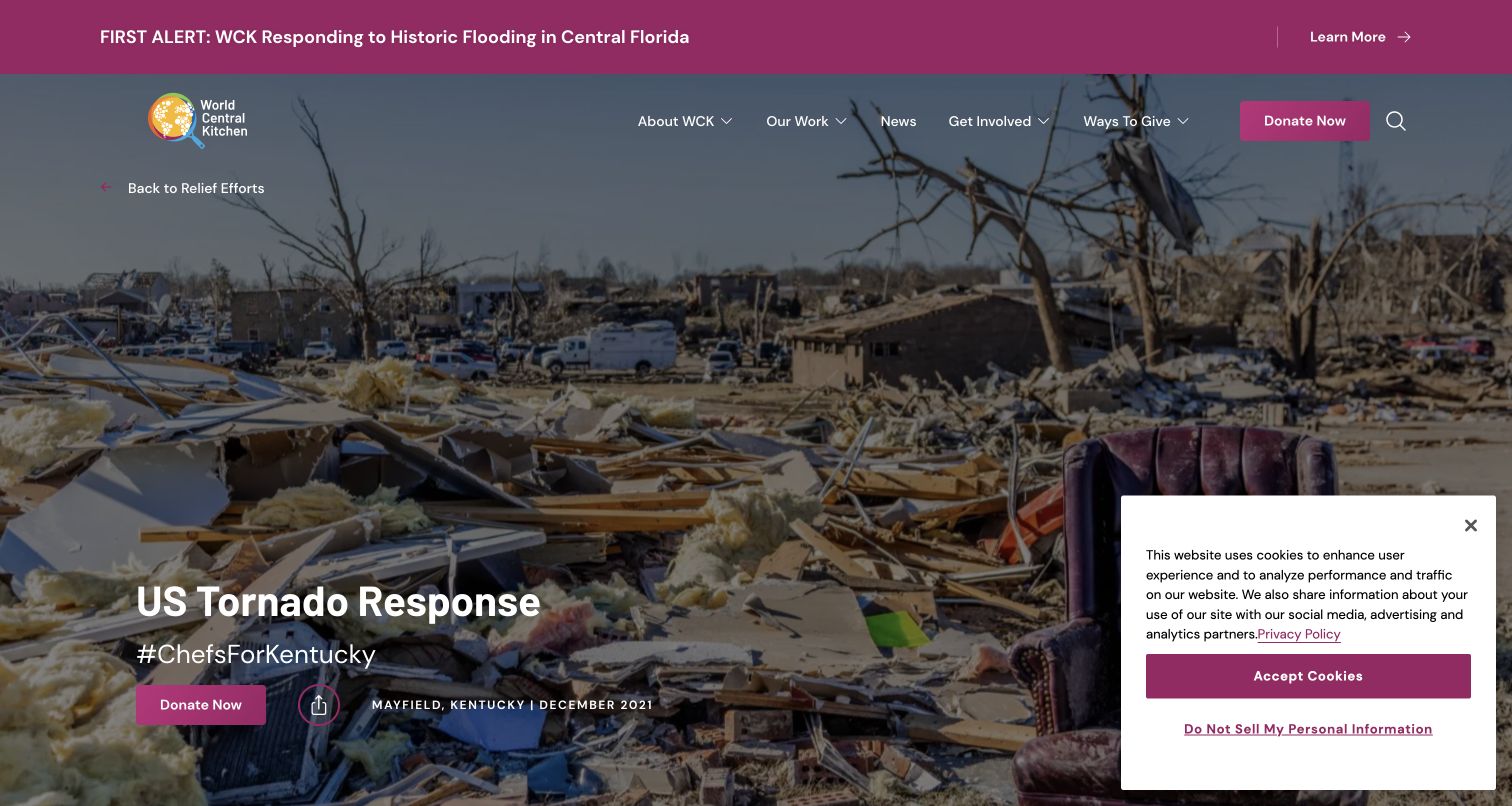
World Central Kitchen's tornado-response page uses a documentary photograph, an explicit relief-effort title and a visible place-and-date context. The page then explains the response and provides a section about where meals were served. It is an archived December 2021 project report, not a current meal-distribution notice. The screenshot records its public editorial entrance rather than an internal logistics application. This distinction makes the example more useful: the design connects geographic evidence with a specific operation and story instead of implying that an attractive map represents all current relief activity. The surrounding navigation preserves routes back to the organization's wider work.
What you can learn
Attach maps to dated operations and explain whether locations are historical, planned or currently active. Keep public reporting and internal logistics distinct, and do not publish sensitive operational information or suggest that an archived location is an available service today.
Pros
Project and date context make the report easier to interpret.
The geographic section is connected to a fuller account of the relief effort.
Cons & considerations
Large documentary imagery delays the practical geographic information below it.
Archived response pages need prominent dates so visitors do not mistake them for live services.
Visible tech stack
Earlier / documented evidence
Mapbox
Platform source: Mapbox customer implementation record. The official case links this exact public relief-map report. It is an explicitly historical December 2021 operation, separate from private logistics tools also discussed in the case. Platform evidence is separate from the direct website screenshot and is not a complete current infrastructure audit.
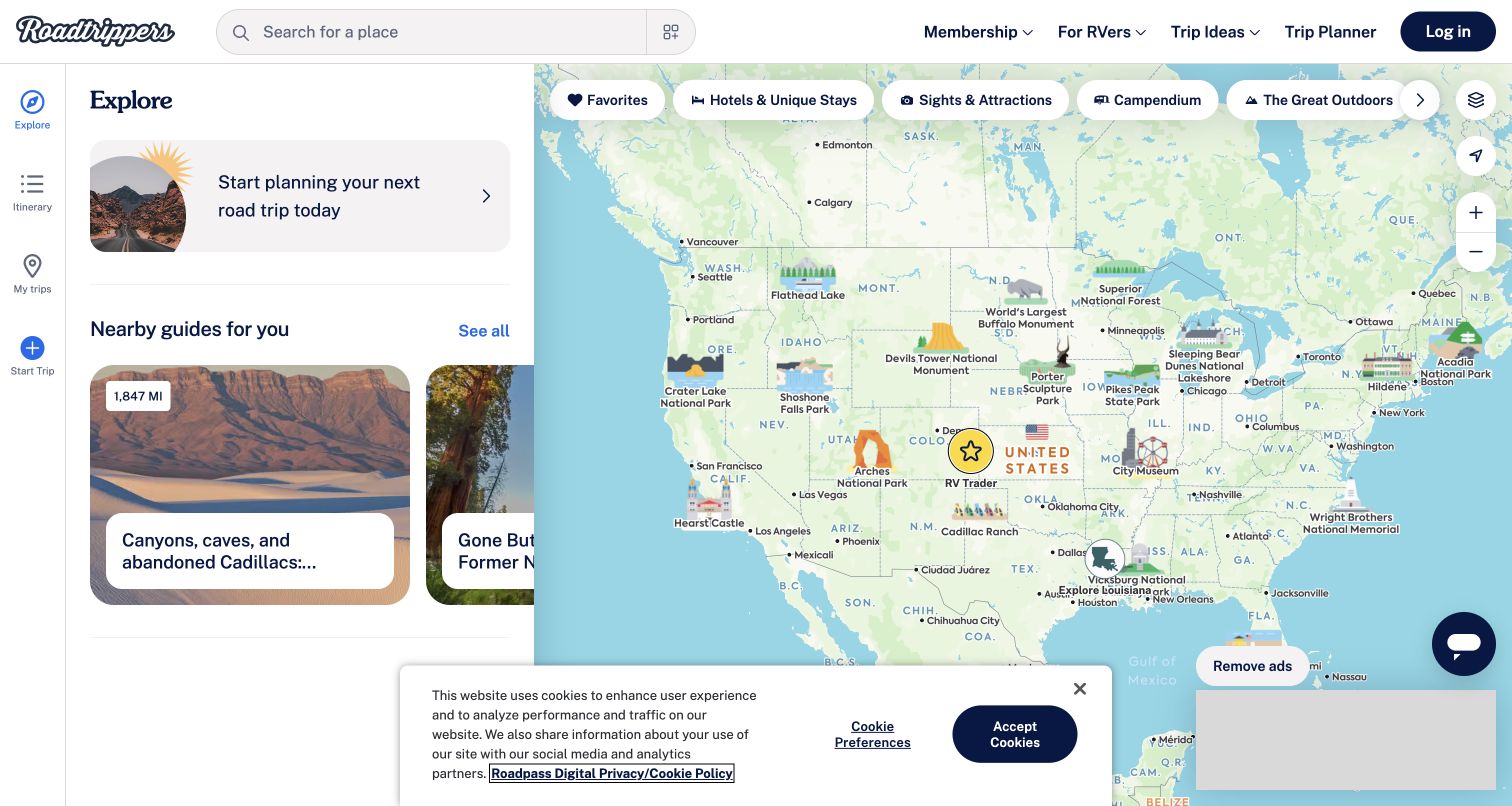
Roadtrippers gives its public map most of the viewport, with a persistent search field and a compact category strip. A side panel introduces suggested trips and a starting action for planning, while the geographic canvas remains visible. Categories such as sights, outdoor stops, restaurants and camping reflect reasons to alter a journey rather than just generic map layers. The captured signed-out view is a discovery state; it is not a saved itinerary or a completed membership purchase. Promotional interruptions are a real consideration in this product, but the underlying task structure offers a useful reference for combining route intent with exploratory browsing.
What you can learn
Distinguish viewing, drafting, saving and paying. Mapbox's Roadtrippers case documents web mapping and routing. Preserve unfinished routes when a login or plan boundary appears, and separate suggested stops from verified opening hours, access restrictions and actual travel conditions.
Pros
A large map and persistent search support exploration without losing geographic context.
Activity categories reflect useful reasons for selecting stops along a journey.
Cons & considerations
Promotions and membership prompts can interrupt an otherwise focused planning task.
Numerous categories require a clear selection state and mobile disclosure strategy.
Visible tech stack
Earlier / documented evidence
Mapbox
Platform source: Mapbox customer implementation record. The official case documents Roadtrippers web mapping and routing products; Mapbox attribution was directly observed on the public map application. Platform evidence is separate from the direct website screenshot and is not a complete current infrastructure audit.
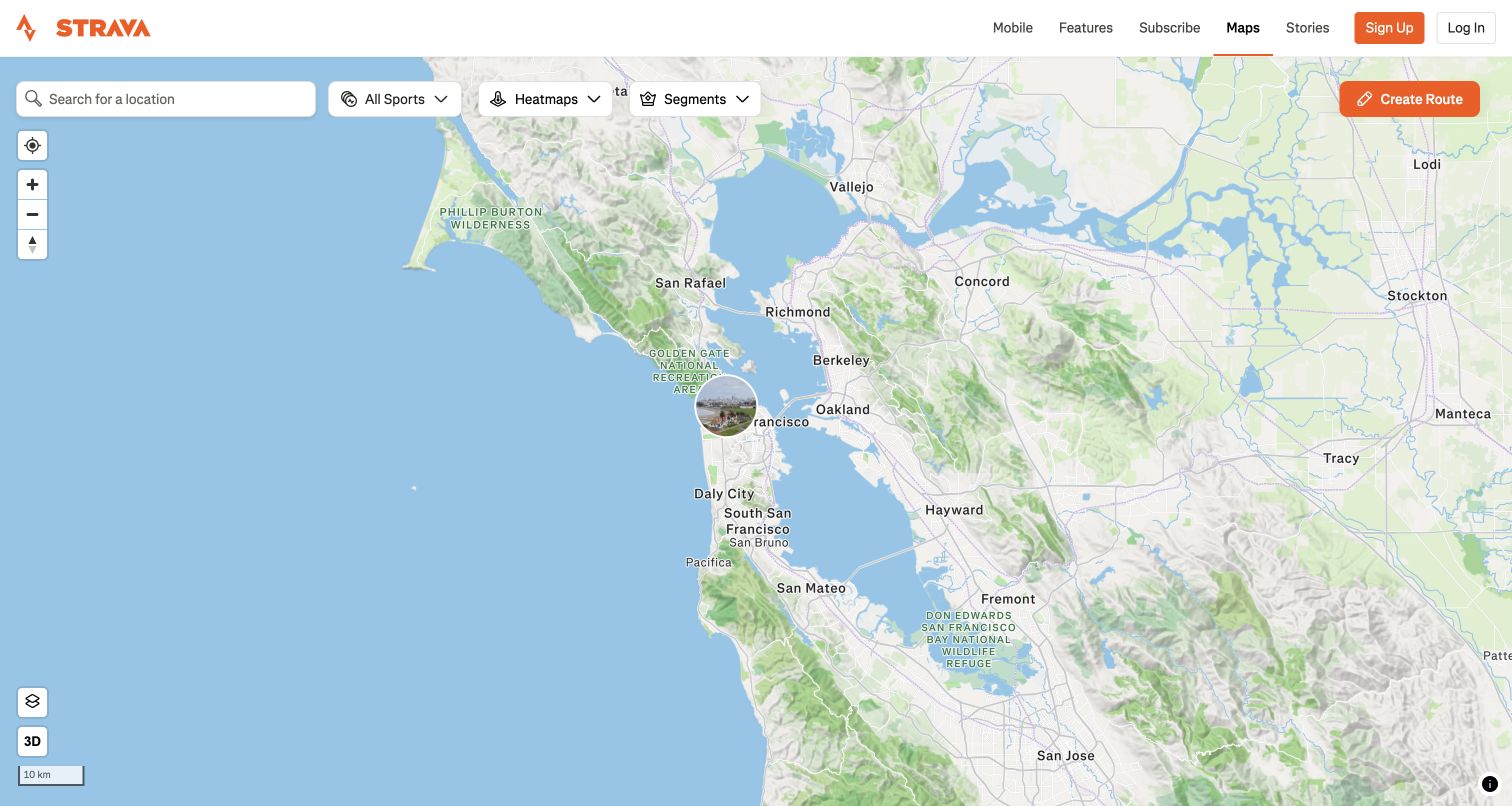
Strava's public Maps page gives the geographic canvas nearly the entire screen below a compact branded header. Location search, sport selection, heatmaps and segments sit in a clear row, while standard zoom and orientation controls remain separate. An orange route-creation action is distinct from simply viewing the map. The screenshot shows the public Bay Area starting extent, not a personally recorded activity or a precise device location. Strava's own documentation identifies Mapbox and OpenStreetMap as important map sources while distinguishing other data used for selected thumbnails. That explanation is stronger evidence than inferring a mapping provider from visual style alone.
What you can learn
Distinguish browsing, creating routes and sharing recorded activity. Keep manual location search useful without device permission, and explain source differences and update delays. Map-source evidence cannot establish live access, weather, emergency readiness or a route's suitability for a particular visitor.
Pros
Sport, heatmap and segment controls separate different reasons for exploring the geography.
The route-creation action is visually distinct from ordinary map viewing.
Cons & considerations
Layer choices need clear selected states and useful explanations for unfamiliar visitors.
Route discovery must distinguish general inspiration from current safety and access information.
Platform source: Strava mapping-source documentation. Strava own mapping documentation identifies Mapbox and OpenStreetMap for its static and interactive activity maps, with other data sources used in some contexts. The capture is the public map, not a private recorded activity. Platform evidence is separate from the direct website screenshot and is not a complete current infrastructure audit.
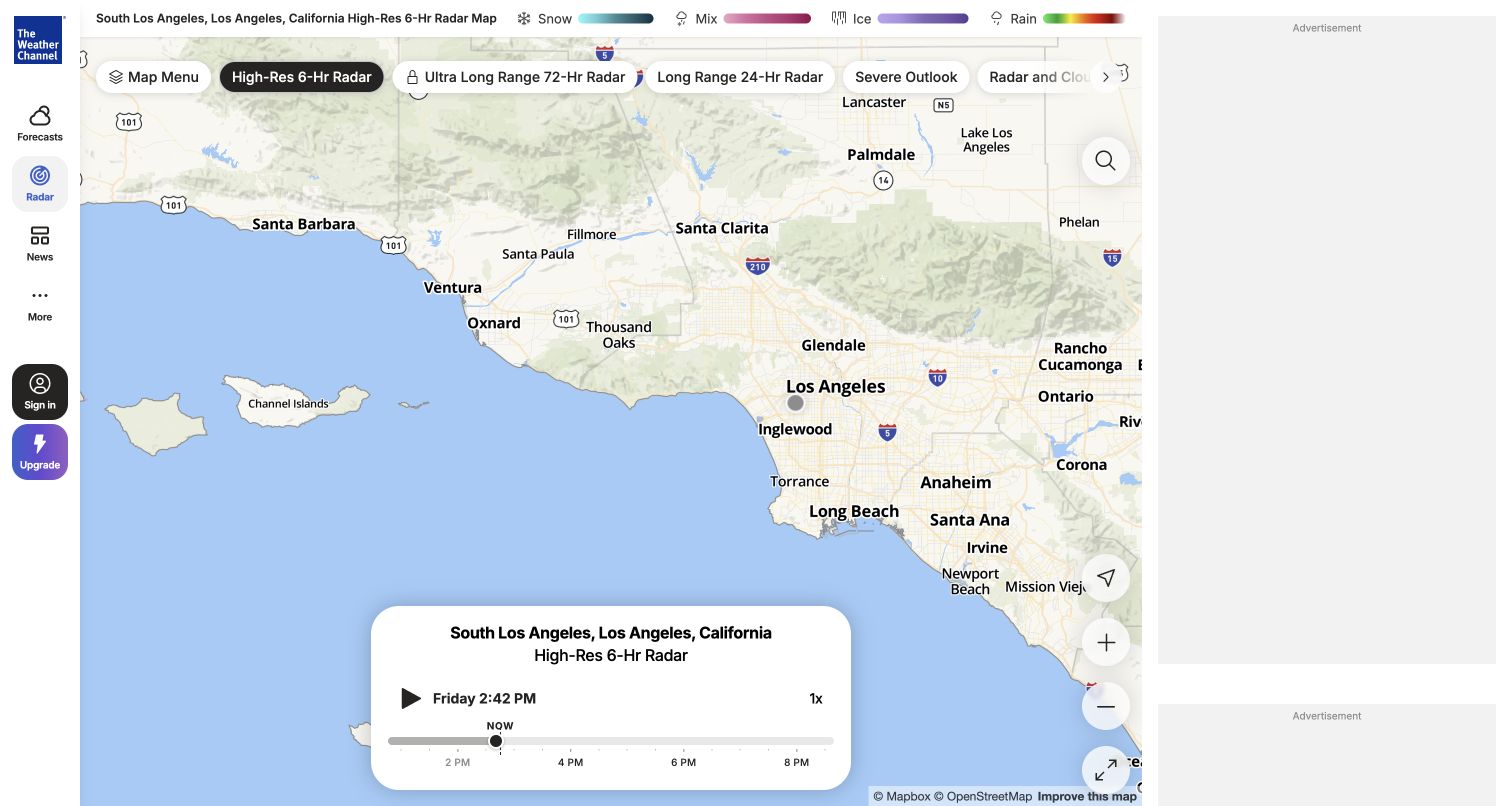
The Weather Channel's radar page pairs a large map with a place heading, layer controls and a playback timeline. Forecast and news navigation remain available, but the map is the principal working area. A compact legend and time display help explain that the colors describe a particular layer and moment, not an undated image. The screenshot is one public radar state for the site's selected locality; no precise device location or personal forecast account was requested. Some layers are marked as paid features, so the visible interface also makes product boundaries part of the map experience rather than a separate pricing page.
What you can learn
Keep geography, layer choice and time as separate persistent state, with clear units and updates. Provide a usable text forecast and authoritative alert routes; a clear radar map cannot replace current emergency instructions or guarantee local conditions.
Pros
The timeline makes the temporal dimension of the visualization visible.
Layer and legend controls provide a structured way to interpret different map views.
Cons & considerations
Numerous layers and premium options can make the control surface overwhelming.
Advertisements and prompts may reduce the space available for the core weather task.
Platform source: Mapbox customer implementation record. The official case documents web and mobile weather mapping products. Mapbox attribution was directly observed on the exact public weather.com radar page. Platform evidence is separate from the direct website screenshot and is not a complete current infrastructure audit.
Kegan has 15+ years of experience working with small businesses, Fortune 500 companies, and everything in between. No development job is too big or too small: he brings the same hands-on attention to a focused improvement, a complete website, or a custom application.
For Mapbox projects, he can help with responsive interfaces, reusable components, custom functionality, API connections, and performance-minded implementation. He works directly with clients on scope, design, implementation, testing, and handover, with an emphasis on clear communication and a system that remains practical to maintain after launch.
Show 3 other Mapbox developersHide other Mapbox developers
Three different products that happen to contain a map
Location and service discovery
Retailers, restaurants, accommodation directories and community services need trustworthy records first. Names, addresses, hours, conditions and contact details should remain usable in a text result, with the map adding geographic context. Define the owner and correction process for every location feed.
Explanatory and research visualization
A thematic map needs a question, a defined dataset, a date and an explanation of its units or model. Build the legend, methodology and alternate presentation as part of the experience. Avoid allowing color, animation or precise-looking boundaries to imply certainty the source does not support.
Planning and operational applications
Routes, reservations, layers and saved work introduce persistent state. Decide which actions are public, which require an account and which create a real transaction. Keep the visitor's draft intact across those boundaries, and do not expose internal operations merely because the public map uses similar technology.
From references to requirements
Plan the location record and failure states before the visual polish
Define a useful first screen
Choose an intentional initial extent: a national overview, a known service region or a clearly labeled example city. Do not require device geolocation just to explain the product. Make manual entry useful, and decide what visitors see when there is no selected place, no matching result or no available service.
Give every result a stable identity
Connect map features, list cards and detail URLs through stable records rather than their current position in a results array. Preserve the chosen item when a visitor changes a filter, moves between list and map, or returns from a detail page. Define what happens when a listed location closes or merges.
Record provenance beside the data model
Maintain source, update time, units and applicable limitations for each layer. Distinguish a modeled estimate from an observation and an archived response from a current service. A map publisher's product documentation is not a substitute for verifying the business or scientific dataset being displayed.
Specify interactions for more than a mouse
Test keyboard order, visible focus, form labels, result announcements and a route around the canvas. Check touch targets and a useful reading order on a small screen. Do not make essential information depend on hover, color alone, drag gestures or an unlabeled marker.
Treat maps as a performance budget
Measure the initial page before and after geographic scripts, tiles, imagery and datasets are added. Delay optional layers without making the primary task appear broken. Keep the page's content and text results useful when a third-party resource times out, a token is restricted incorrectly or browser graphics support is unavailable.
Separate exploration from consequential actions
A hotel pin is not a reservation, a retailer pin is not stock confirmation, and a coverage polygon is not guaranteed service. Explain the transition into quoting, booking or purchasing. Use synthetic records and authorized test environments for transactional checks instead of creating real orders while reviewing the design.
A useful handover demonstration
Ask the actual team to carry out its routine job: publish a realistic update, correct a mistake, preview a narrow screen, and identify who owns an integration failure. For a library or frontend framework, also ask who maintains the content source and deployment. A polished screenshot does not answer those operational questions.
Beyond the screenshot
Mapbox development planning checklist
Write the visitor's starting question and the decision a useful result should support.
Choose an intentional initial map extent without requiring precise device location.
Provide a labeled manual search and a readable list or non-map route.
Keep map selection, result cards, filters and detail URLs synchronized.
Assign stable identifiers and a maintenance owner to location records.
Keep source dates, units, methodology and limitations with each dataset.
Label archived operations, demonstration data and modeled estimates explicitly.
Test keyboard access, focus, touch targets and screen-reader result feedback.
Budget scripts, tiles, imagery and optional layers for ordinary mobile connections.
Explain no results, denied location access and unavailable map resources.
Use least-privilege public tokens and keep secret capabilities server-side.
Review applicable map and data attribution requirements for the actual implementation.
Distinguish location discovery from verified availability and completed transactions.
Keep primary documentary relationships separate from independently observed page technologies.
Test with real content, a keyboard, a small screen, slow or failed requests, and the people who will maintain the system. These are planning checks, not an accessibility, security, performance, or search-ranking certification.
Sources & editorial method
How this Mapbox collection was reviewed
Twenty distinct public websites or products were directly visited and captured from their actual destinations. Original reviews compare the observed layouts and distinguish working-map states from marketing, directory-list and archival entrances. Mapbox's exact implementation stories support nineteen associations; Strava's own documentation supports its map-source relationship. The unrendered UNESCO entrance, incomplete CNN and AllTrails captures, retired OCHA dashboard and blocked New York Times destination were not used to fill the collection. New source pages receive the same bounded public HTML and linked-asset audit attempt as other examples. No private itinerary, account, device-location permission, emergency action, booking or payment was submitted.
Every image is an unmodified capture from the actual website, with its source and capture date. Some captures are reused from our shared catalog; their dates remain the original capture dates. None comes from a vendor gallery or a generated reconstruction. Moving imagery and live content can change.
Technology attribution uses public page assets or metadata, official platform documentation, or a cited first-party project case study. Documentary and framework-relationship evidence is identified where used; it is not a complete current backend inventory. A CMS image CDN alone does not establish a full CMS deployment. A library’s presence does not prove which individual controls use it, and a platform label does not establish AI authorship.
The composition notes, lessons, pros and tradeoffs are original editorial observations. We have not measured conversion, traffic, security, performance or accessibility conformance. Website owners retain their brands and imagery; these examples are not our client portfolio. Written, Edited and Curated are independent records, not dates advanced by a build. See our editorial standards or suggest a correction.
Questions worth asking
Mapbox website development FAQs
Do all twenty screenshots show a working Mapbox map?
No. Some show the public entrance or list view of a documented mapping product. Reviews label those states instead of presenting a marketing screenshot as direct proof of a live map. Exact source records and independently observed technologies retain their own scope.
Can a map replace a normal location directory?
Usually it should complement one. A searchable text list can make names, services, hours and contact details accessible when a canvas is difficult to use or unavailable. Decide how both views share selections and filters rather than maintaining unrelated versions of the same records.
Does a Mapbox association verify the data displayed on a website?
No. Map rendering, geographic source data and a business's own location or availability feed have different owners and limitations. Verify each separately. This guide is design and development inspiration, not confirmation of coverage, inventory, emergency conditions, property boundaries or travel safety.
Should visitors have to grant location access?
Give them a practical manual route unless the specific task truly requires device location. Explain why location is needed before requesting it, and design a useful denied-permission state. A city search and a precise device coordinate are not equivalent privacy choices.
Why include a demonstration or an archived project?
They can illustrate a clearly defined interface pattern when labeled honestly. StoreRocket's example data is not presented as a real client chain, and WCK's historical response is not presented as a current food-service directory. Neither is used to imply private access or current operational verification.
Start with trustworthy records, clear context and a useful text route. Then make the geography help people decide—not simply give the page a more impressive background.