Best D3.js Websites of 2026 (20 Real-World Examples)
D3.js visualizations, teaching tools, and D3-based chart libraries with implementation scope preserved
Twenty public properties show how D3 supports bespoke visual explanations, exploratory tools, and higher-level chart libraries. Exact features and documented module relationships are distinguished from entire organizations, and historic or archived examples keep their dates and qualifications.
D3 is a collection of visualization modules, not a universal chart theme or a complete application framework. Some examples use D3 directly to connect data and interface elements. Others use a higher-level system whose official source identifies particular D3 dependencies. Both relationships can be useful, but they should not be collapsed into an unsupported claim that every visible mark or every organizational website is built directly with D3.
TensorFlow Playground, Financial Times Visual Vocabulary, Brown-hosted Seeing Theory, Our World in Data’s life-expectancy Grapher, and Gapminder Tools open this collection. The Playground source explicitly says it is not an official Google product. Seeing Theory is visibly archived. Our World in Data is a module-level Grapher association, while the Financial Times and Gapminder examples concern particular public tools. These boundaries are part of the evidence, not footnotes to discard.
Before the examples
What makes good D3.js website development in 2026?
Start with the analytical relationship
Decide whether the reader needs to compare quantities, follow time, inspect distribution, understand a network, or test a parameter. Choose an encoding around that task before choosing animation, a framework wrapper, or a large catalogue of chart types.
Definitions, units, population, dates, source, missingness, and uncertainty affect interpretation. Keep them within reach of the chart and preserve that context when readers change a filter, download data, or share a particular view.
Make interaction observable and reversible
Show which controls changed the current selection, what is still included, and how to reset. Teach unfamiliar dragging or parameter controls explicitly. A moving visualization should not require readers to remember an earlier frame to understand the result.
The collection · 20 examples
20 D3.js website examples worth studying
Each entry is a separately pictured public property with an original review. Primary project source or an explicit first-party implementation statement establishes the D3 relationship. Direct D3 features, D3-module dependencies, chart-library demonstrations, archived references, and dated editorial analyses are labeled according to their actual scope.
We start with five recognizable brands or organizations: TensorFlow Playground, Financial Times Visual Vocabulary templates, Brown University Seeing Theory — archived reference, Our World in Data — life expectancy Grapher, Gapminder Tools. Each attribution applies to the named website property, not every product or website belonging to its organization. This is a curated reading sequence, not a measured ranking.
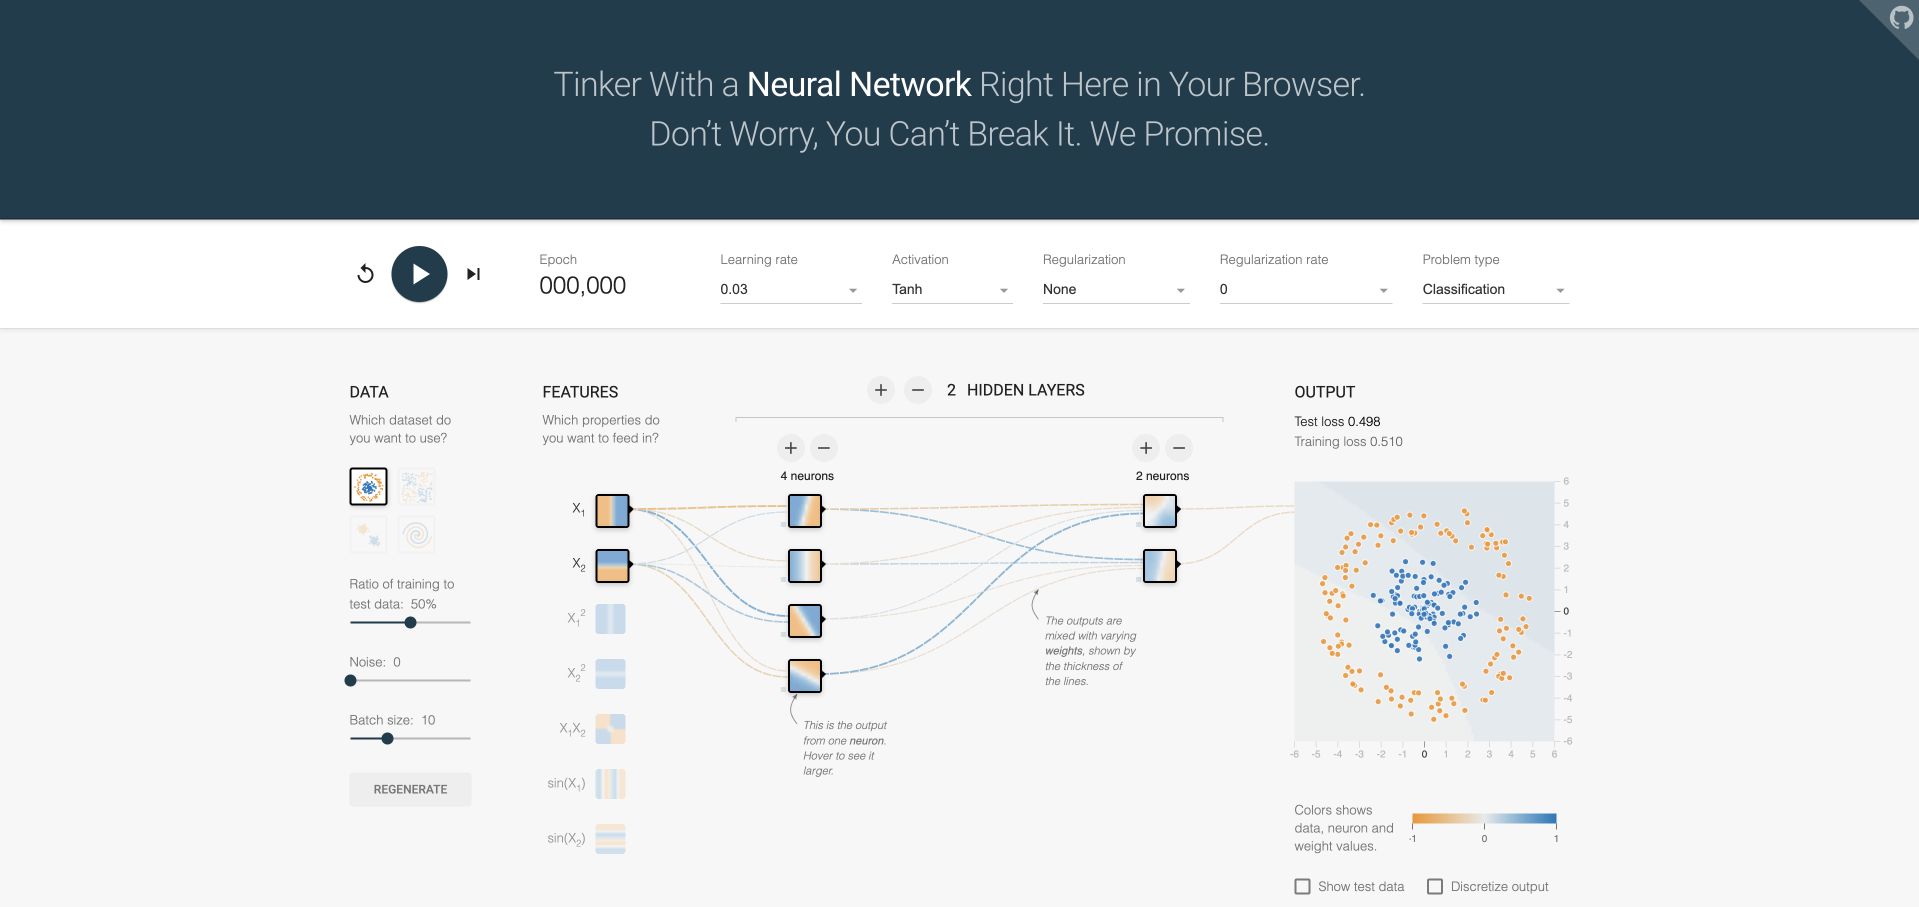
TensorFlow Playground spreads the learning process across data, features, hidden layers, and output rather than concealing everything behind one prediction button. Small colored neuron squares connect to a larger output plot, while the learning controls sit in a separate horizontal strip. The official project source documents D3.js in this exact browser visualization and explicitly distinguishes it from an official Google product. This is a teaching experiment, not evidence about TensorFlow’s production applications.
What you can learn
Use D3 to expose meaningful intermediate representations, not merely decorate a final result. Keep the chosen dataset, model settings, and output interpretation visible together so a learner can relate one change to its consequences without remembering an earlier screen.
Pros
The left-to-right arrangement makes the relationship between input features, hidden representations, and output visually inspectable in one place.
Training controls are grouped separately from the network drawing, preserving a recognizable place to pause or restart the experiment.
Cons & considerations
Numerous technical parameters can overwhelm a beginner unless nearby explanations distinguish useful first steps from advanced exploration.
A colorful successful demonstration does not establish real-world model performance, appropriate training data, or suitability for consequential decisions.
Platform source: Primary exact-property D3 implementation evidence. The project repository identifies this browser visualization as TypeScript using D3.js; it explicitly says it is not an official Google product. Platform evidence is separate from the direct website screenshot and is not a complete current infrastructure audit.
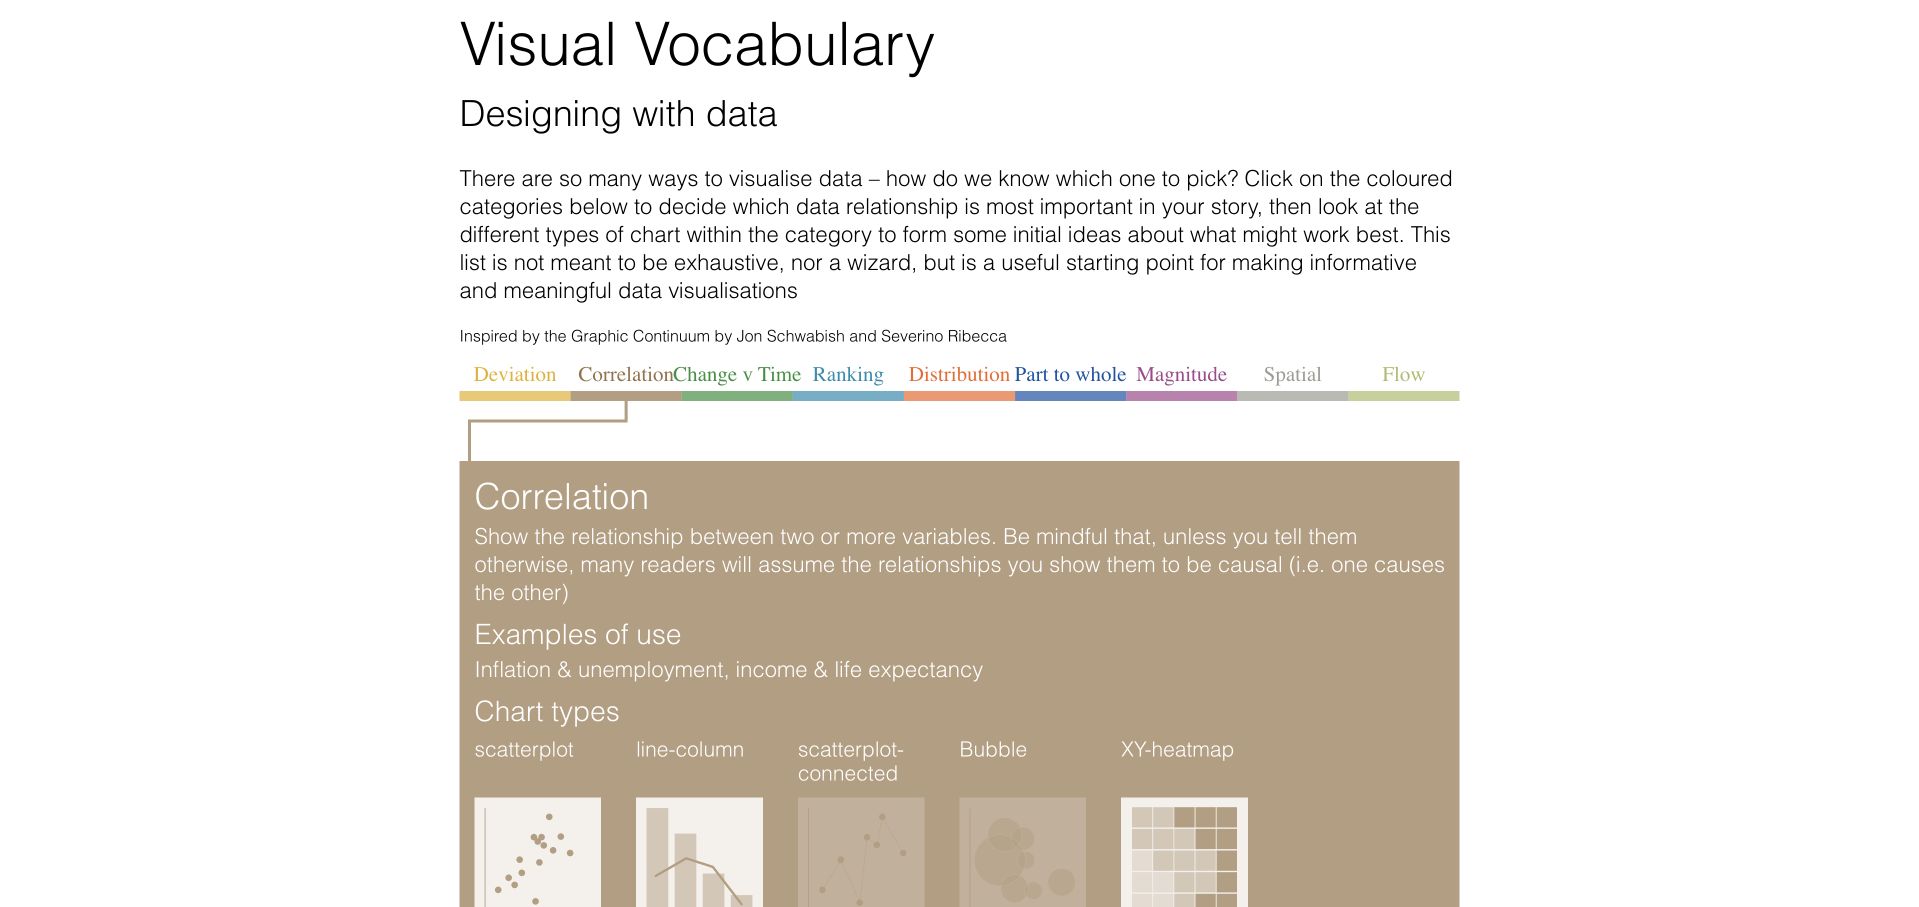
The Financial Times’ Visual Vocabulary starts with the question of what relationship a story needs to show. A narrow band of colored categories opens a much larger explanatory panel; the reviewed correlation state pairs a caution about causation with several chart thumbnails. D3 is associated with this official FT Interactive template property through its named bootloader and public source, not with every Financial Times article, subscription workflow, or corporate website.
What you can learn
Let a visualization selector teach the reasoning behind a choice. Store the analytical relationship, examples, cautions, and candidate chart forms as connected content, then use D3 interaction to reveal that structure without presenting the result as an automatic recommendation.
Pros
The selected family retains its category color, maintaining a visual connection between the small selector and the expanded explanation.
A written warning accompanies the correlation examples, giving the reader interpretive context rather than presenting attractive shapes alone.
Cons & considerations
Closely spaced category labels create a demanding navigation target and need a more forgiving arrangement on narrow displays.
The template examples illustrate possible forms, but cannot decide whether a particular dataset supports a defensible comparison.
Visible tech stack
Referenced on the public page
GitHub Pages
Earlier / documented evidence
D3.js
Platform source: Primary exact-property D3 implementation evidence. The official FT Interactive property loads the Financial Times D3 bootloader and renders its chart-family selector and examples. Platform evidence is separate from the direct website screenshot and is not a complete current infrastructure audit.
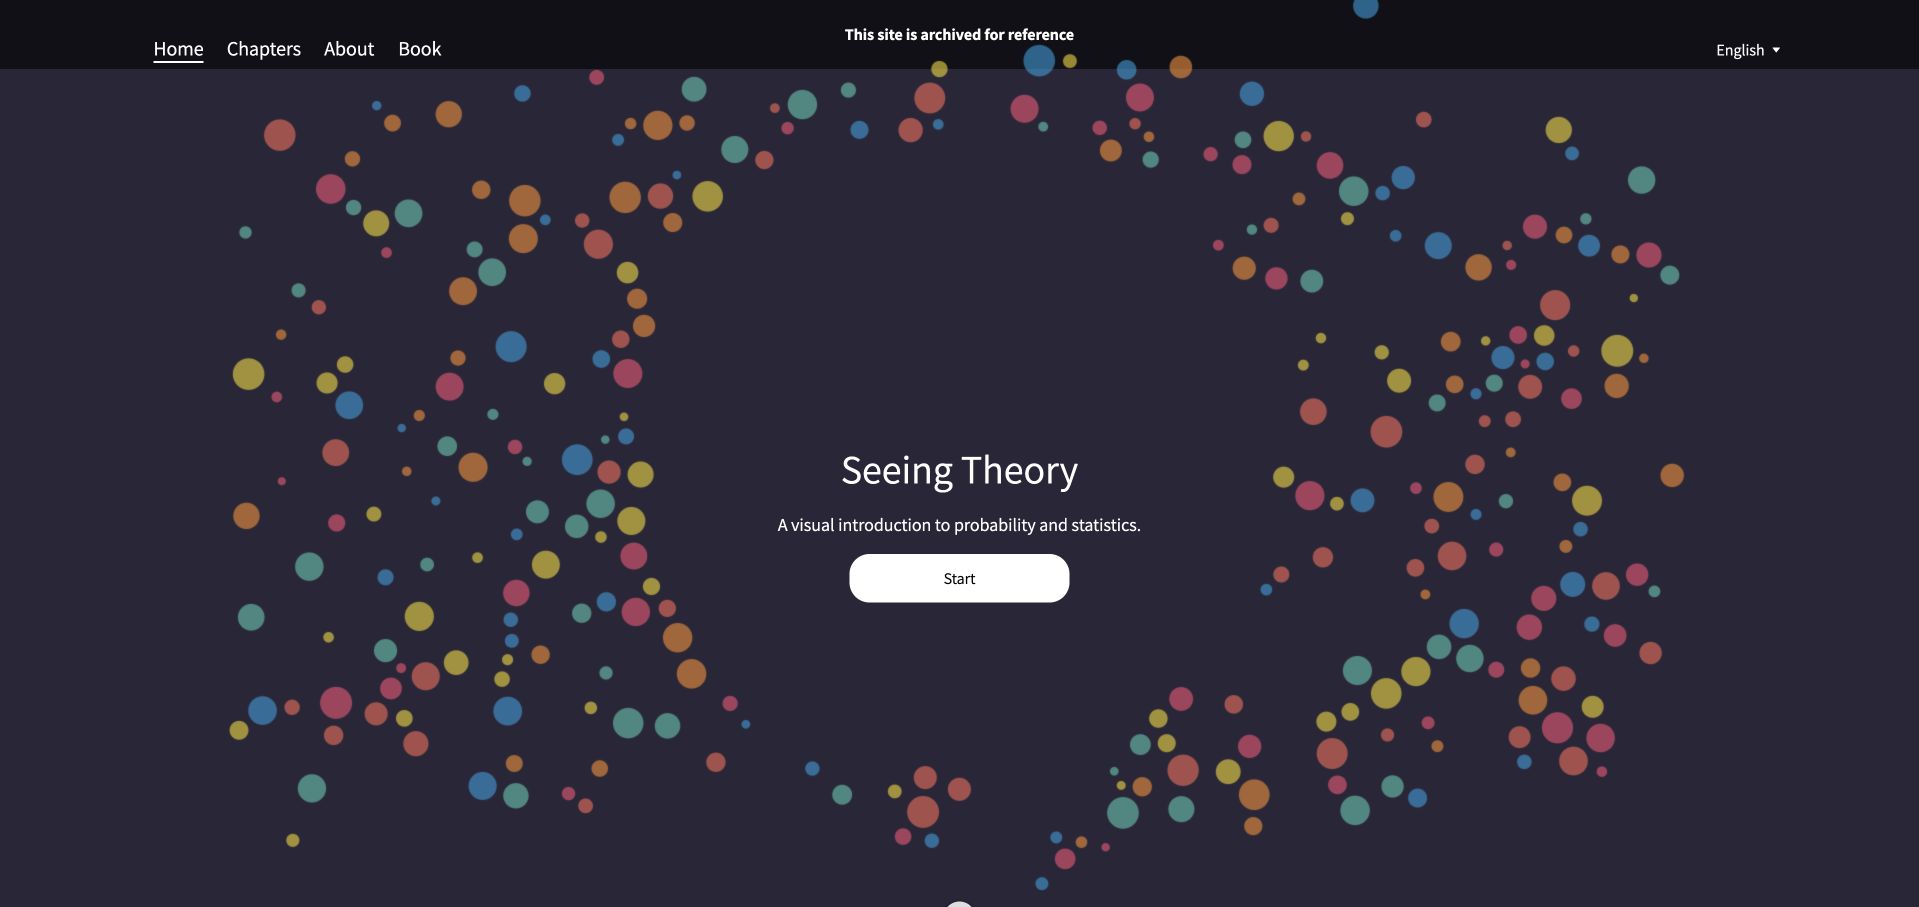
Seeing Theory’s opening places a small title and Start control inside a dark field of colored circles. A restrained header offers chapters, project background, a book, and language selection, while an explicit archived-reference notice remains visible above the scene. The Brown-hosted teaching project documents its D3.js visualizations in public source. This review concerns that archived educational property, not Brown University’s wider website or a claim of ongoing curriculum maintenance.
What you can learn
An exploratory graphic can establish a subject’s visual language before a lesson begins, but its lifecycle needs equally clear communication. Preserve direct chapter navigation and a durable archival notice so readers can distinguish an engaging explanation from actively maintained course material.
Pros
The centered opening keeps the first decision simple while the chapter navigation supports readers who already know their destination.
The archive notice appears in the persistent header instead of being hidden in a distant project-history page.
Cons & considerations
Decorative moving circles should have a useful reduced-motion state and must not be the only explanation of the subject.
Archived explanations may rely on older interaction patterns or dependencies; their continued public availability does not guarantee current maintenance.
Platform source: Primary exact-property D3 implementation evidence. The Brown-hosted project explicitly describes D3.js visualizations and its public page loads a local D3 script; the site is visibly archived. Platform evidence is separate from the direct website screenshot and is not a complete current infrastructure audit.
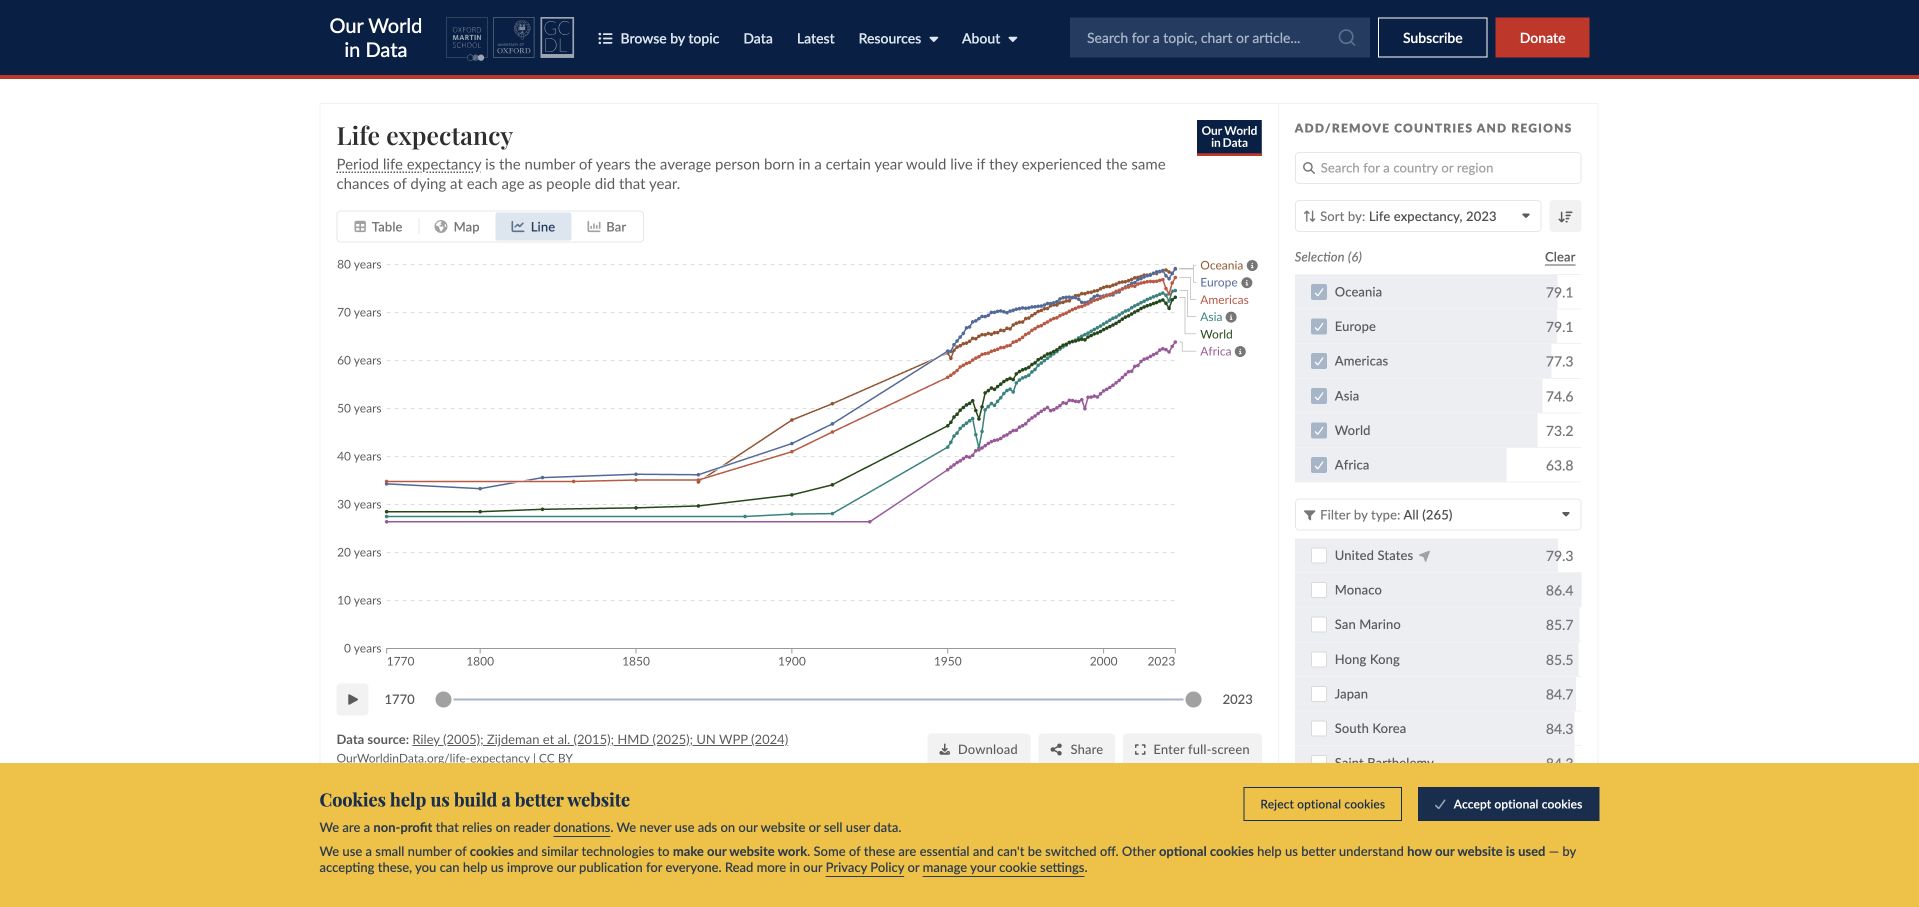
Our World in Data’s life-expectancy chart combines a plain-language definition with line, map, table, and bar view controls. A country-selection column sits beside the plot, and dates, source information, download, and sharing actions remain part of the same public chart property. The official Grapher source declares D3 modules within the system. That establishes a module-level association, not a claim that every mark in this line chart or the entire publication is directly rendered by D3.
What you can learn
Keep the indicator definition, temporal coverage, units, source, and selection state close to the visualization. Switching presentation should preserve a reader’s analytical context, while downloadable data and explicit qualifications provide routes beyond an attractive chart image.
Pros
Several representations of the indicator are available in the chart frame, accommodating different comparison and reading tasks.
The source and time controls stay near the plot, making them part of interpretation rather than an unrelated methodology appendix.
Cons & considerations
Many simultaneous country lines can become difficult to distinguish without deliberate selection and noncolor identification.
An interface that supports exploration does not by itself resolve differences in historical estimates, missing data, or source methodology.
Platform source: Primary exact-property D3 implementation evidence. The official Grapher repository names the public chart system and declares D3 modules including d3-dsv and d3-geo; this is a module-level association, not a claim that every chart mark is rendered directly by D3. Platform evidence is separate from the direct website screenshot and is not a complete current infrastructure audit.
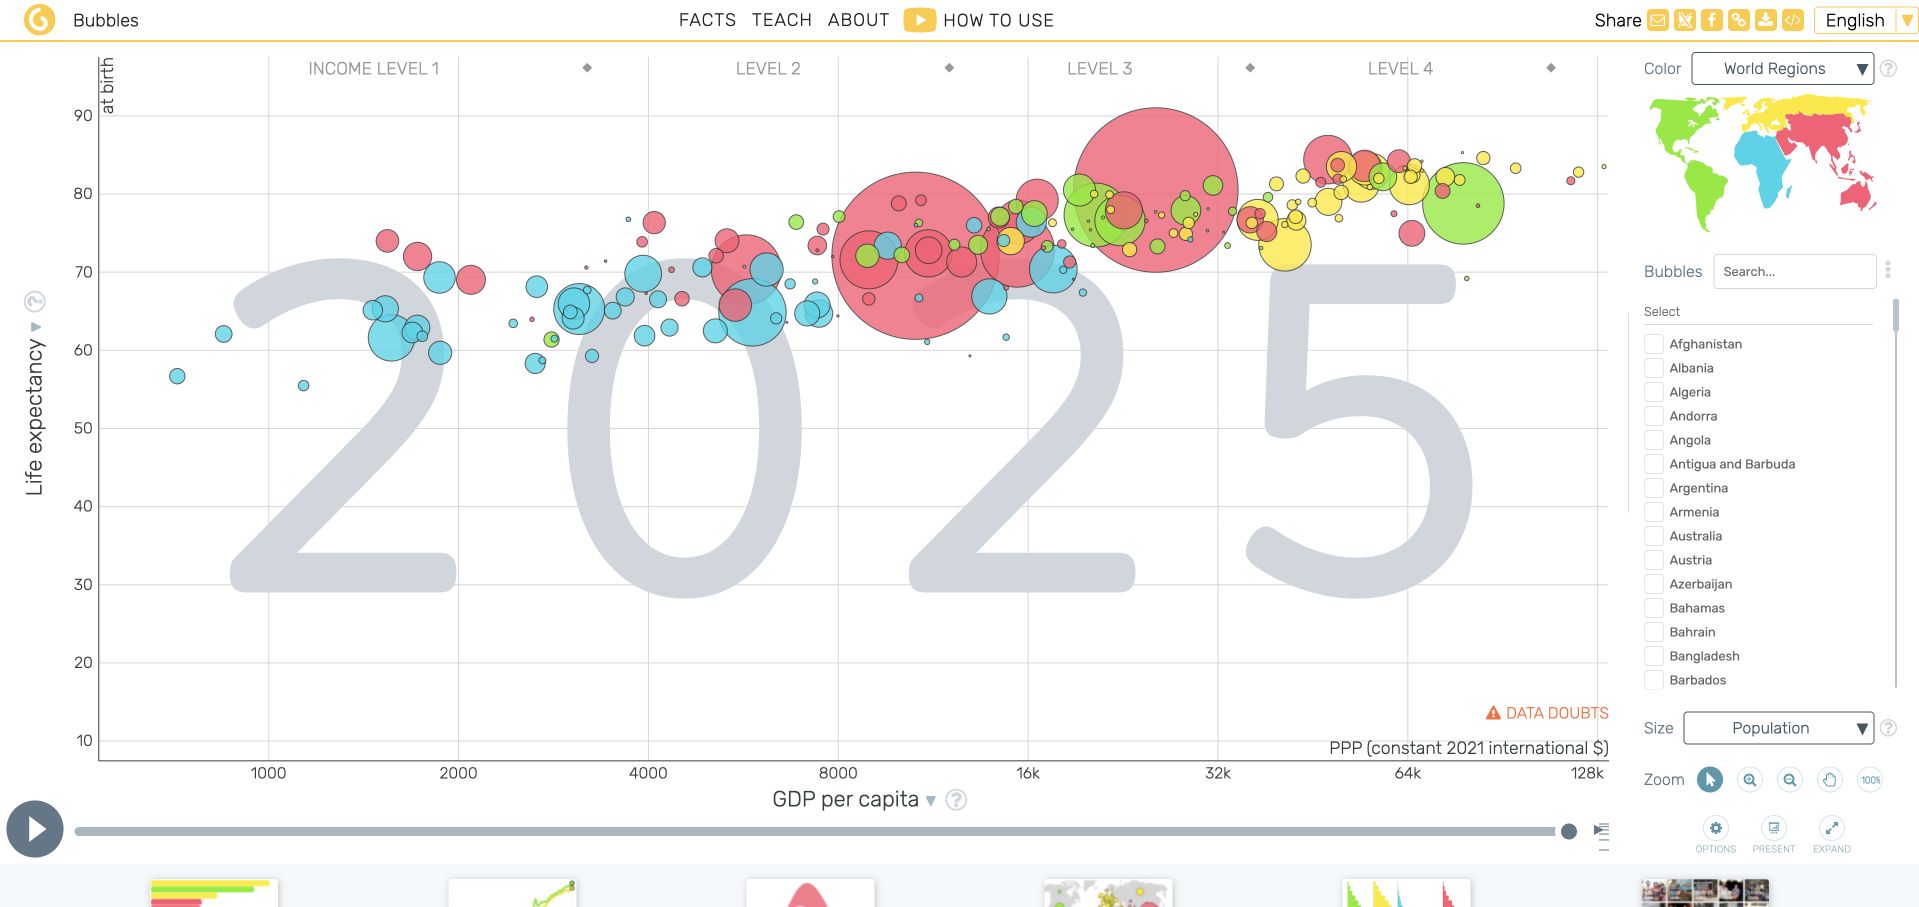
Gapminder Tools gives most of the screen to a country bubble chart, with income on the horizontal axis, life expectancy vertically, population encoded by size, and regions distinguished by color. A large year sits behind the marks, while playback and a country list establish the main exploration controls. Official Gapminder source documents the D3-based Vizabi chart layer for this tools property, not every Gapminder publication, donation page, or linked educational resource.
What you can learn
When several visual encodings coexist, make each one independently understandable. Keep the time state unmistakable, provide persistent country selection, and explain scale choices so animation supports comparison without requiring readers to infer the meaning of size, position, and color simultaneously.
Pros
The year remains highly visible inside the chart, reducing ambiguity about the temporal state during animated exploration.
Country selection and the regional color key remain adjacent to the plot instead of requiring a separate settings screen.
Cons & considerations
Overlapping bubbles make smaller populations difficult to inspect unless selection, highlighting, and suitable alternatives remain available.
Income and population encodings need clear scale explanations; movement alone can encourage stronger causal interpretations than the data supports.
Platform source: Primary exact-property D3 implementation evidence. Gapminder’s official tools source documents Vizabi charts rendered with D3, and the exact public tools page references its vendor D3 script. Platform evidence is separate from the direct website screenshot and is not a complete current infrastructure audit.
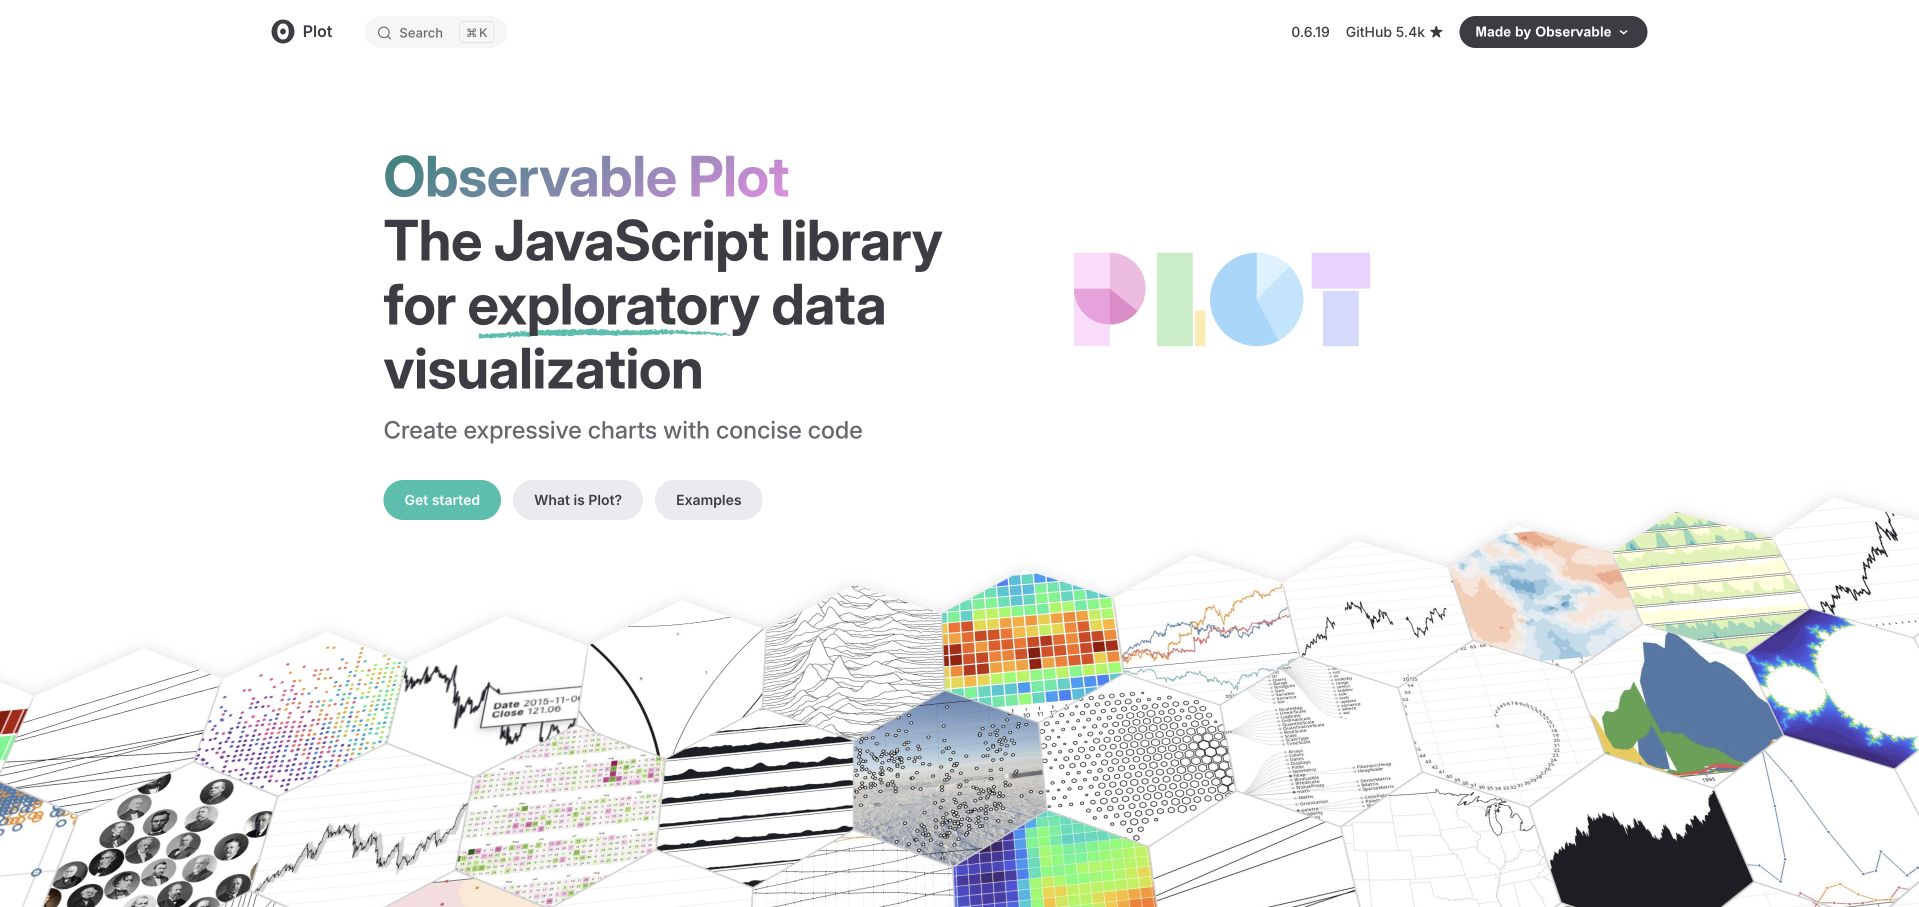
Observable Plot introduces a concise promise beside a large perspective collage of charts. Maps, dots, lines, distributions, and small multiples form a visual landscape beneath a compact documentation header. Get started, conceptual explanation, and examples are separate entry routes. The official property explicitly identifies Plot as built with D3. This is a library-and-demonstration association; it does not mean the surrounding documentation layout or every Observable product is a direct D3 visualization.
What you can learn
Show a library’s range without making its first screen a configuration panel. Pair representative outputs with a short conceptual explanation and a clear route to working examples, then let documentation progressively introduce the grammar behind those results.
Pros
The chart collage communicates breadth before a reader needs to understand individual plotting functions or data transformations.
Distinct introductory and example routes acknowledge that beginners and experienced developers arrive with different immediate questions.
Cons & considerations
The perspective collage is visually rich but small charts cannot carry detailed interpretation or serve as accessible data alternatives.
A compact library promise needs practical examples of labels, missing data, and responsive behavior before teams can evaluate production fit.
Platform source: Primary exact-property D3 implementation evidence. The official Observable Plot website explicitly states that Plot is built with D3; the association concerns its visualization library and examples. Platform evidence is separate from the direct website screenshot and is not a complete current infrastructure audit.
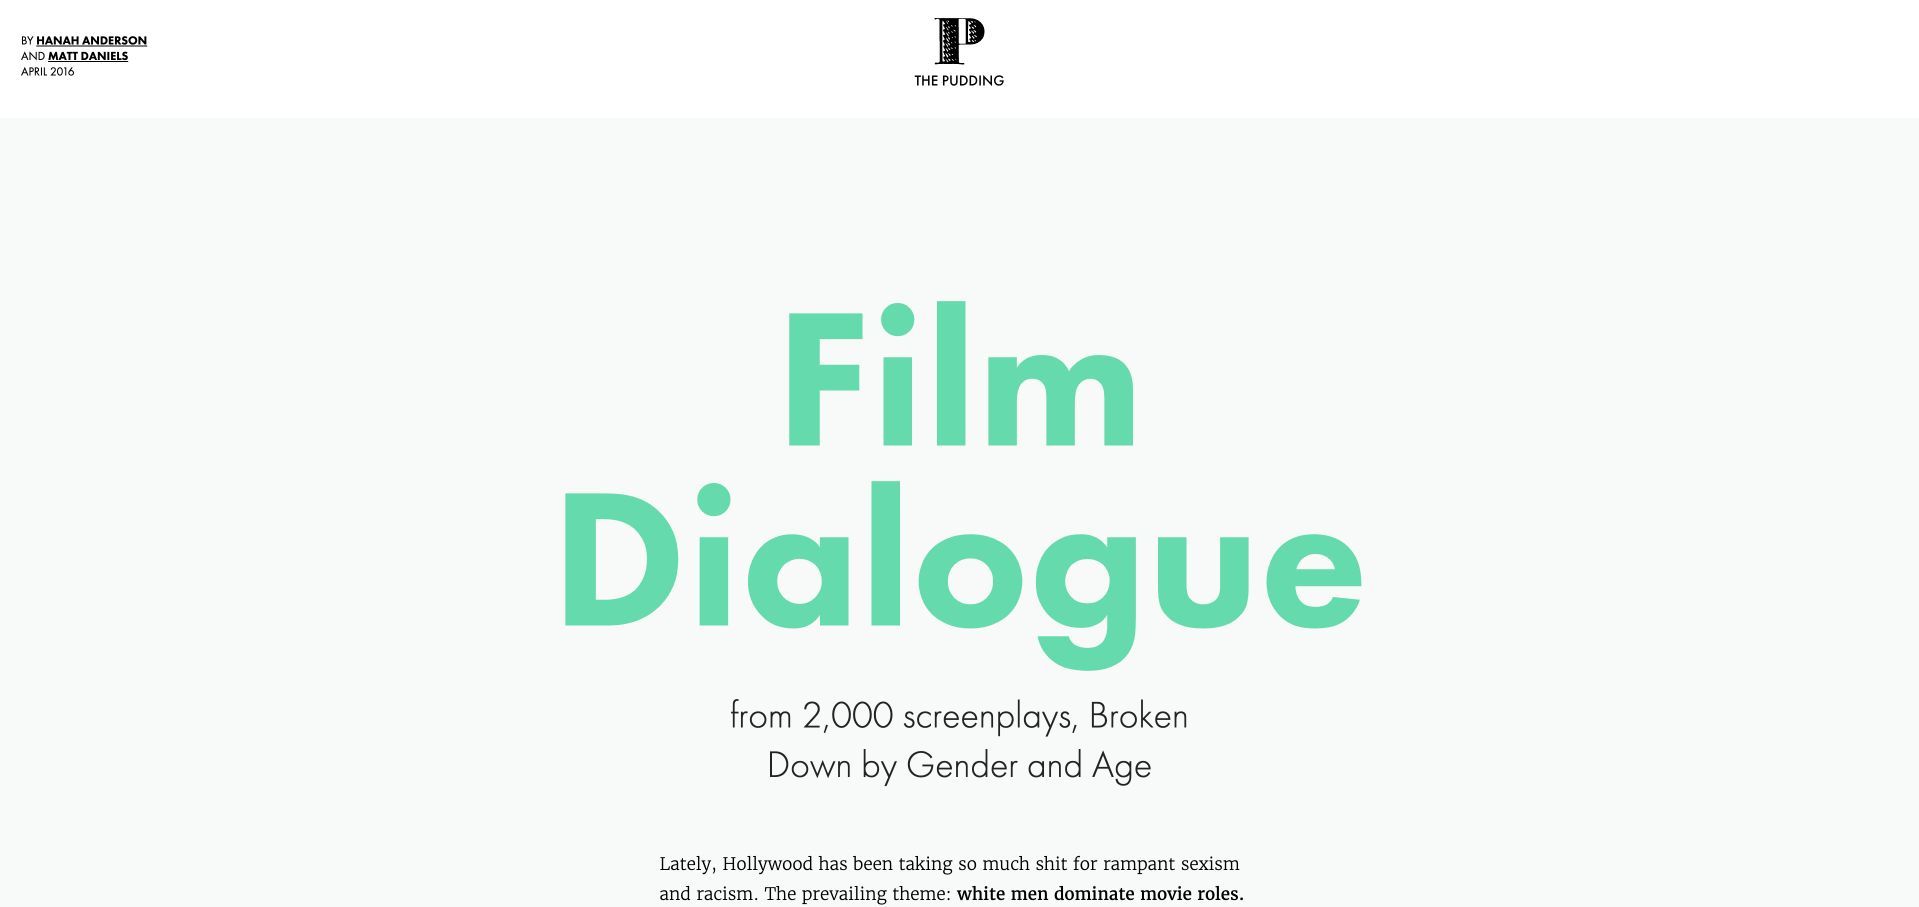
Film Dialogue opens with a very large mint title and a concrete statement of its screenplay sample before moving into a long analysis of gender and age. Author credits and the April 2016 publication context frame the work as a particular reported feature. Its public page loads D3 directly. The association belongs to this dated interactive essay, not every Pudding story, and the sample should not be mistaken for a current census of all films.
What you can learn
Start a data story by establishing the question, sample, authorship, and period. Let each visual section advance one part of the argument, with enough prose to explain what the chart includes and which larger claims the selected dataset cannot support.
Pros
The sample size appears in the opening, placing a concrete boundary around the analysis before detailed chart reading begins.
Prominent author and date information makes the essay’s provenance easier to distinguish from an anonymous evergreen infographic.
Cons & considerations
A long scroll can separate later findings from earlier methodological qualifications unless those limitations remain easy to revisit.
The headline’s force needs careful qualification about screenplay selection and historical coverage, especially when the essay is shared out of context.
Platform source: Primary exact-property D3 implementation evidence. This exact public feature loads D3 3.5.12; it is a dated analysis credited April 2016, not a current census of film dialogue. Platform evidence is separate from the direct website screenshot and is not a complete current infrastructure audit.
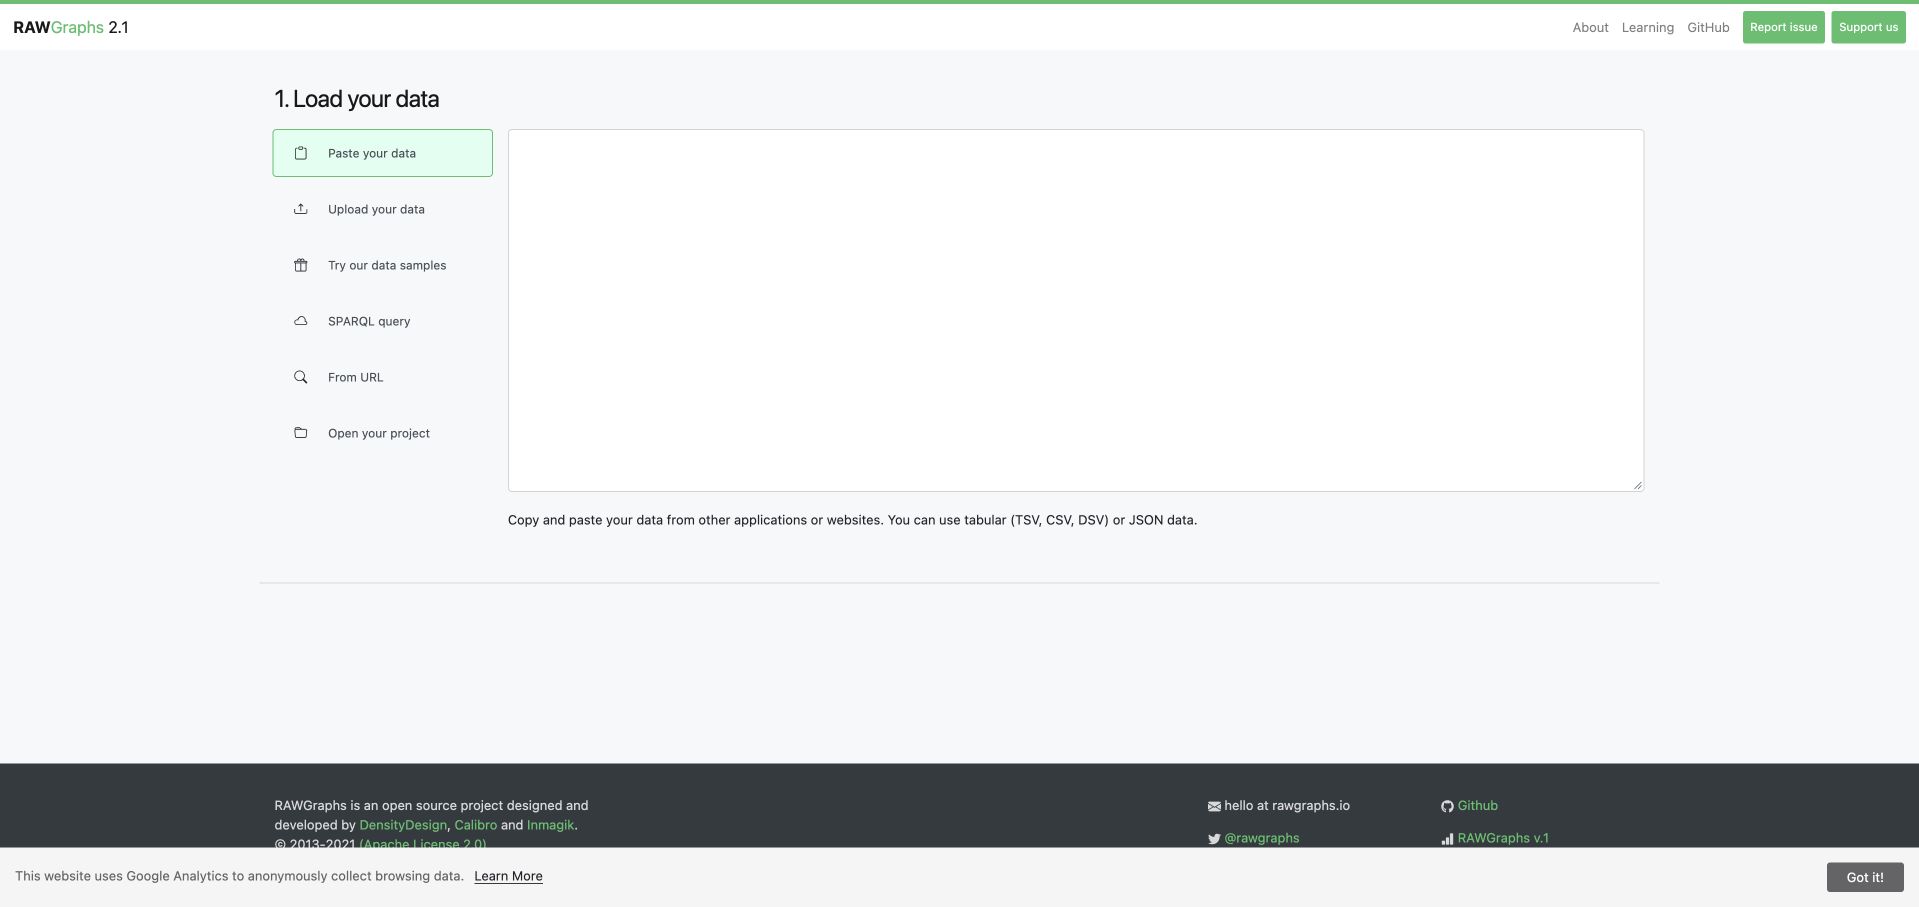
RAWGraphs opens at a clearly numbered data-loading step rather than displaying a fabricated finished dashboard. A vertical list distinguishes pasting, uploading, samples, a query, a URL, and reopening a project; a large input area occupies the remaining workspace. The official application is built on RAWGraphs core, whose source declares D3 modules. Only the public initial workflow was reviewed: no personal dataset was entered, uploaded, queried, or sent to another service.
What you can learn
Make the origin and handling of data understandable before introducing chart choices. A visualization application should distinguish examples from user input, explain format expectations, and establish what happens next without implying that an empty workspace is an error.
Pros
The numbered first step makes the current stage obvious before a user has selected a visualization or mapped fields.
Separate input methods acknowledge that pasting, uploading, querying, and reopening a project are different workflows with different expectations.
Cons & considerations
The large empty input area needs clear sample and format guidance for visitors who have never prepared structured data.
A public interface review cannot establish privacy handling, parser robustness, or export accuracy; these require separately authorized testing.
Platform source: Primary exact-property D3 implementation evidence. The official RAWGraphs application uses RAWGraphs core, whose source declares D3 data, scale, axis, selection, color, and formatting modules. Platform evidence is separate from the direct website screenshot and is not a complete current infrastructure audit.
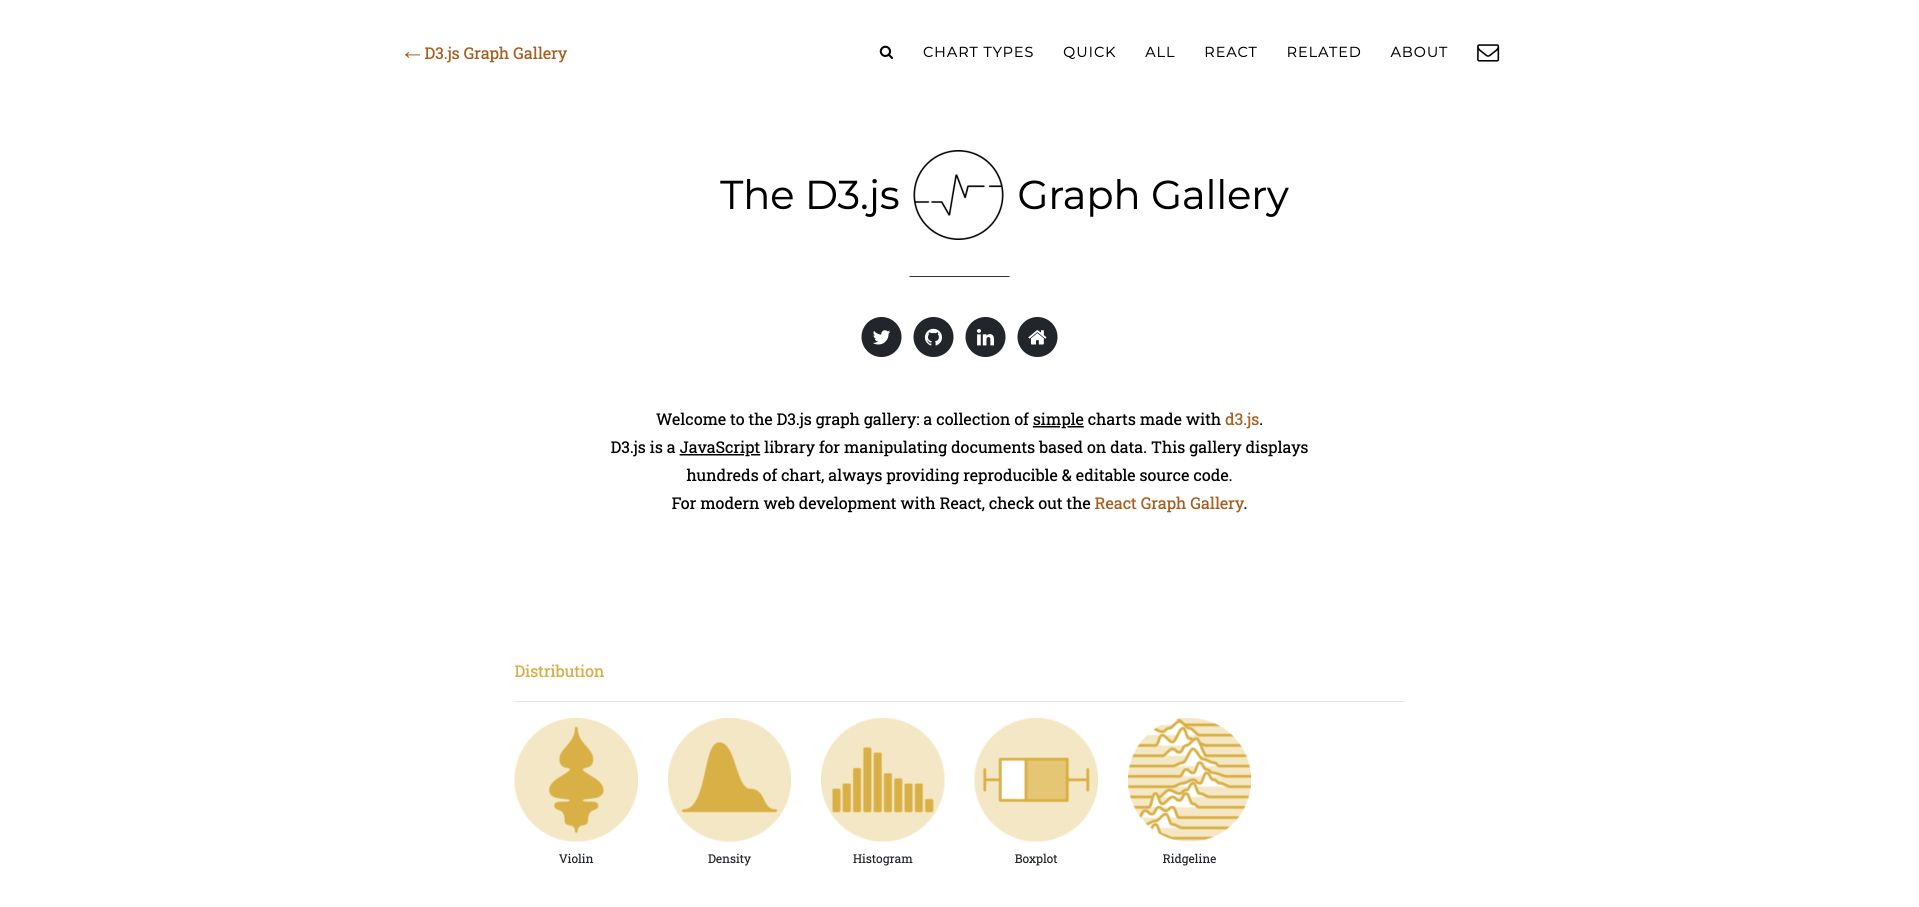
D3 Graph Gallery introduces itself in a centered editorial block before presenting recognizable families of chart thumbnails. Distribution examples begin with violin, density, histogram, boxplot, and ridgeline forms, while navigation offers chart types, a quick route, all examples, and related resources. The author-operated property explicitly describes reproducible D3 examples. This association concerns its tutorial catalogue and chart code, not an assertion that every decorative image or the entire page layout is generated with D3.
What you can learn
Organize a technical example library around the reader’s analytical task as well as implementation detail. A useful chart card should lead to a small, comprehensible dataset and source example, with version context and caveats that survive when someone copies the pattern.
Pros
Named chart families make the catalogue scannable without forcing every visitor to begin with an API reference.
The stated emphasis on reproducible source establishes a practical next step beyond looking at a static inspirational thumbnail.
Cons & considerations
Many visually similar examples need clear difficulty and version labels so readers do not combine incompatible implementation patterns.
An example that runs with a small clean dataset does not automatically handle real missing values, long labels, or dense mobile displays.
Platform source: Primary exact-property D3 implementation evidence. The author-operated public gallery explicitly identifies its examples as charts made with D3.js and links reproducible source. Platform evidence is separate from the direct website screenshot and is not a complete current infrastructure audit.
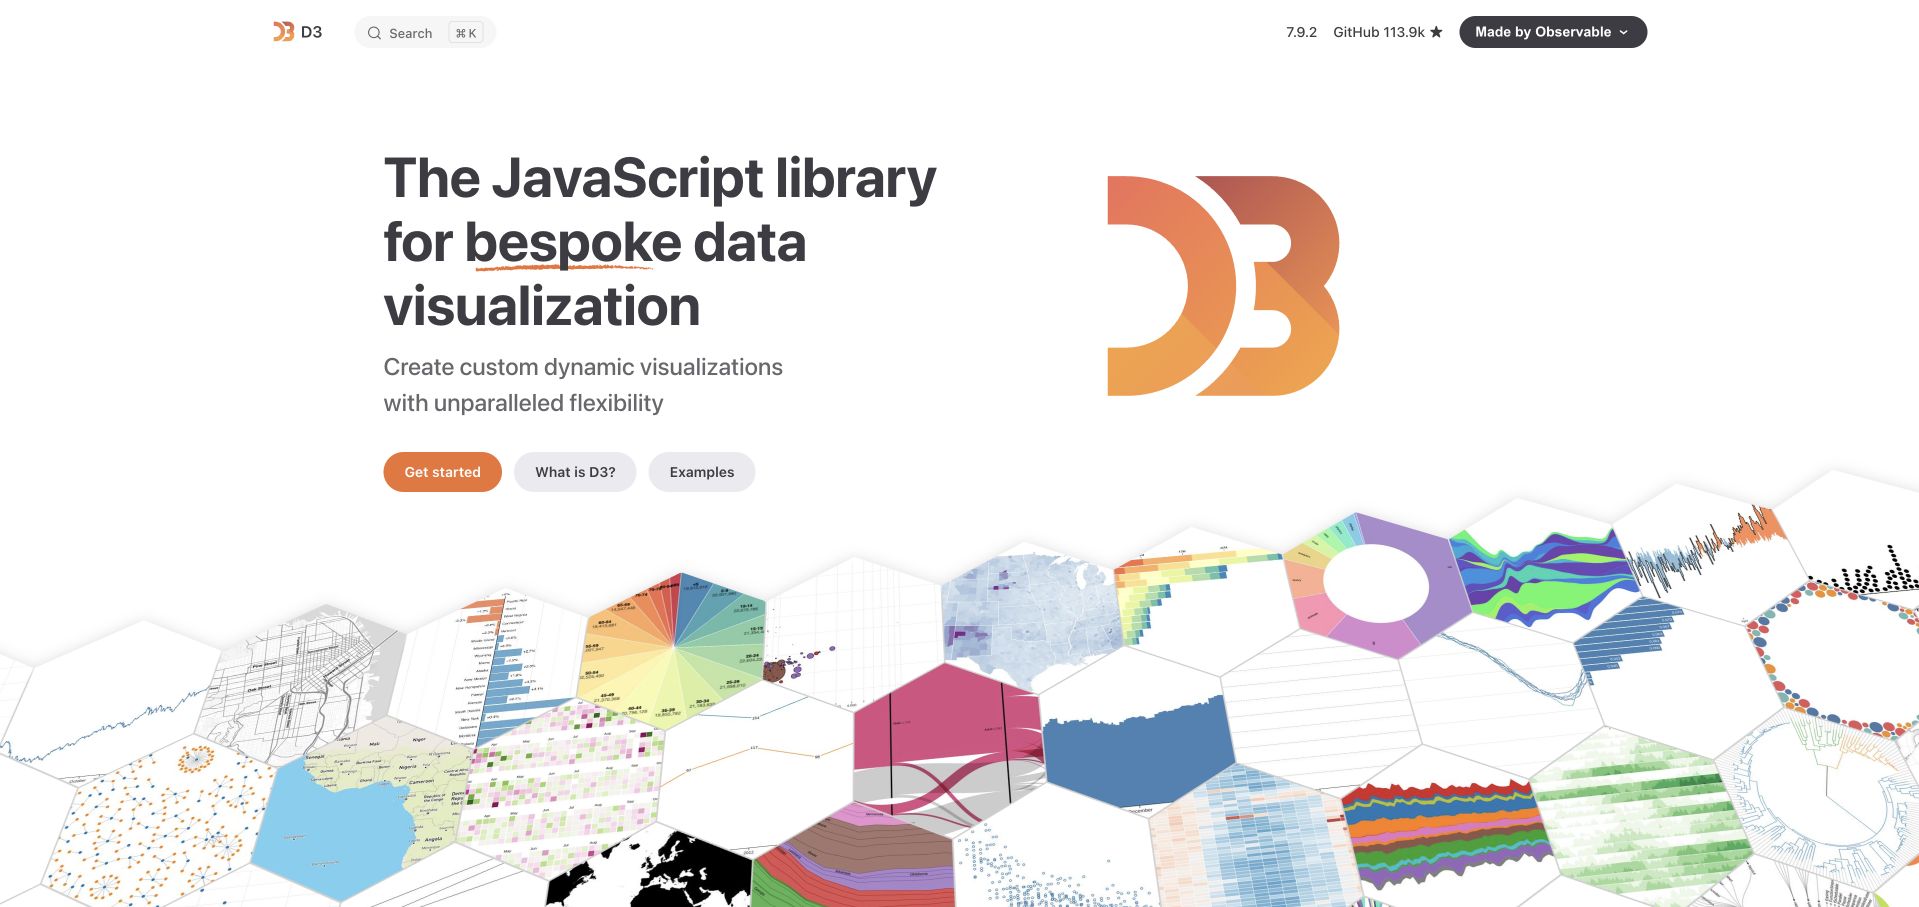
D3’s official website frames the library around bespoke visualization rather than promising a finished dashboard theme. Documentation, examples, and community routes make the property both a technical reference and an introduction to the range of outputs that individual modules can support. The D3 relationship is first-party and explicit. It concerns the library, its examples, and documentation, not an inference that every element of the surrounding website requires data-driven drawing.
What you can learn
Explain what a low-level library gives the team and which responsibilities remain theirs. Examples should connect visual results to the relevant modules, while the implementation plan separately covers data cleaning, responsive layout, keyboard access, annotations, and a useful noninteractive representation.
Pros
The bespoke-visualization positioning establishes a useful distinction from tools that provide a fixed set of complete chart components.
Direct access to examples and API material supports both exploratory evaluation and focused implementation questions.
Cons & considerations
The breadth of individual modules can make a first project difficult to scope without choosing a concrete chart and dataset.
A polished official example does not supply a complete accessibility, responsive-layout, or content-maintenance strategy for a separate application.
Platform source: Primary exact-property D3 implementation evidence. D3’s official website presents its own interactive visualization examples and API documentation; the association is explicit and first-party. Platform evidence is separate from the direct website screenshot and is not a complete current infrastructure audit.
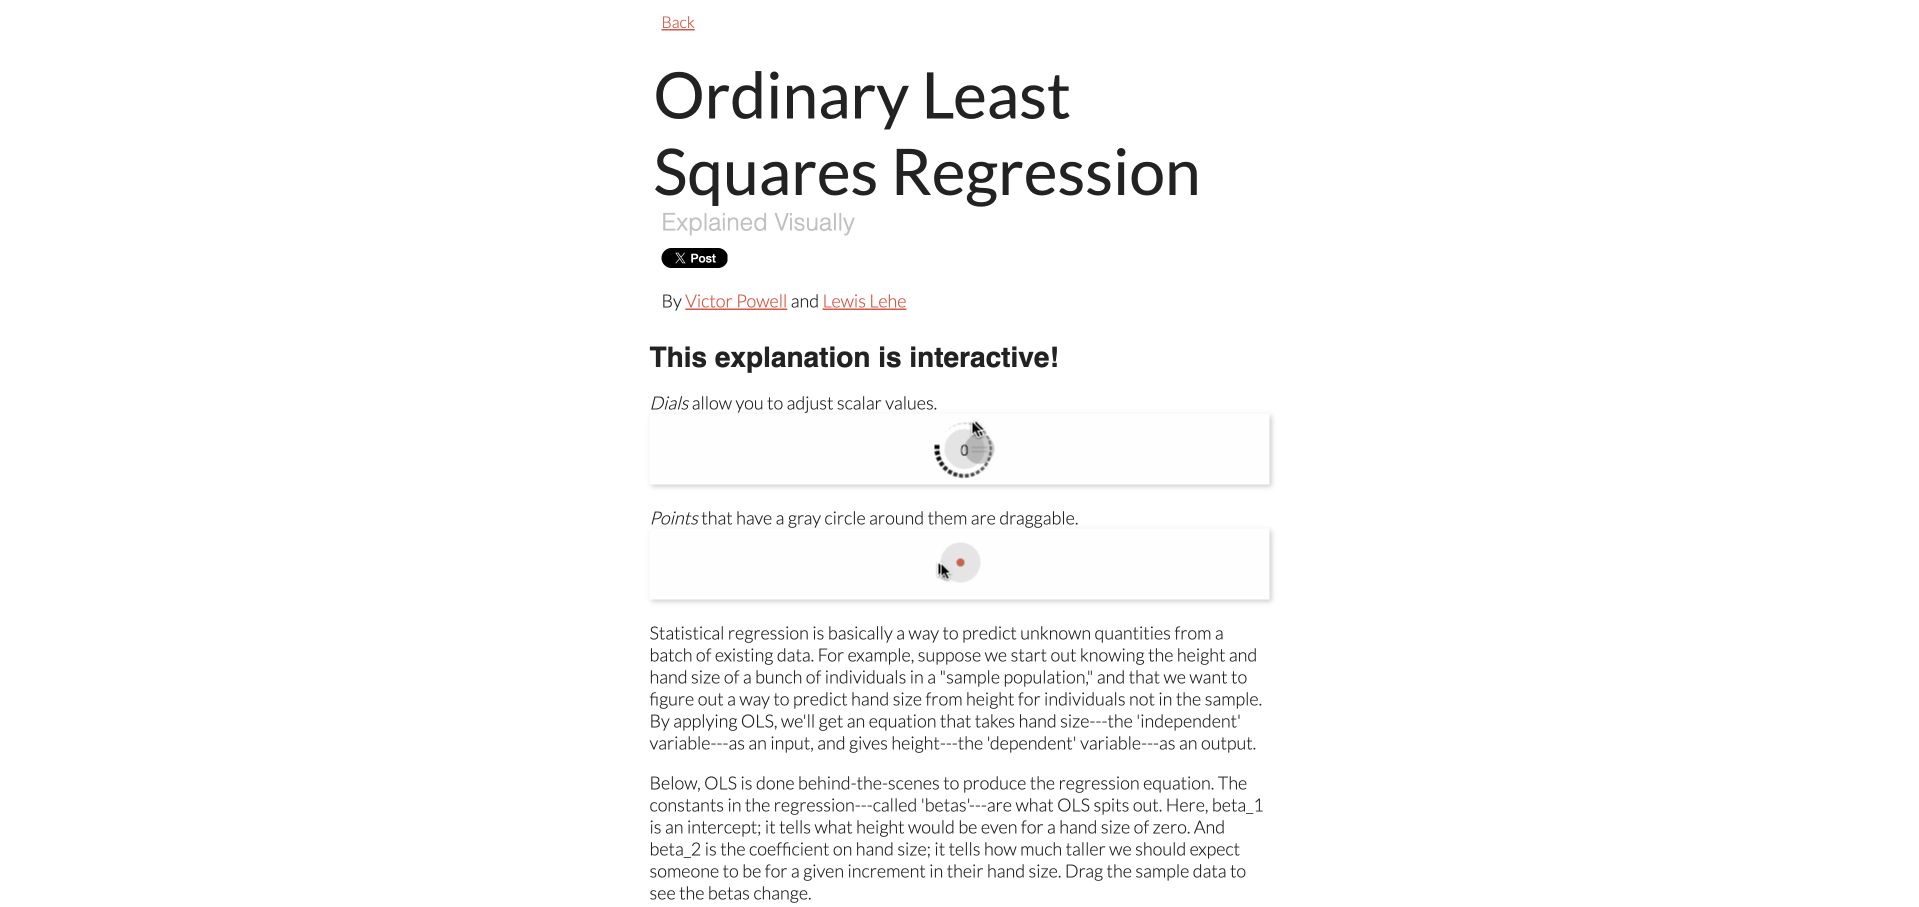
Setosa’s regression explanation teaches its controls before presenting the larger mathematical task. Small animated demonstrations show how dials change values and how points can be dragged; subsequent plots relate those gestures to a fitted line, coefficients, and squared errors. The original author’s Explained Visually repository links this teaching collection and declares D3. The association is limited to this older OLS explanation, not a claim that its dependency choices are current recommendations.
What you can learn
An unfamiliar interaction deserves its own brief explanation. Establish a consistent visual language for draggable marks and adjustable quantities, then reuse it so the reader can concentrate on the relationship between parameters, prediction errors, and the resulting fit.
Pros
Gesture demonstrations appear before the more demanding plots, making interaction a taught part of the explanation rather than a hidden feature.
The narrative connects numerical coefficients to visible geometric consequences, supporting readers who find an equation alone difficult to interpret.
Cons & considerations
Drag-only controls need keyboard alternatives and explicit values so the lesson remains usable beyond a precise pointer.
The original repository describes outdated tooling; reproducing the design should not mean copying an unmaintained dependency stack into a new project.
Platform source: Primary exact-property D3 implementation evidence. The original author’s Explained Visually repository links setosa.io/ev and declares D3 3.5; this review is limited to its OLS teaching feature. Platform evidence is separate from the direct website screenshot and is not a complete current infrastructure audit.
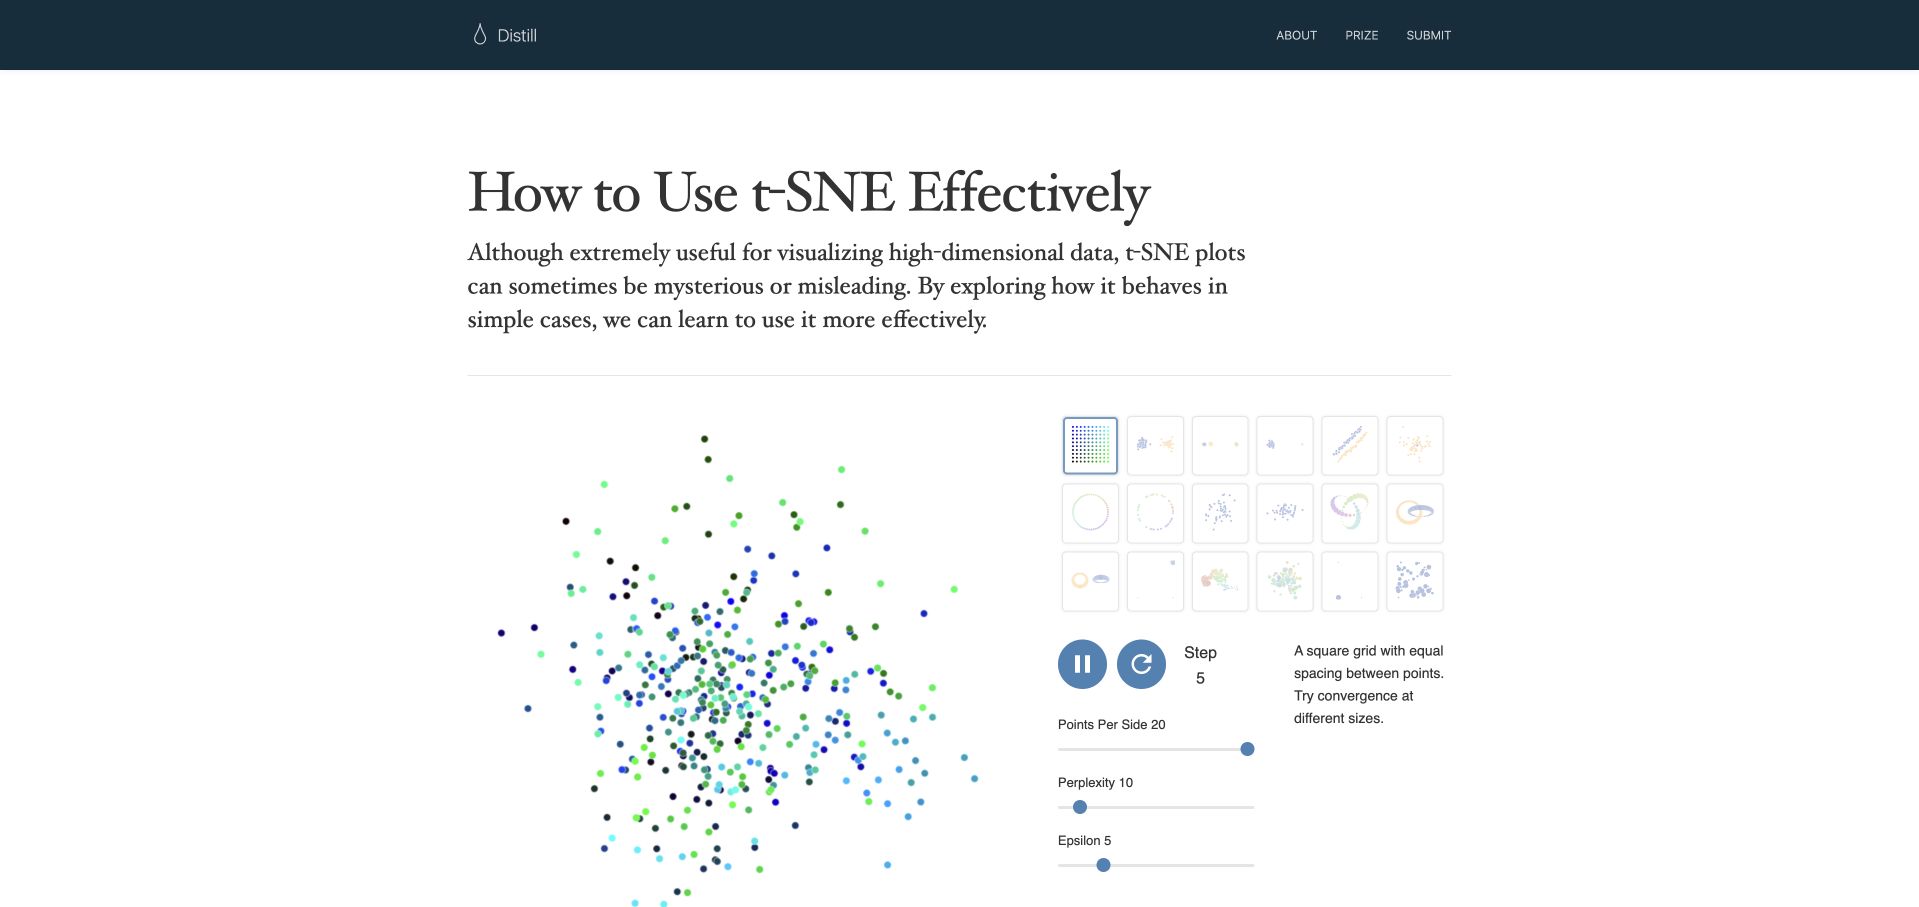
Distill’s 2016 t-SNE article places a live point-cloud experiment immediately below its title and introduction. A matrix of dataset thumbnails sits beside the plot, with playback and parameter controls grouped beneath it. The exact feature loads D3 and uses it in its interactive control code. This is a dated methodological explanation, not evidence about every Distill article or a guarantee that visually separated clusters represent meaningful groups in a new dataset.
What you can learn
Use interaction to test a claim’s limits rather than merely confirm the opening thesis. Keep alternative datasets and parameters close enough that a reader can compare outcomes, and explain which visual changes are properties of the method rather than discoveries about the data.
Pros
Dataset choices and algorithm controls occupy the same experimental area, making comparison a natural part of reading the article.
The article’s question-oriented framing encourages interpretation of the visualization rather than treating an impressive point cloud as self-explanatory.
Cons & considerations
Animated optimization can draw attention away from stable comparisons unless readers can pause and identify the current parameters.
Dense technical controls require written context and nonvisual explanations; manipulating a parameter does not establish understanding of its mathematical consequences.
Platform source: Primary exact-property D3 implementation evidence. The exact 2016 article loads D3 and contains D3 selections for its interactive controls; association is feature-specific. Platform evidence is separate from the direct website screenshot and is not a complete current infrastructure audit.
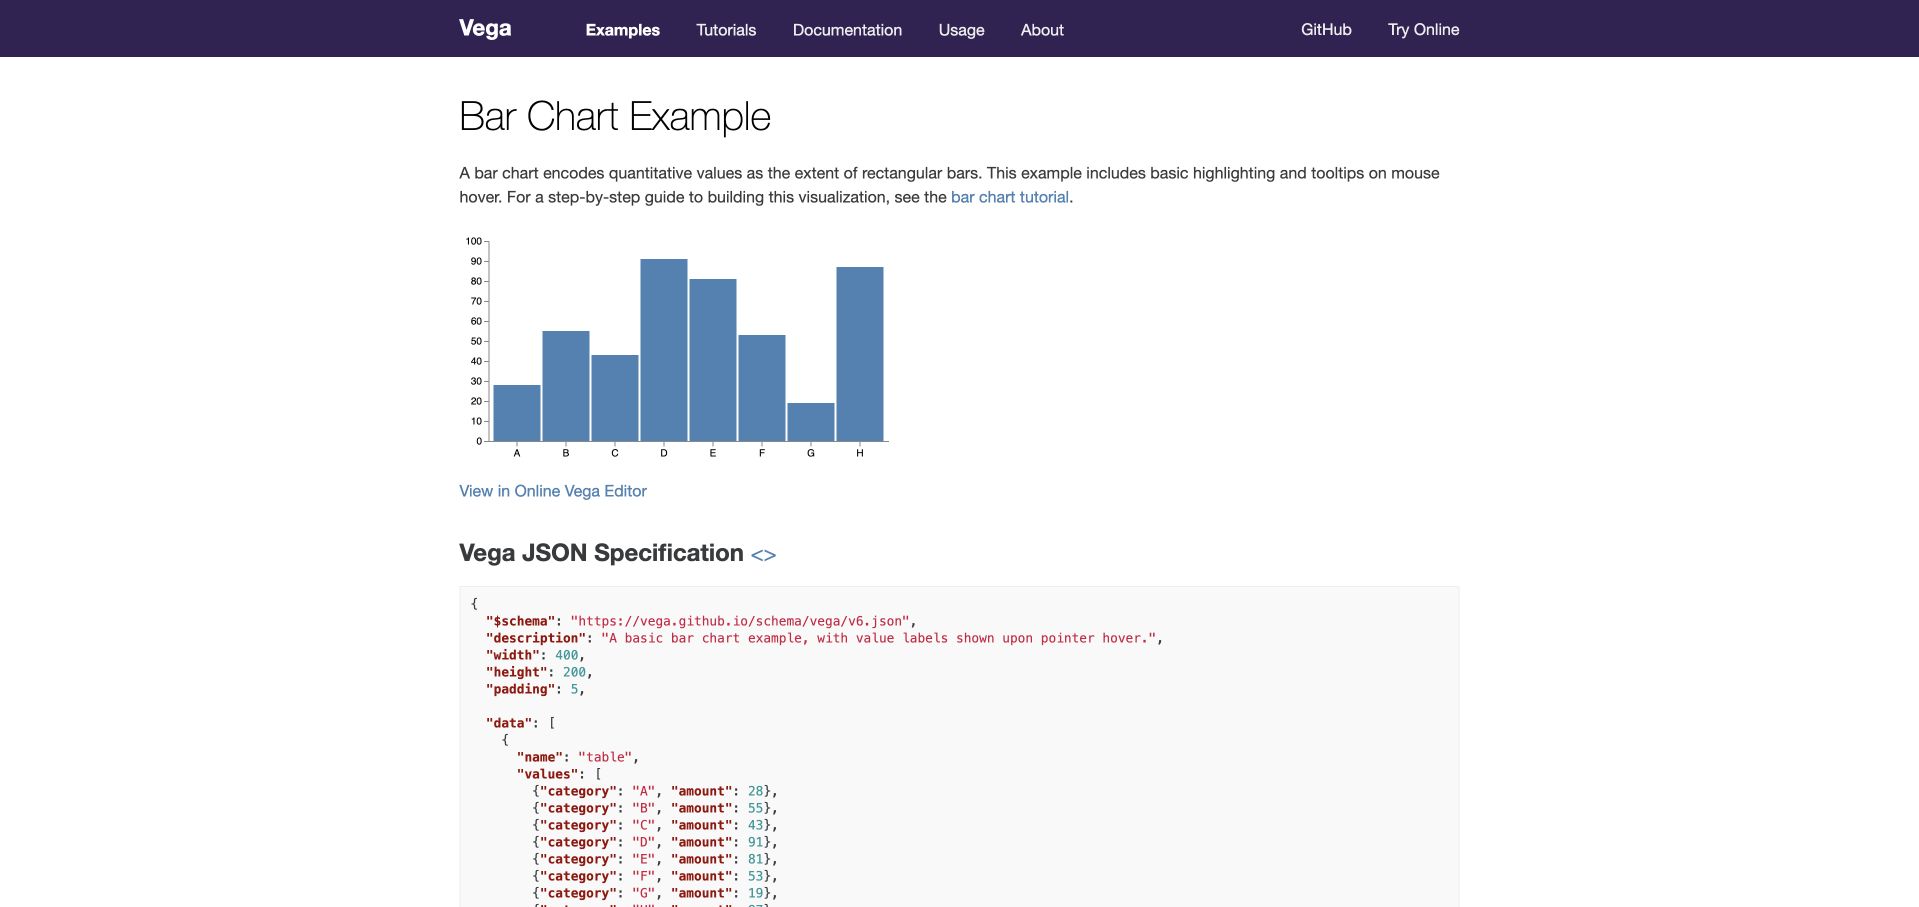
Vega’s bar-chart example puts a simple rendered chart above its JSON specification. A short description identifies the encoding and hover behavior, while links connect the result to a tutorial, source specification, and online editor. D3 is associated through Vega’s officially documented scale-package dependencies, not through a claim that the whole documentation site or every Vega renderer is a direct D3 selection. The small example remains an intentionally limited teaching dataset.
What you can learn
Keep a working result and its reproducible specification close together. For a declarative visualization system, readers should be able to trace data, scales, axes, signals, and marks without navigating between unrelated documentation pages or guessing which code produced the visible chart.
Pros
The short example connects a visible chart to its complete specification, reducing uncertainty about hidden setup or omitted transformations.
Tutorial and source links support both a guided first reading and direct inspection by an experienced implementer.
Cons & considerations
A long specification can dominate the page and needs readable formatting and navigation on smaller displays.
Hover behavior in a demonstration does not establish complete keyboard interaction or an equivalent presentation for readers who cannot inspect the graphic.
Platform source: Primary exact-property D3 implementation evidence. The official Vega example uses Vega runtime; its official scale package declares D3 array, interpolation, scale, and color-scale modules. Platform evidence is separate from the direct website screenshot and is not a complete current infrastructure audit.
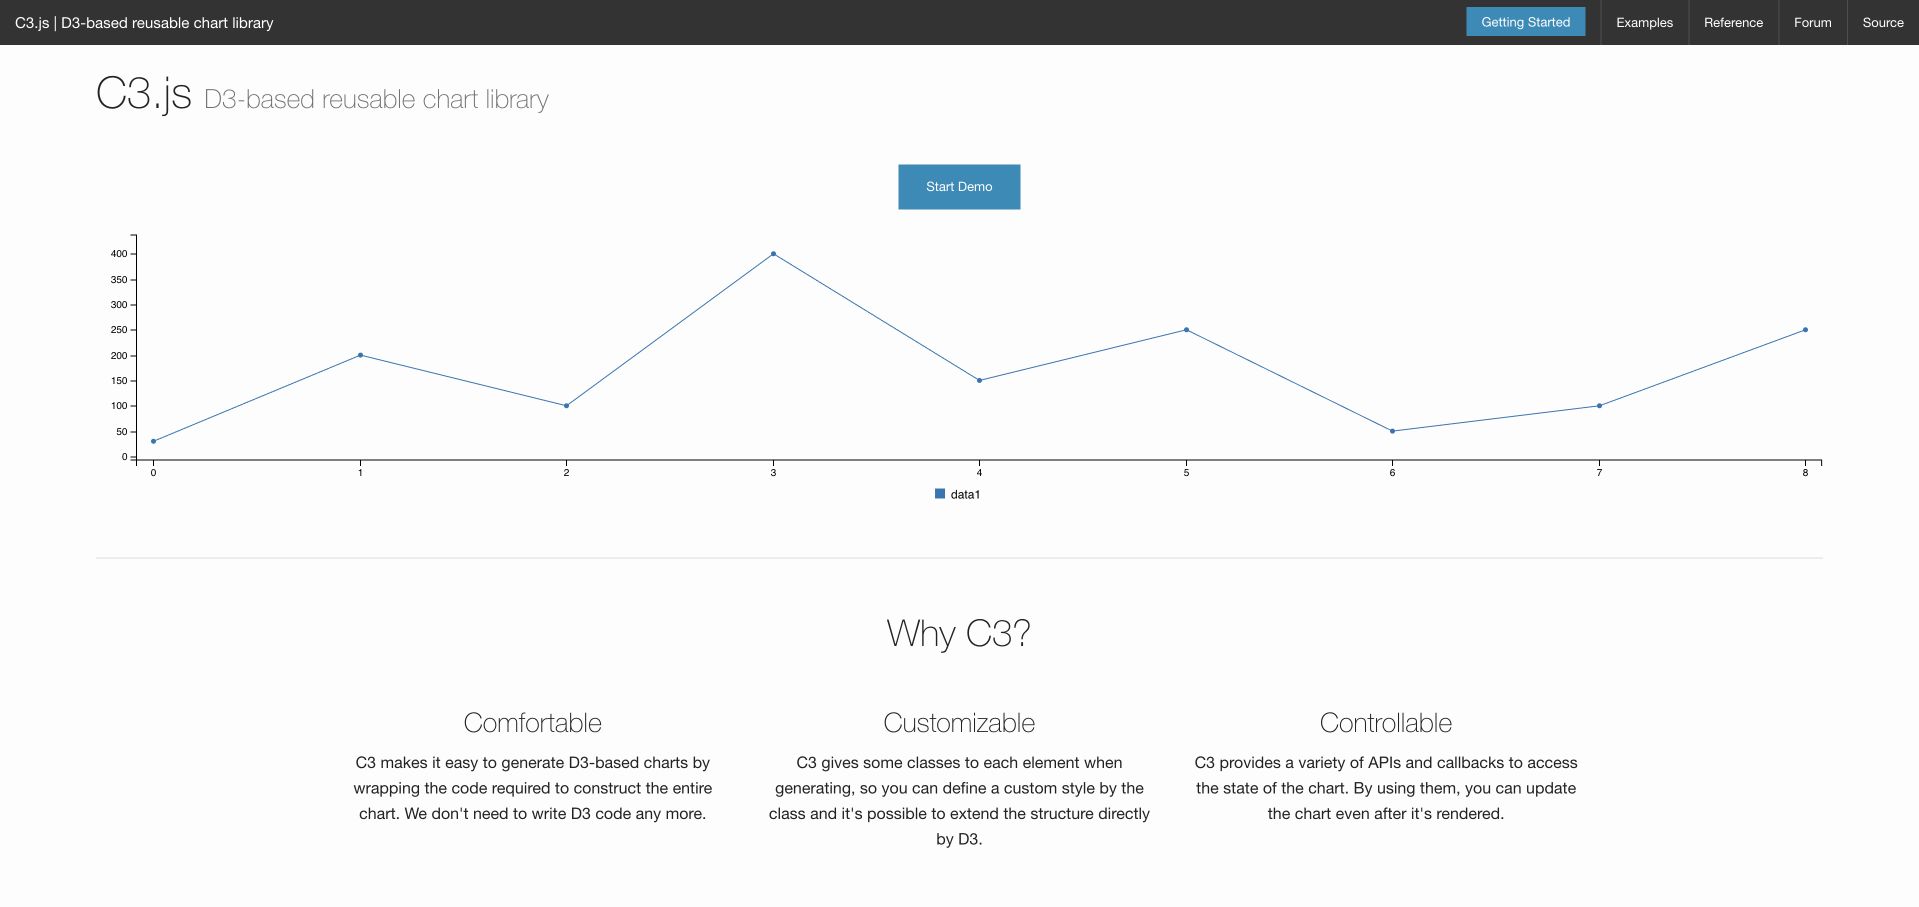
C3.js opens with a restrained dark navigation strip and a wide, already rendered line chart. A Start Demo control sits above the plot, followed by three concise explanations of comfort, customization, and control. The official property explicitly identifies C3 as a D3-based reusable chart library. That association concerns the charting layer and examples, not an assertion that every documentation element is drawn with D3 or that the displayed version fits every contemporary project.
What you can learn
A wrapper library should demonstrate the work it removes while exposing the control it preserves. Put a small working chart near the introduction, then show how configuration, callbacks, and underlying elements support common product requirements without implying that customization has no maintenance cost.
Pros
The initial chart provides a concrete output before the reader reaches a long installation or API explanation.
Benefits are separated into distinct concerns, making the library’s convenience and customization promises easier to evaluate independently.
Cons & considerations
Generic numbered categories in the demonstration do little to explain realistic labels, units, or the interpretation of the data.
A wrapper’s simplified API still needs version, dependency, accessibility, and responsiveness evaluation before adoption in a maintained application.
Platform source: Primary exact-property D3 implementation evidence. The official C3.js property explicitly identifies its reusable chart library as D3-based and presents a rendered example. Platform evidence is separate from the direct website screenshot and is not a complete current infrastructure audit.
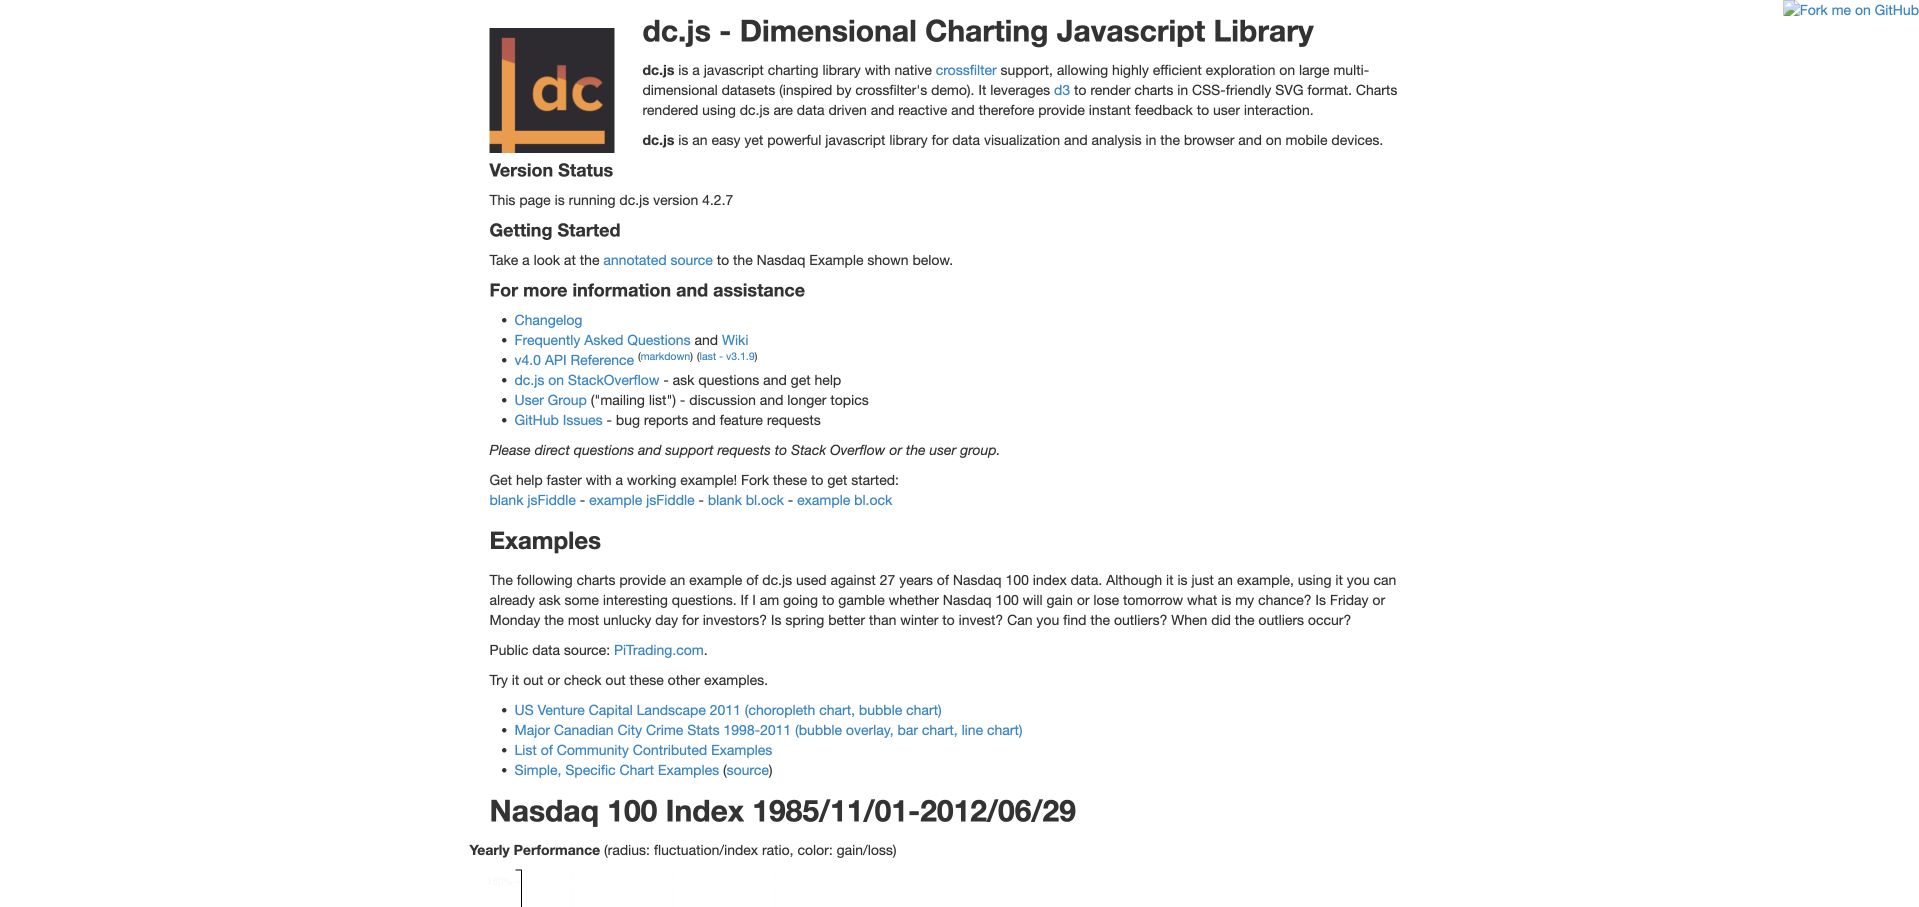
The dc.js property begins with its dimensional-charting purpose, version information, and support links before introducing a substantial Nasdaq example. Explanatory text states the questions that coordinated views might help investigate and names the historical dataset. The official page explicitly identifies D3 as its SVG rendering layer. The association concerns this charting library and public example, not current financial guidance, a live market dashboard, or every system that might use similar charts.
What you can learn
Explain the analytical purpose of coordinated filters before showing a dense dashboard. Each linked view should have a clear role, a visible active-filter state, and an understandable reset path so readers can distinguish a narrowed selection from a change in the underlying data.
Pros
Version and support information appear near the introduction, giving implementation examples practical context beyond their visual appearance.
The example is introduced through possible analytical questions rather than as an unexplained arrangement of many charts.
Cons & considerations
A text-heavy opening delays the main visualization and needs clear links for readers seeking the demonstration directly.
Historical index examples require explicit dates and limits; interactivity does not make them current market evidence or investment analysis.
Platform source: Primary exact-property D3 implementation evidence. The official dc.js page explicitly states that it leverages D3 to render SVG charts and provides its Nasdaq example. Platform evidence is separate from the direct website screenshot and is not a complete current infrastructure audit.
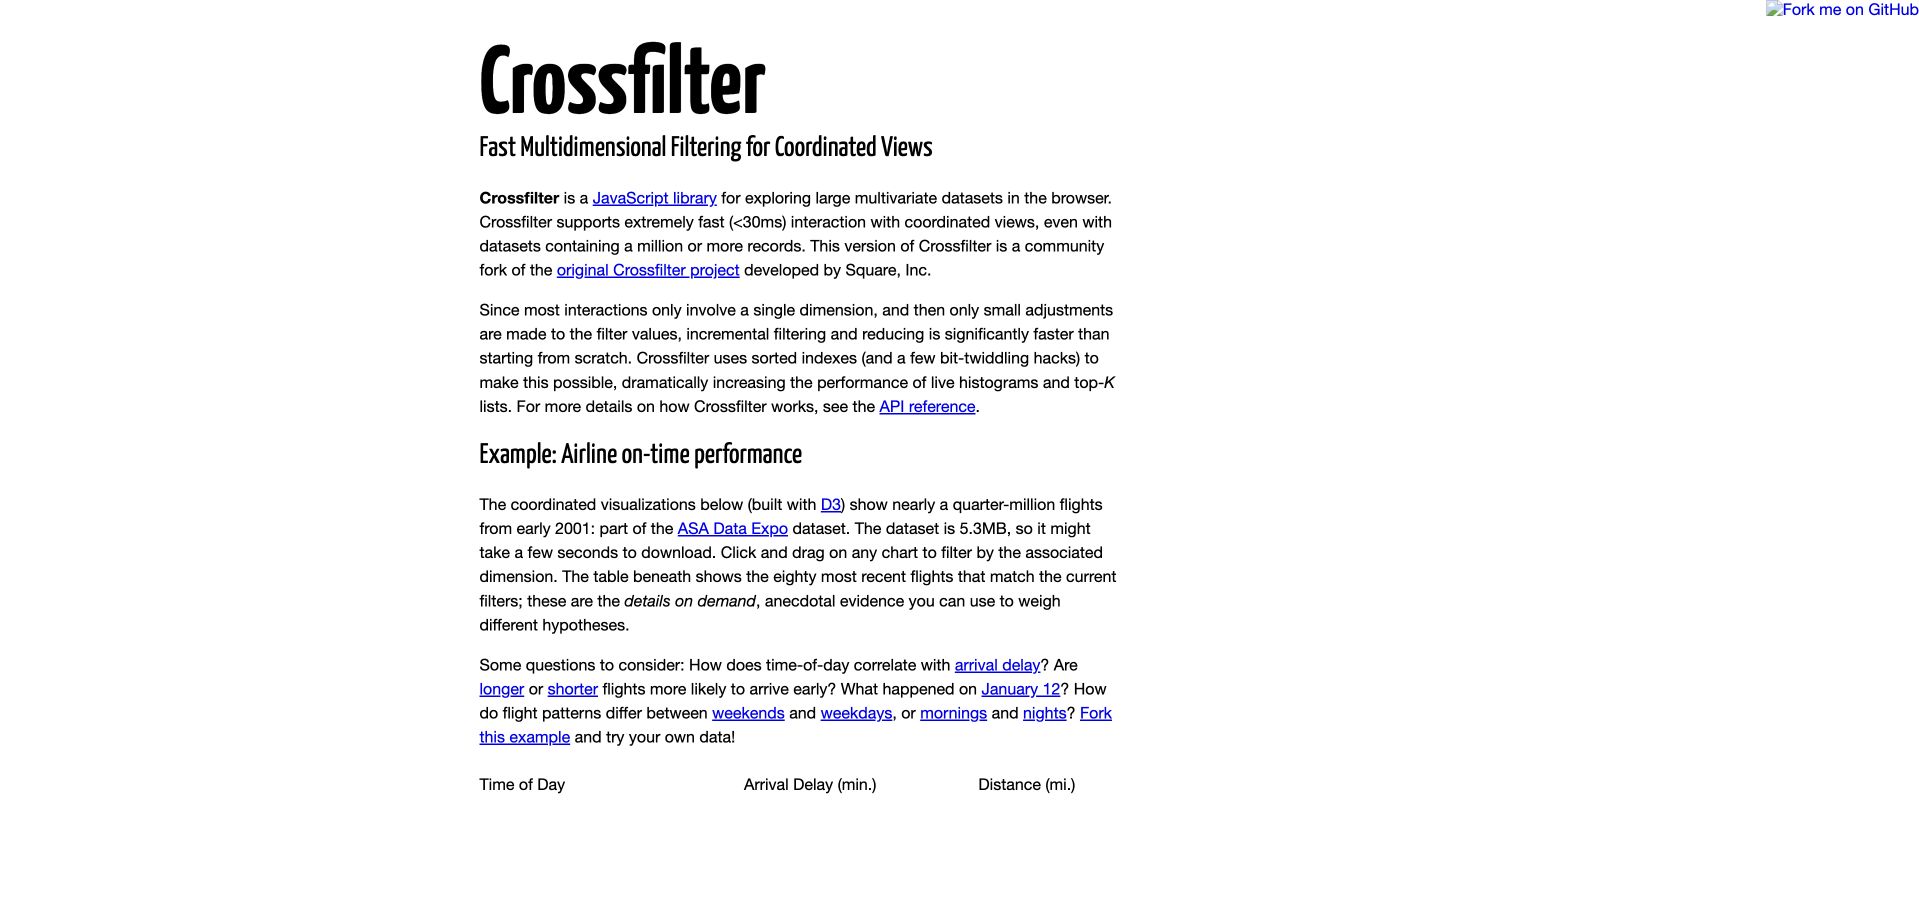
Crossfilter’s public page explains multidimensional filtering before presenting coordinated views of a historical airline dataset. Its introductory text identifies the example as D3-built, describes the early-2001 flight sample, and suggests questions about time of day, route length, and timing. This review concerns that public performance demonstration. It is not a current airline comparison, and Crossfilter’s data-filtering role should remain distinct from D3’s visible chart layer and the surrounding documentation.
What you can learn
Make linked filtering explicit at both the data and interface levels. Readers should understand that one selection changes the subset shown elsewhere, which records remain included, and how to return to the original population without having to reload or reconstruct their earlier exploration.
Pros
The introductory explanation separates fast filtering from rendering, helping developers understand the responsibilities of the combined libraries.
Suggested questions give the historical demonstration a purpose beyond testing whether multiple charts respond at once.
Cons & considerations
Large example downloads can delay useful content, so the page needs progress feedback and a clear distinction between loading and an empty result.
A legacy flight sample cannot support present-day service comparisons, even when its coordinated views remain effective teaching examples.
Platform source: Primary exact-property D3 implementation evidence. The official Crossfilter page explicitly identifies its coordinated airline visualizations as built with D3. Platform evidence is separate from the direct website screenshot and is not a complete current infrastructure audit.
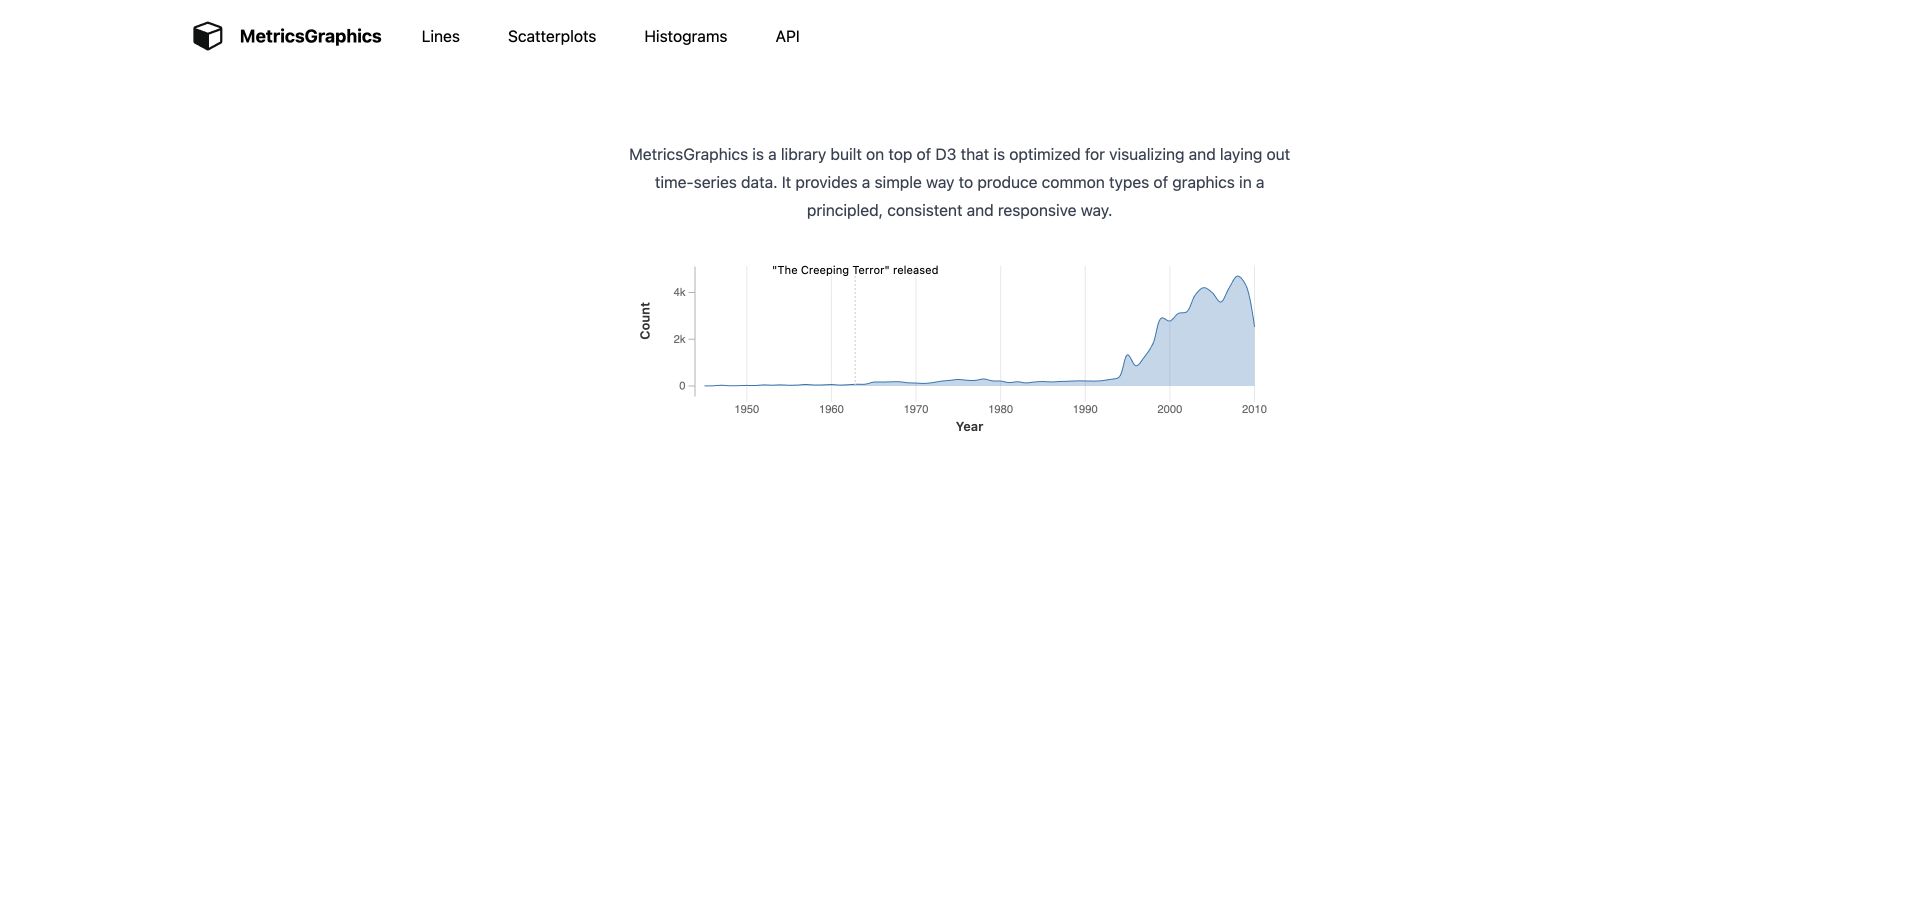
MetricsGraphics uses a compact header, a short explanation, and one time-series chart to introduce its purpose. Pale blue area shading, small axes, and a vertical event annotation make the example legible without a surrounding application dashboard. The official property explicitly identifies the library as built on D3. This association applies to its charting library and examples, not a claim that the historical demonstration dataset is current or that the surrounding website depends entirely on D3.
What you can learn
A chart library can communicate its defaults through one carefully chosen example. Demonstrate how labels, annotation, units, and context work together before adding many chart types, and evaluate whether those defaults remain understandable with realistic labels, gaps, and several possible display sizes.
Pros
The example includes an event annotation, showing how a chart can connect a temporal change to explanatory editorial context.
The small navigation set makes chart families and the API easy to find without overshadowing the rendered output.
Cons & considerations
The very spare presentation leaves evaluation questions about responsive behavior and accessible data alternatives for later documentation.
A simple historical series does not reveal how the library handles irregular intervals, missing observations, or several competing annotations.
Platform source: Primary exact-property D3 implementation evidence. The official MetricsGraphics property explicitly describes its library as built on D3 and shows a rendered time-series example. Platform evidence is separate from the direct website screenshot and is not a complete current infrastructure audit.
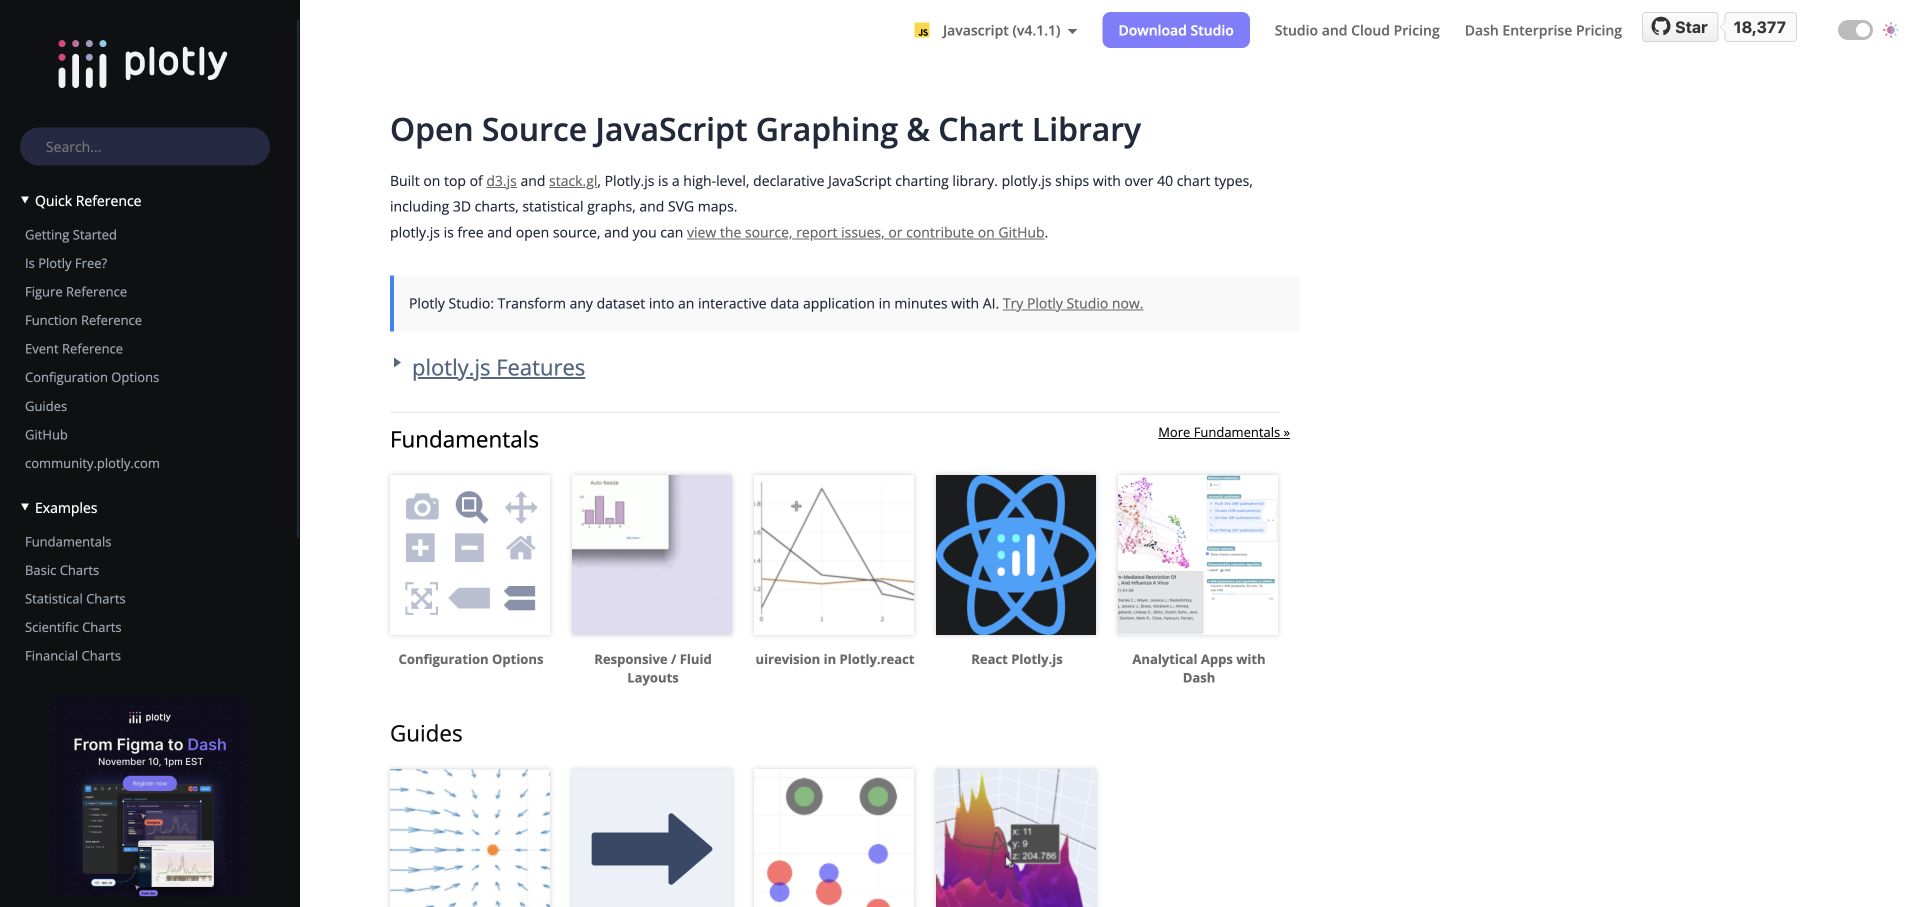
Plotly’s JavaScript documentation pairs a dark sidebar with an example catalogue. Fundamentals, guides, and chart families occupy the main area, while the header distinguishes the JavaScript version and related commercial products. The official project identifies D3 and stack.gl as underlying technologies. This is a library-level association with different rendering paths, not a claim that every Plotly chart is SVG, every documentation thumbnail is interactive, or the entire company website uses D3 directly.
What you can learn
A broad chart library needs information architecture that separates conceptual tasks, chart families, integrations, and paid services. Keep version context visible and let each example explain its data and rendering assumptions so users do not mistake a visual catalogue for a complete implementation specification.
Pros
The sidebar preserves a clear route among quick reference, fundamentals, scientific charts, and other major documentation groups.
Version context appears in the header, making it easier to relate a copied example to a particular library release.
Cons & considerations
Commercial calls to action compete with technical reading and should remain visibly distinct from the open-source documentation task.
Different chart rendering paths require separate performance and accessibility checks; one successful example cannot establish behavior across the entire catalogue.
Platform source: Primary exact-property D3 implementation evidence. The official Plotly.js source and JavaScript documentation explicitly identify D3 and stack.gl as underlying technologies; rendering varies by chart type. Platform evidence is separate from the direct website screenshot and is not a complete current infrastructure audit.
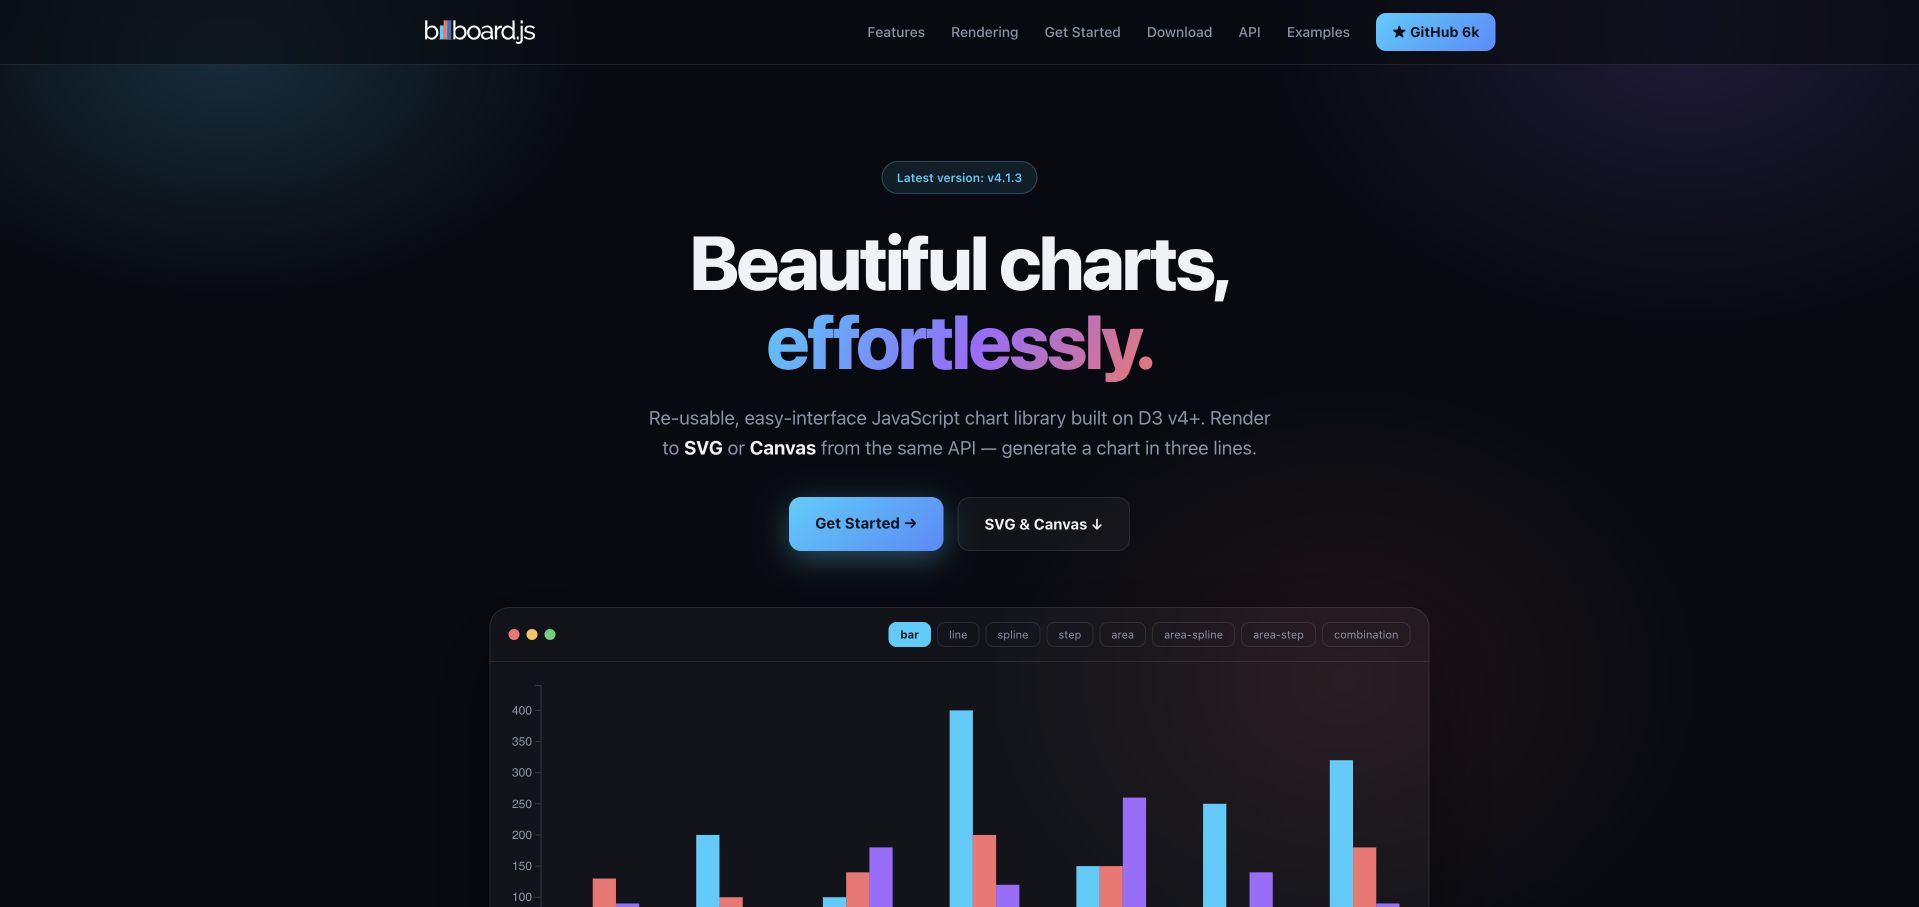
Billboard.js uses a dark gradient opening with a strong charting promise, clear getting-started routes, and an embedded colorful chart below. Its introduction explicitly distinguishes SVG and Canvas rendering through the same API, while the project navigation separates examples, reference material, and releases. NAVER’s official project property states that the library is built on D3. The association concerns this charting project, not NAVER’s unrelated products or a guarantee that both rendering paths behave identically.
What you can learn
State important rendering choices before a developer has committed to an example. A shared configuration API can simplify application code, but the documentation still needs to explain differences in text, interaction, export, performance, and accessible alternatives across the available output modes.
Pros
The rendered chart turns the introductory promise into a concrete visual result without requiring an installation or account.
The SVG-and-Canvas distinction appears near the main action, giving an architectural choice useful prominence at the evaluation stage.
Cons & considerations
A visually striking dark example needs evaluation against a real application’s contrast, annotation, and print requirements.
A common API does not remove renderer-specific limitations, so export, interaction, and accessibility behavior need their own documented checks.
Platform source: Primary exact-property D3 implementation evidence. NAVER’s official project page explicitly states that billboard.js is built on D3 v4+ and can render SVG or Canvas. Platform evidence is separate from the direct website screenshot and is not a complete current infrastructure audit.
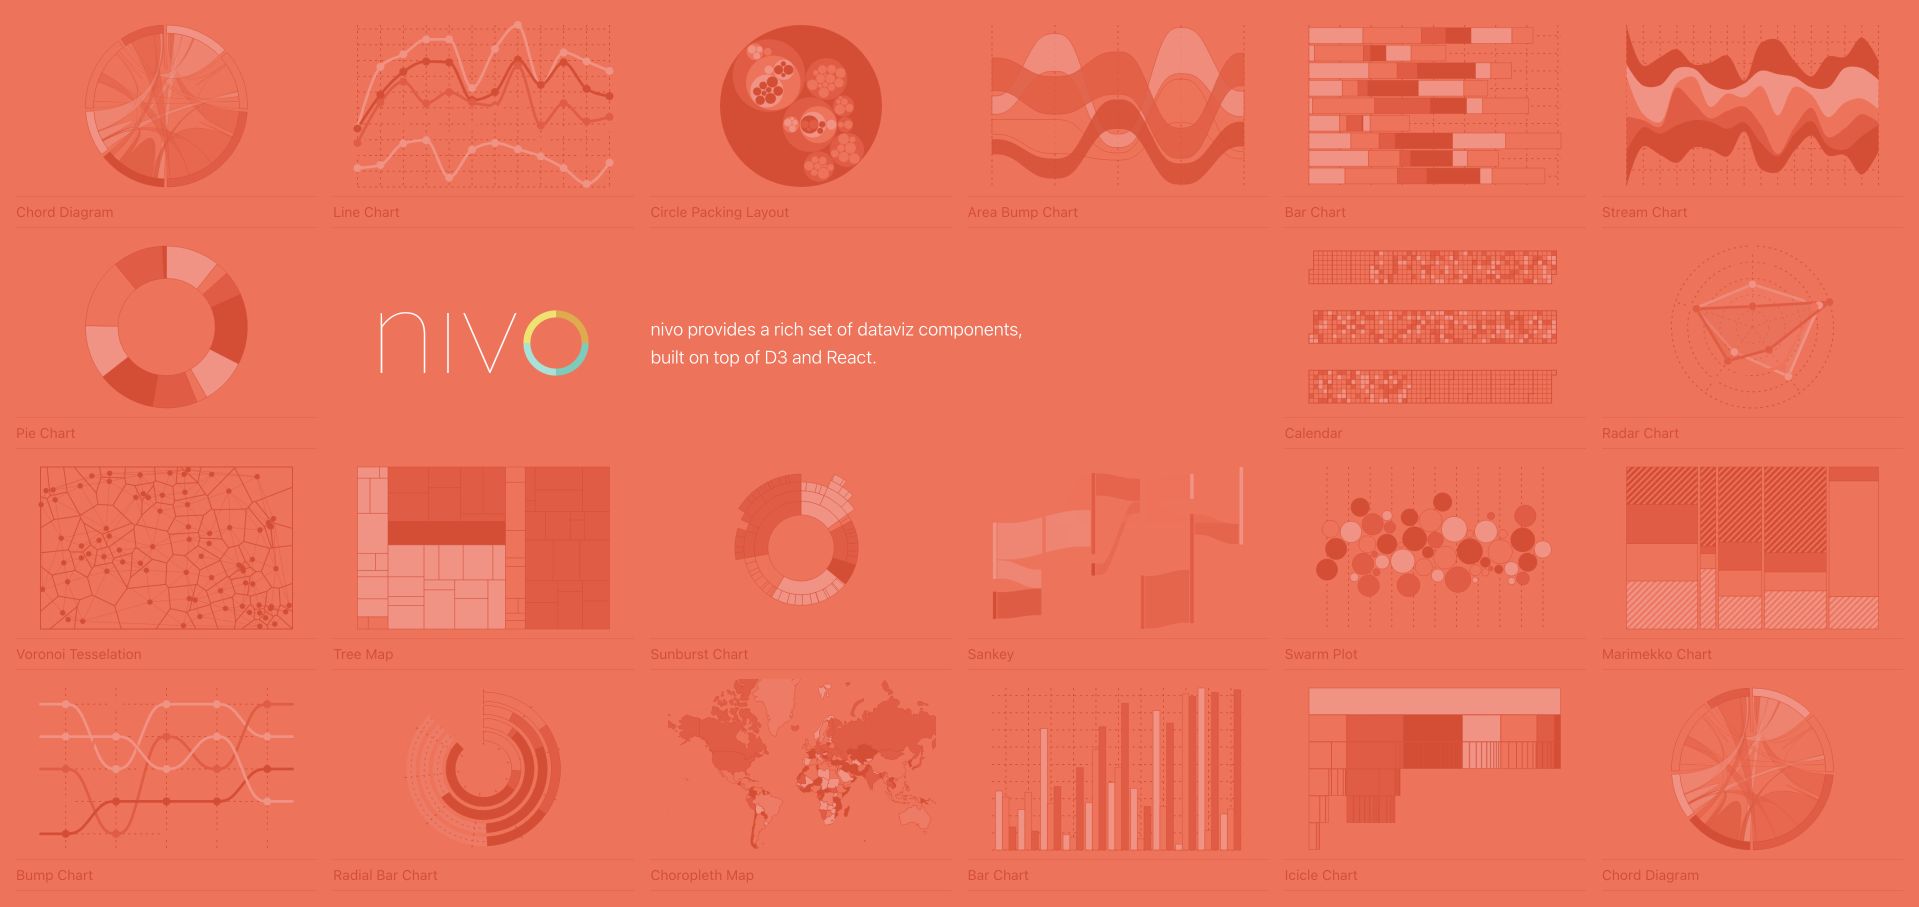
Nivo’s homepage turns its chart collection into the opening composition. A coral field holds named chart previews around a central library introduction, with each tile linking to its component page. The official property explicitly describes Nivo as built on D3 and React. That establishes the visualization-component relationship, not a claim that every thumbnail is a live chart or that D3 alone controls the surrounding React documentation and application state.
What you can learn
An example mosaic can double as navigation when every tile has a clear destination and descriptive name. Preserve a conventional component index as an alternative, and let the detail page explain required data structure, output mode, responsiveness, and configuration without relying on the homepage’s visual shorthand.
Pros
The opening exposes a wide range of chart families immediately, making visual browsing a meaningful route into component documentation.
Descriptive chart links provide clearer destinations than unnamed decorative shapes or a single generic exploration button.
Cons & considerations
A dense mosaic can be difficult to scan with magnification or a narrow viewport unless an equivalent structured index remains available.
Attractive sample shapes do not establish which chart is appropriate for a particular analytical question or dataset structure.
Platform source: Primary exact-property D3 implementation evidence. The official Nivo website explicitly describes its visualization components as built on D3 and React. Platform evidence is separate from the direct website screenshot and is not a complete current infrastructure audit.
Kegan has 15+ years of experience working with small businesses, Fortune 500 companies, and everything in between. No development job is too big or too small: he brings the same hands-on attention to a focused improvement, a complete website, or a custom application.
For D3.js projects, he can help with responsive interfaces, reusable components, custom functionality, API connections, and performance-minded implementation. He works directly with clients on scope, design, implementation, testing, and handover, with an emphasis on clear communication and a system that remains practical to maintain after launch.
Show 3 other D3.js developersHide other D3.js developers
Choose the level of visualization control the task actually needs
Use D3 directly for a genuinely bespoke explanation
Custom educational gestures, unusual relationships, and tightly authored narrative interaction may justify direct control of scales, shapes, selections, and transitions. Budget for labels, layout, interaction, accessible alternatives, and maintenance as part of the same implementation.
Use a D3-based chart system for repeated conventional outputs
Plot, Nivo, C3, billboard.js, and other libraries make different tradeoffs between configuration and low-level control. Verify the exact version, renderer, data contract, and extension points. A shared D3 dependency does not make their APIs or accessibility behavior interchangeable.
Use a declarative specification when reproducibility is central
A system such as Vega can keep data, scales, marks, and signals in a readable specification. Pair the rendered result with a working example and explicit source. Treat editor loading, exports, and data fetching as separate operational concerns.
From references to requirements
Plan the data contract, interpretation, and fallback before polishing transitions
Document the dataset and its limits
Record provenance, licenses, dates, units, missing values, and transformations. Distinguish historical teaching samples from current indicators. Do not let a successful animation imply completeness, causality, or suitability for a consequential decision.
Specify interaction state and sharing
Define filters, selections, time, parameters, reset behavior, and any shareable address. Keep public state free of private information, and make clear whether a shared view reproduces data, a live query, or only a temporary display configuration.
Provide equivalent ways to read the result
Plan descriptive text, useful tables or downloads, keyboard controls, focus behavior, reduced motion, and noncolor identification. Test long labels, empty results, dense selections, zoom, and smaller displays with actual representative data.
Separate the data engine from the interface
Assign responsibility for loading, validation, transformation, rendering, and application state. Version the dependency boundary and check renderer-specific behavior. A D3 module in a package file is not a complete account of the visible frontend or private backend.
A useful handover demonstration
Ask the actual team to carry out its routine job: publish a realistic update, correct a mistake, preview a narrow screen, and identify who owns an integration failure. For a library or frontend framework, also ask who maintains the content source and deployment. A polished screenshot does not answer those operational questions.
Beyond the screenshot
D3 visualization project checklist
Write the question the chart should help answer.
Define population, dates, units, and source.
Preserve raw data and document transformations.
Choose scales and encodings deliberately.
Explain uncertainty and missing observations.
Keep active filters and the current time visible.
Provide a predictable reset and pause state.
Teach unfamiliar gestures near the control.
Offer keyboard and noncolor identification.
Plan a useful textual or tabular alternative.
Test narrow screens, long labels, and empty selections.
Record library versions, renderers, and maintenance owners.
Test with real content, a keyboard, a small screen, slow or failed requests, and the people who will maintain the system. These are planning checks, not an accessibility, security, performance, or search-ranking certification.
Sources & editorial method
How this D3.js collection was reviewed
Twenty distinct public properties were directly captured in the browser and reviewed on November 8, 2026 Pacific time; new capture timestamps can fall on November 9 UTC. Each review combines original observations with primary evidence for an exact D3 feature, an explicit library relationship, or documented D3 modules within a named system. The first five are explicitly selected recognizable institutional or established project properties. Seeing Theory is archived, the film-dialogue essay and t-SNE article retain historical context, and legacy teaching dependencies are not recommendations for new production work. No private data, account, upload, query submission, or backend configuration was inspected. The publisher conducts the separate broad technology audit.
Every image is an unmodified capture from the actual website, with its source and capture date. Some captures are reused from our shared catalog; their dates remain the original capture dates. None comes from a vendor gallery or a generated reconstruction. Moving imagery and live content can change.
Technology attribution uses public page assets or metadata, official platform documentation, or a cited first-party project case study. Documentary and framework-relationship evidence is identified where used; it is not a complete current backend inventory. A CMS image CDN alone does not establish a full CMS deployment. A library’s presence does not prove which individual controls use it, and a platform label does not establish AI authorship.
The composition notes, lessons, pros and tradeoffs are original editorial observations. We have not measured conversion, traffic, security, performance or accessibility conformance. Website owners retain their brands and imagery; these examples are not our client portfolio. Written, Edited and Curated are independent records, not dates advanced by a build. See our editorial standards or suggest a correction.
Questions worth asking
D3.js website development FAQs
Does a D3 dependency mean the whole website is built with D3?
No. D3 can supply one scale, parser, geographic calculation, chart layer, or interaction. The surrounding publication, frontend framework, application state, and server can use different systems. Each example keeps its evidenced boundary explicit.
Should every chart project use D3 directly?
Not necessarily. A higher-level library or declarative system can be a better fit for conventional repeated charts. Direct D3 control is most useful when a specific visual relationship or interaction justifies the additional implementation responsibility.
Why include archived or older visualization examples?
They demonstrate durable explanatory patterns, but their lifecycle matters. The guide labels those examples and does not treat old dependencies, historical datasets, or continued availability as evidence of current maintenance or current facts.
Does an interactive chart prove the underlying analysis?
No. A chart is a representation. Sampling, definitions, transformations, uncertainty, and analytical validity require their own evidence and review. Movement, polish, and brand familiarity do not resolve those questions.
The most useful D3 inspiration makes a relationship easier to inspect and its limits easier to understand. Borrow the explanatory structure, not an unsupported architecture claim or a historical dataset’s conclusions.